Inspiration
We were inspired to create YBVisualize after watching a YouTube video that showcased an interactive dashboard for data analysis. The idea of automating data visualization and combining it with AI/ML insights sparked our interest, leading us to build our own version using CSV data as the main input.
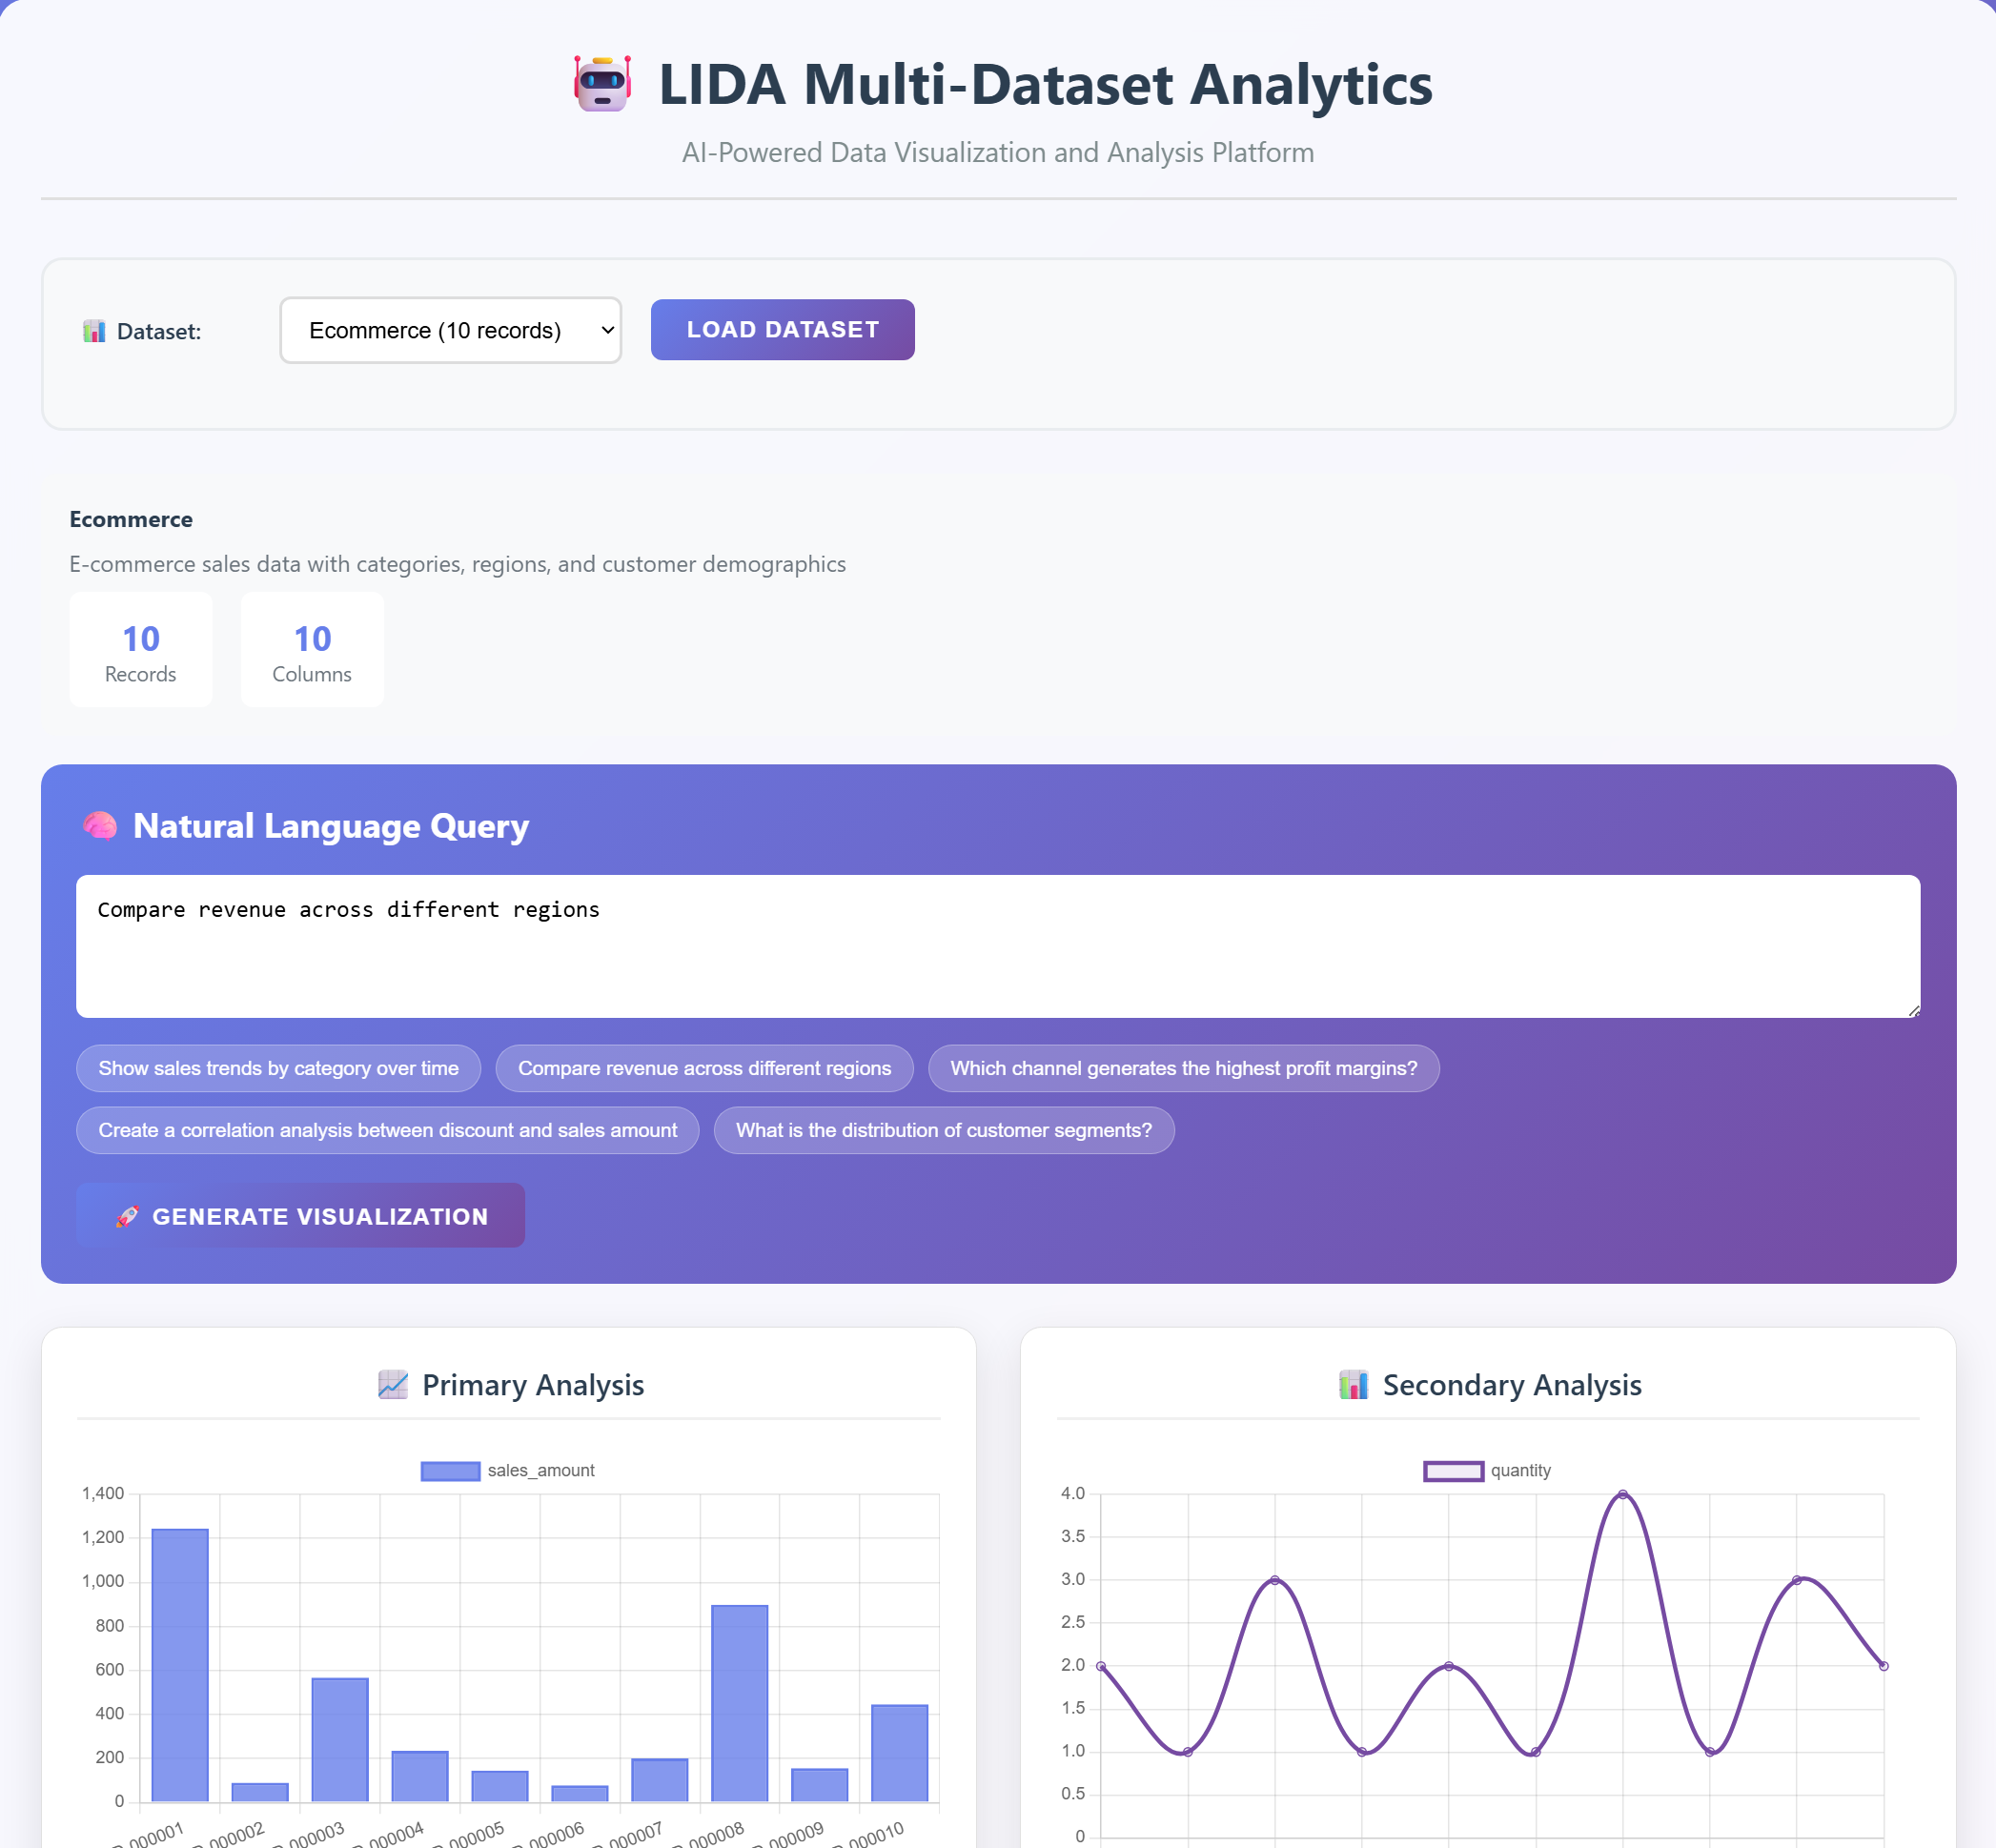
What it does
YBVisualize automatically visualizes CSV data and generates interactive charts, such as line, bar, scatter, and pie charts. It also leverages AI/ML to provide predictive analytics, anomaly detection, and clustering, allowing users to uncover hidden patterns and insights from their data.
How we built it
We built YBVisualize using a combination of Java, Python, JavaScript, and HTML: JavaFX: Used to create the interactive chart interface, allowing for dynamic and responsive visualizations. Java Swing: Integrated with JavaFX to display multiple charts in a flexible layout, enabling smooth user interaction. Python: Employed for machine learning models that provide predictive analytics, anomaly detection, and clustering, which run directly from Python scripts. JavaScript: Used for handling client-side interactions and ensuring smooth updates to the user interface. HTML: Used to structure the web-based dashboard, providing a clean and responsive interface for displaying visualizations and interacting with the data.
Challenges we ran into
AI/ML Integration: One of the biggest challenges was finding an effective way to integrate AI/ML models for prompting and prediction directly into the dashboard. Ensuring that the models delivered meaningful, real-time insights without causing delays was tricky. Generalization: Developing a solution that could handle a wide variety of CSV datasets with different structures and formats was challenging. Making the tool flexible and generalized enough to work with any dataset while maintaining accuracy and performance required significant effort. Data Handling: Processing and cleaning CSV data for consistency and accuracy while integrating it with the visualizations posed difficulties, especially with larger or incomplete datasets. UI/UX: Ensuring seamless integration between JavaFX and Java Swing components to display multiple charts without affecting performance or responsiveness was a challenge. Real-time Updates: Achieving real-time updates for visualizations and predictions as users interacted with the data or uploaded new CSV files was complex and required careful optimization.
Accomplishments that we're proud of
AI/ML Integration: Successfully integrated machine learning models to provide predictive analytics, anomaly detection, and clustering directly within the dashboard, offering real-time insights as users interact with their data. Dynamic Visualizations: Built an interactive dashboard with JavaFX and Java Swing, allowing users to visualize CSV data through dynamic and customizable charts that automatically update as new data is uploaded. Data Processing: Developed a robust pipeline to handle and clean CSV datasets of varying structures, ensuring that the data was processed consistently for accurate visualizations and insights. Real-Time Predictions: Enabled real-time machine learning predictions and anomaly detection, making the tool more powerful for immediate data-driven decision-making. User Interface Design: Created a smooth, user-friendly interface that integrates machine learning insights with visualizations in a way that is both functional and intuitive for users.
What we learned
Machine Learning Integration: We gained hands-on experience in integrating AI/ML models into a real-time, interactive dashboard, learning how to connect Python-based machine learning models with JavaFX visualizations seamlessly. Handling Diverse Data: We learned how to process and clean CSV data from diverse sources, adapting our solution to handle various formats and structures while ensuring data integrity for visualization and analysis. Real-Time Data Processing: We developed a deeper understanding of managing real-time data updates, ensuring that predictions and visualizations are updated on-the-fly as new data is uploaded. UI/UX Design: We improved our skills in designing intuitive user interfaces, specifically using JavaFX and Java Swing, to build a flexible and responsive dashboard that works well for data visualization. Problem-Solving: Tackling challenges like generalizing the tool for any type of dataset and balancing performance with real-time predictions taught us how to think critically and iteratively to optimize both the functionality and the user experience.
What's next for YBVisualize
Additional data formats: Expand support for data formats like Excel and JSON. Real-time data: Implement support for live data streams (e.g., financial or IoT data). Advanced AI features: Add more complex machine learning models for tasks like time series forecasting or text analysis. Mobile app: Develop a mobile version of the dashboard for on-the-go data analysis.


Log in or sign up for Devpost to join the conversation.