Devpost
Participate in our public hackathons
Devpost for Teams
Access your company's private hackathons
Grow your developer ecosystem and promote your platform
Drive innovation, collaboration, and retention within your organization
By use case
Blog
Insights into hackathon planning and participation
Customer stories
Inspiration from peers and other industry leaders
Planning guides
Best practices for planning online and in-person hackathons
Webinars & events
Upcoming events and on-demand recordings
Help desk
Common questions and support documentation
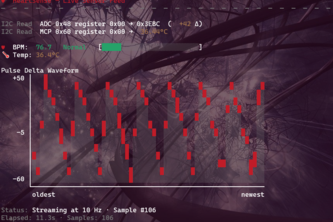
A real-time vital signs monitor built from scratch with a Raspberry Pi, analog sensors, and a live web dashboard, turning raw electrical signals into actionable heart rate and temperature data.
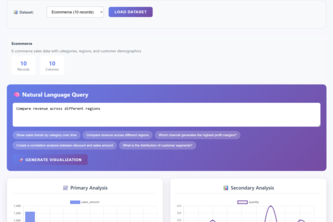
Dynamic Chart Dashboard is a web-based tool that automatically visualizes CSV data and provides AI-powered insights, helping users explore and analyze their data efficiently.