-
-
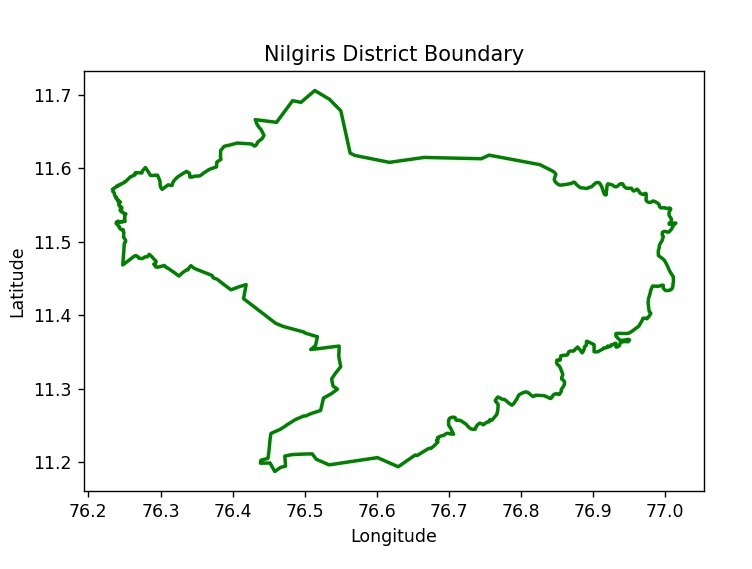
Nilgiris Boundary
-
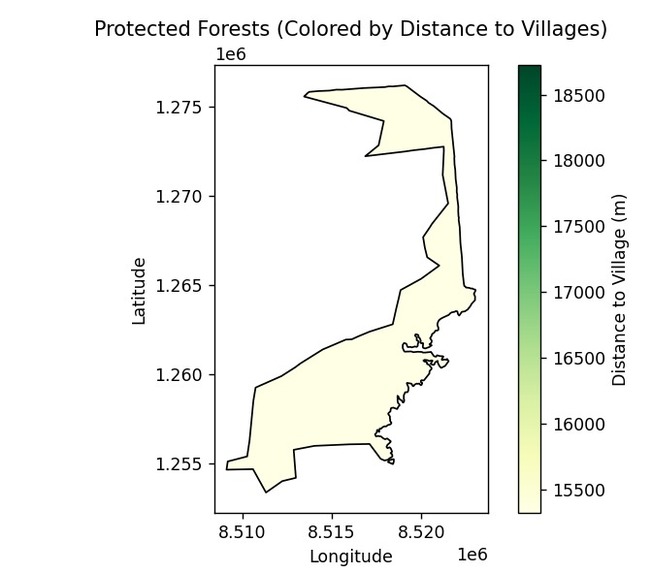
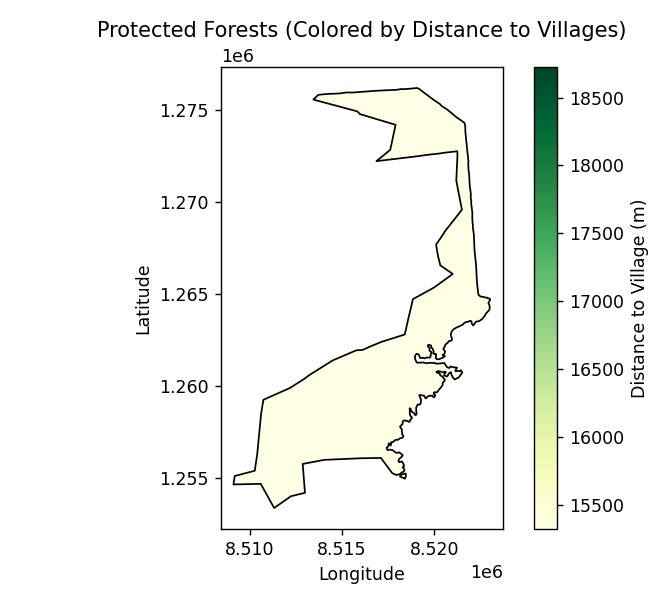
Forest in Nilgiris
-

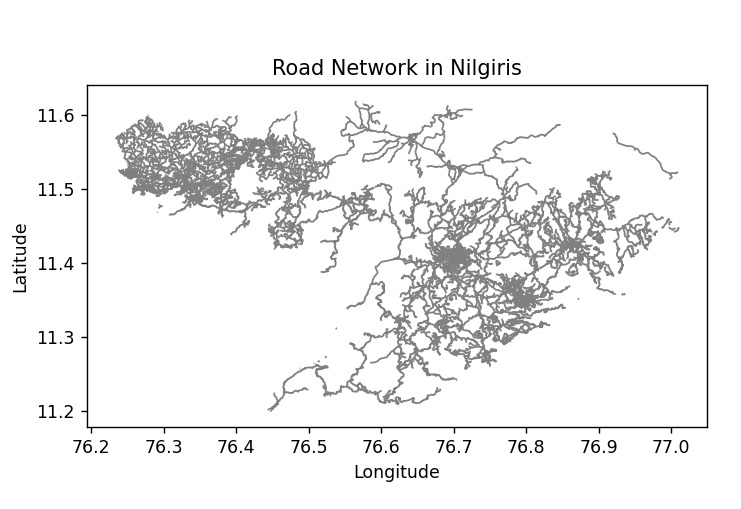
Road network in Nilgiris
-
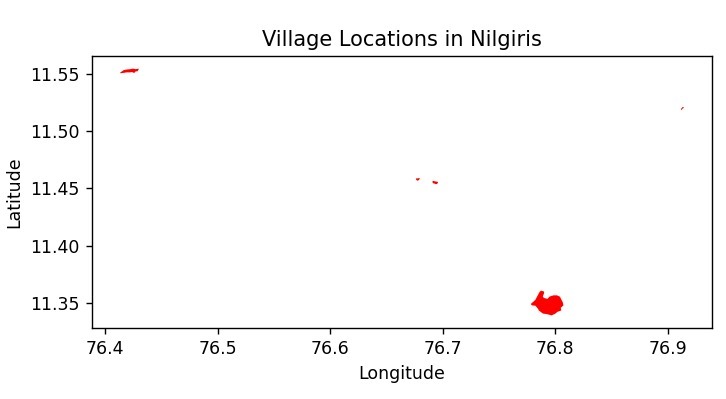
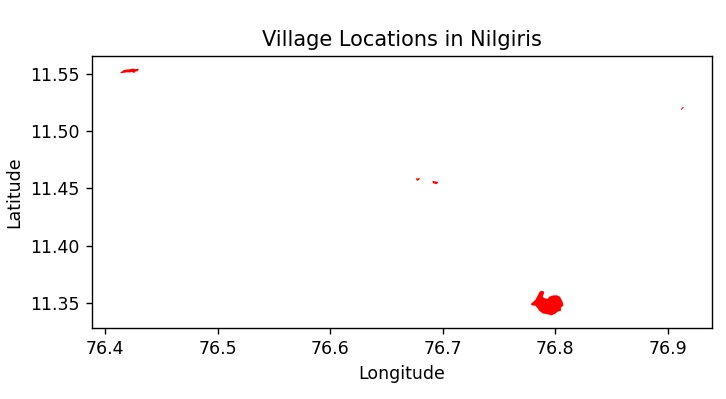
Villages in Nilgiris
-
Input
-
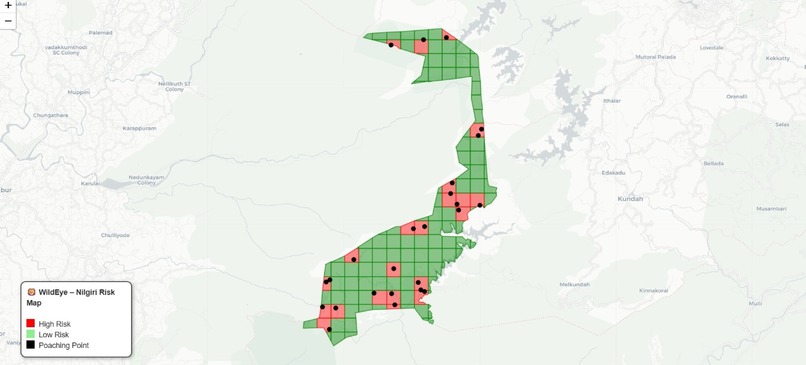
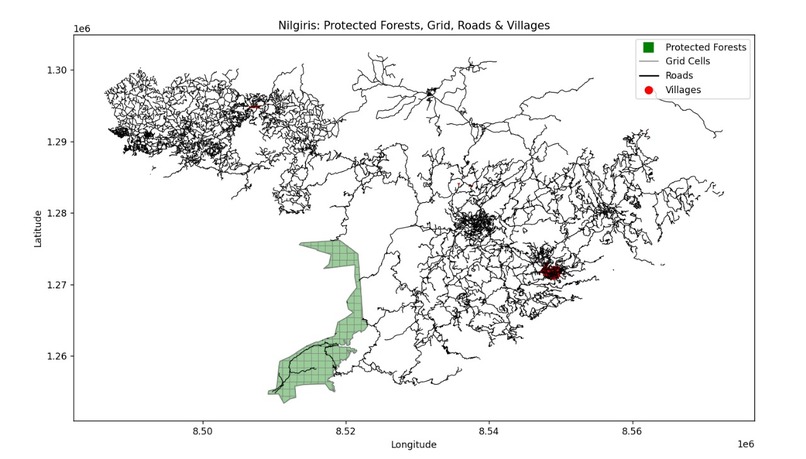
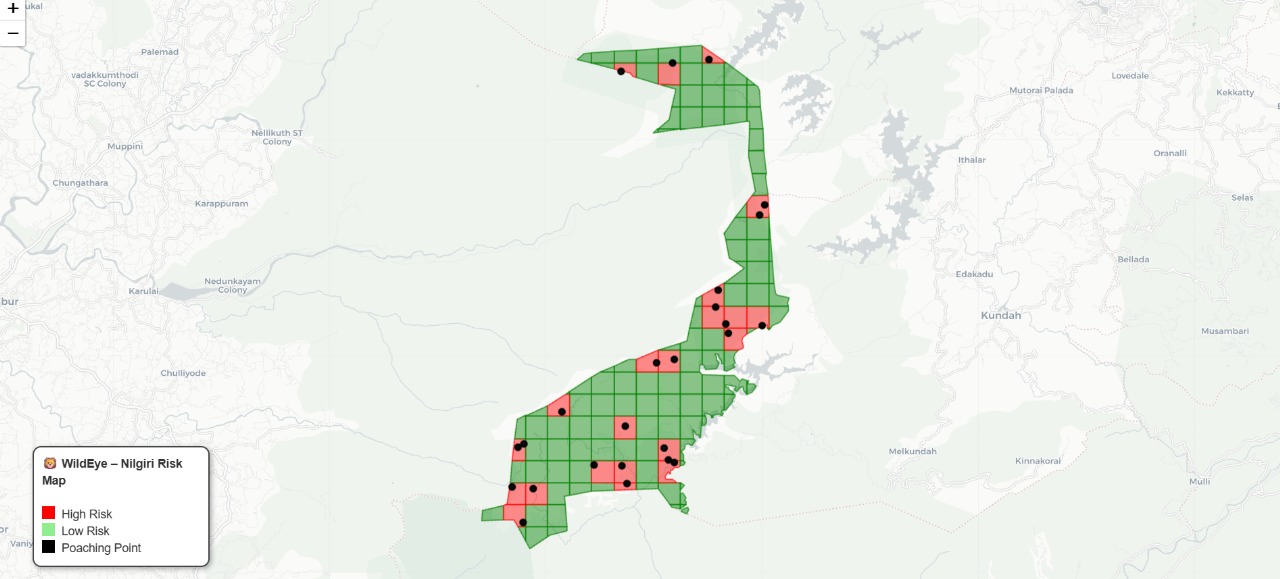
Output


Inspiration
Our inspiration came from identifying a critical inefficiency in wildlife conservation. Existing monitoring systems for protected forests are often "manual and inefficient" , lacking the "spatial intelligence" to predict where poaching is most likely to occur. This gap puts wildlife at risk, with "approximately 30,000 species... driven toward extinction every year due to poaching". We were inspired to build a highly useful and accessible web app that provides "an eye in the sky for boots on the ground", turning complex data into a simple, actionable tool for rangers.
What it does
WildEye is a GIS-powered predictive web app designed to be the "most useful" tool for forest officials. It "analyzes spatial, environmental, and human activity data" to "identify and visualize high-risk poaching zones" in protected areas like the Nilgiris. Its core function is an "interactive dashboard" that allows officials to: -Visualize high-risk poaching zones on a dynamic map. -See the proximity of forest zones to "human settlements and access routes". -Make "smarter patrolling decisions" based on predictive data, not just guesswork
How we built it
We built this web app on an entirely "open-source stack" , making it highly accessible and "Cost-effective" for any user.
    -Data Processing (Backend): We used Python with GeoPandas  for all spatial processing. We used OSMNX to automatically extract real-world road and village data from OpenStreetMap. This data was combined with boundaries from the World Database on Protected Areas (WDPA) and TamilNadu Forest Cover data.

     -Web App (Frontend): The interactive dashboard is built using Folium , which is a Python wrapper for the Leaflet.js  mapping library. This allowed us to quickly generate a useful and lightweight HTML web app that renders the final risk zones from a GeoJSON  database.
Challenges we ran into
Our main challenge was integrating "multiple spatial datasets" of different types. We had to figure out how to merge polygon data from shapefiles , line/point data from OpenStreetMap , and statistical data from a CSV into a single, coherent model. The next major hurdle was developing the "grid-based simulation" to accurately compute poaching vulnerability based on proximity to roads and villages.
Accomplishments that we're proud of
  -We are most proud of building a web app that is not just a concept but is "operationally feasible". We successfully created an end-to-end system that "Automates GIS Mapping" and provides "Interactive Visualization".

  -Our biggest accomplishment is that the final web app is "Cost-effective" because it "relies on open-source software and publicly available data". This makes it a truly useful and deployable tool for any conservation agency, regardless of budget.
What we learned
-Through this project, we learned how to build a full-stack, data-driven web application from start to finish. We gained practical experience in using GeoPandas for complex spatial analysis, OSMNX for real-world data extraction, and Folium/Leaflet.js to build an intuitive and interactive user dashboard. Most importantly, we learned how to "apply ML and spatial analysis" to a critical real-world problem.
What's next for Wildeye
-This web app was designed for "Scalability". Our immediate next step is to enhance the interactive dashboard with more features, such as real-time data feeds. After that, we plan to "be easily expanded to cover other forest regions across India", scaling its utility from a regional app to a nationwide tool for wildlife protection.
Built With
- folium
- geopandas
- leaflet.js
- matplotlib
- openstreetmap
- osmnx
- python
- wdpa

Log in or sign up for Devpost to join the conversation.