-
-
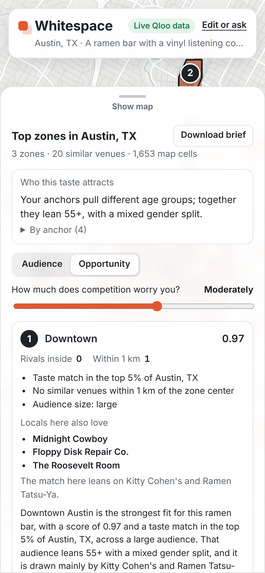
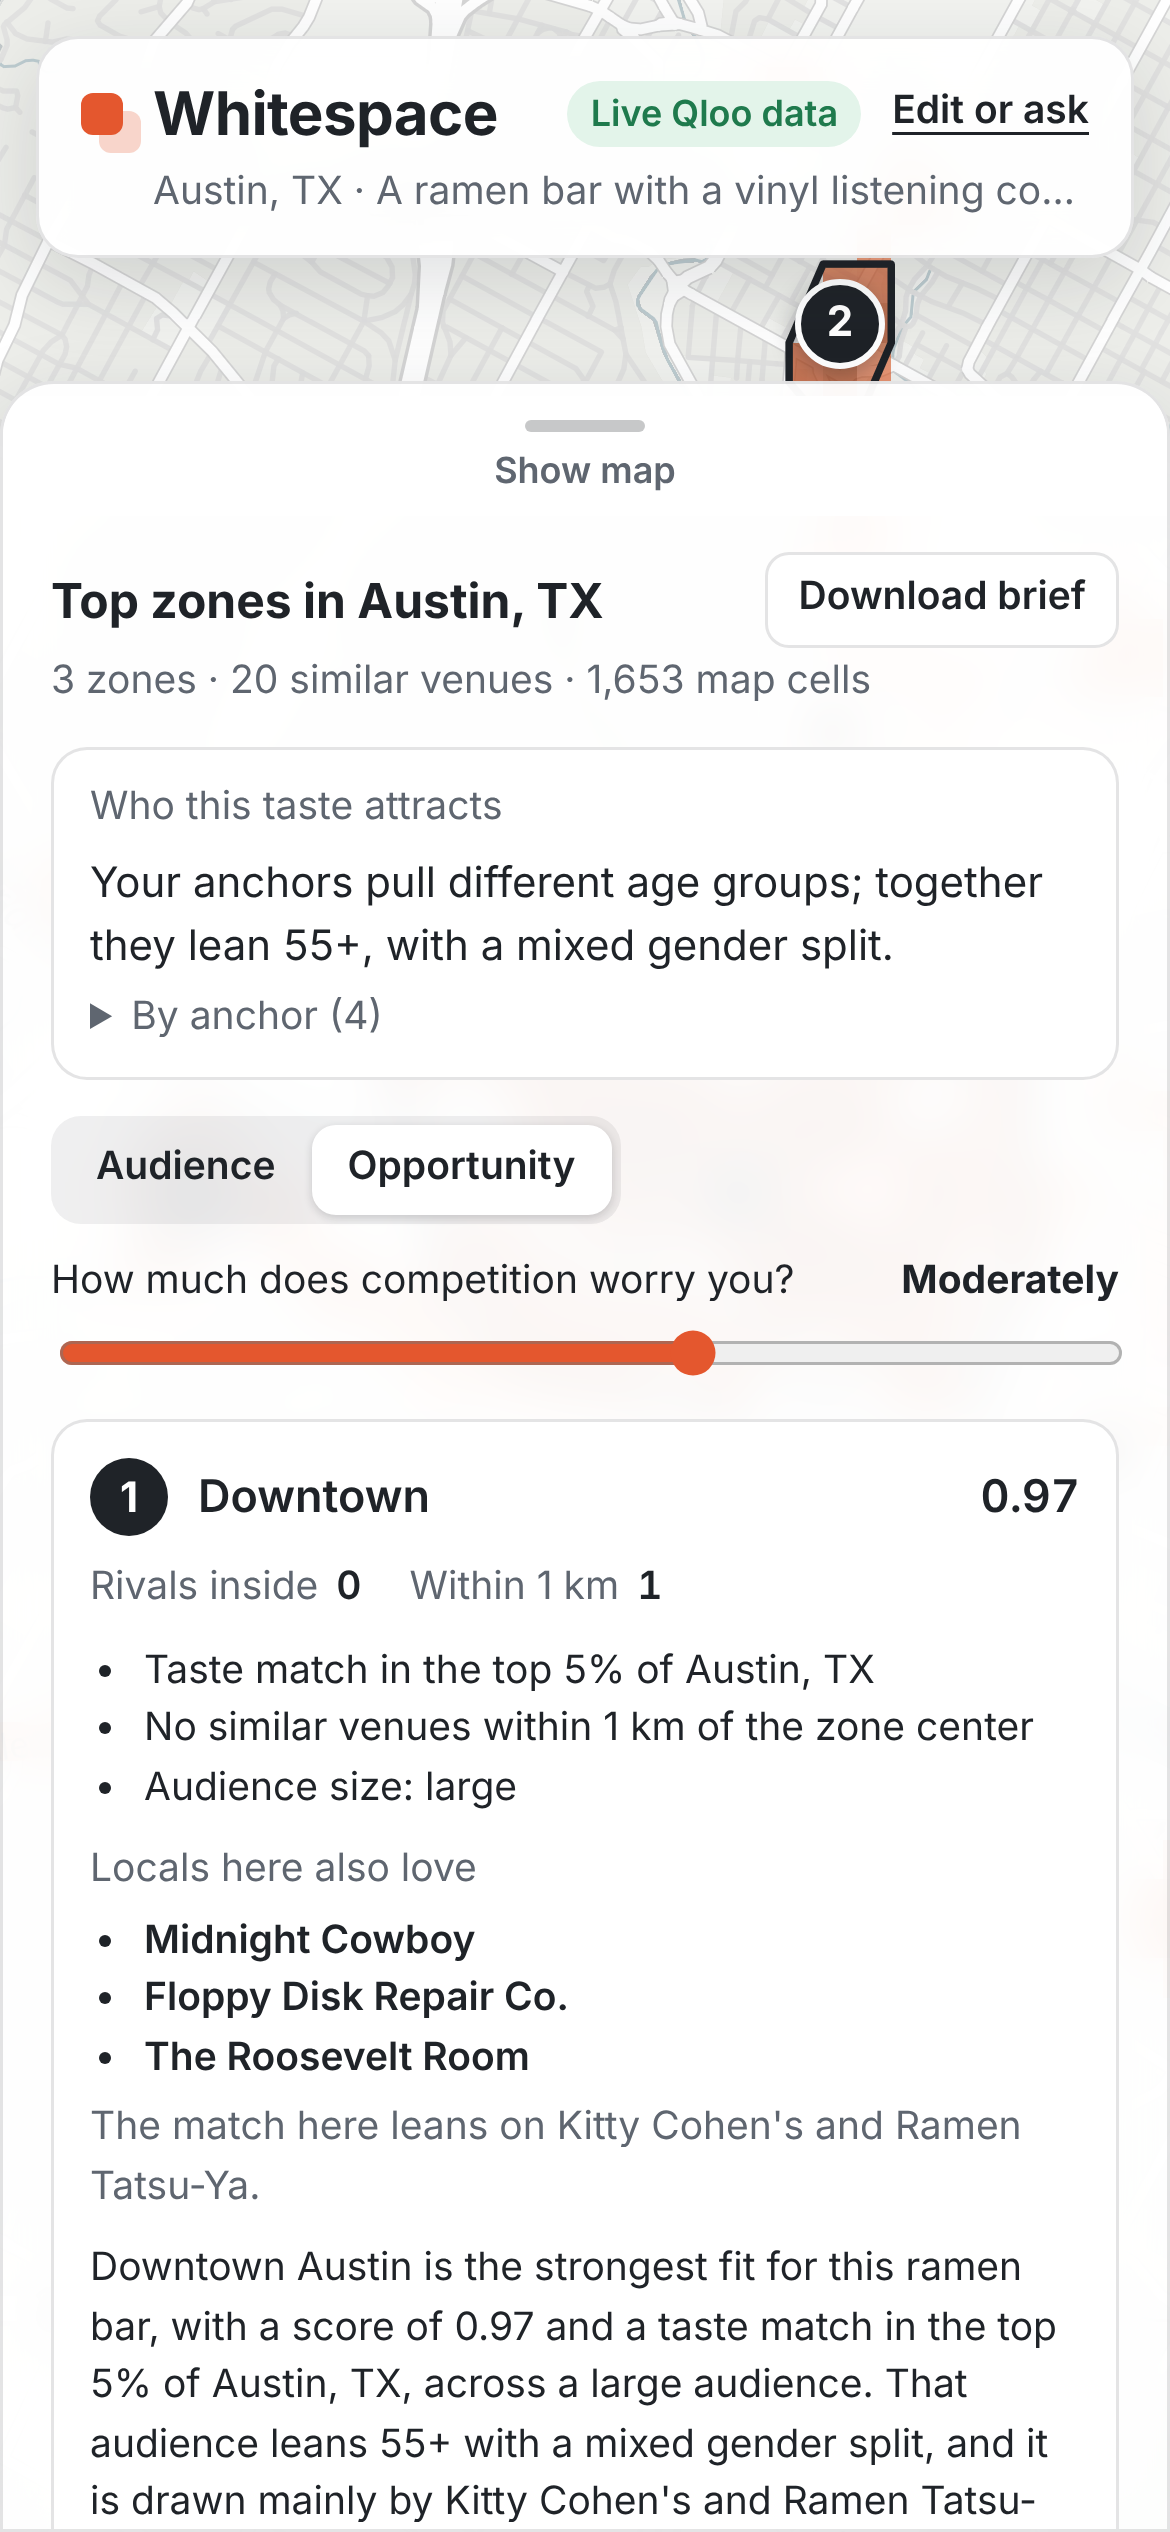
Mobile: zones in a bottom sheet with the audience portrait, a competition slider and Downtown Austin as zone 1.
-
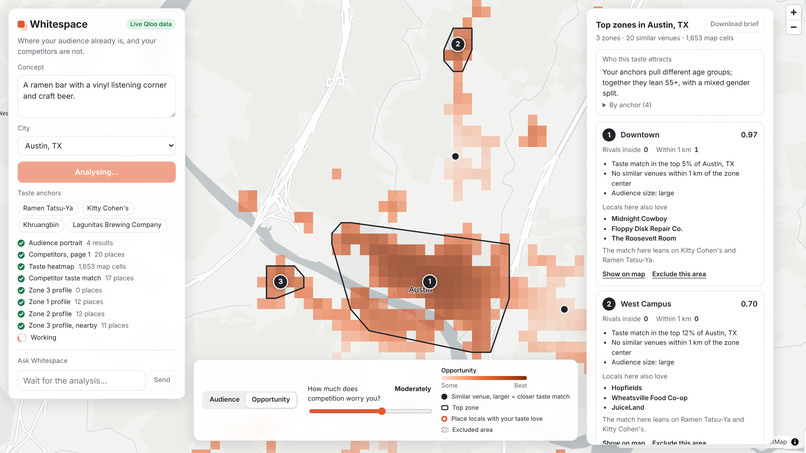
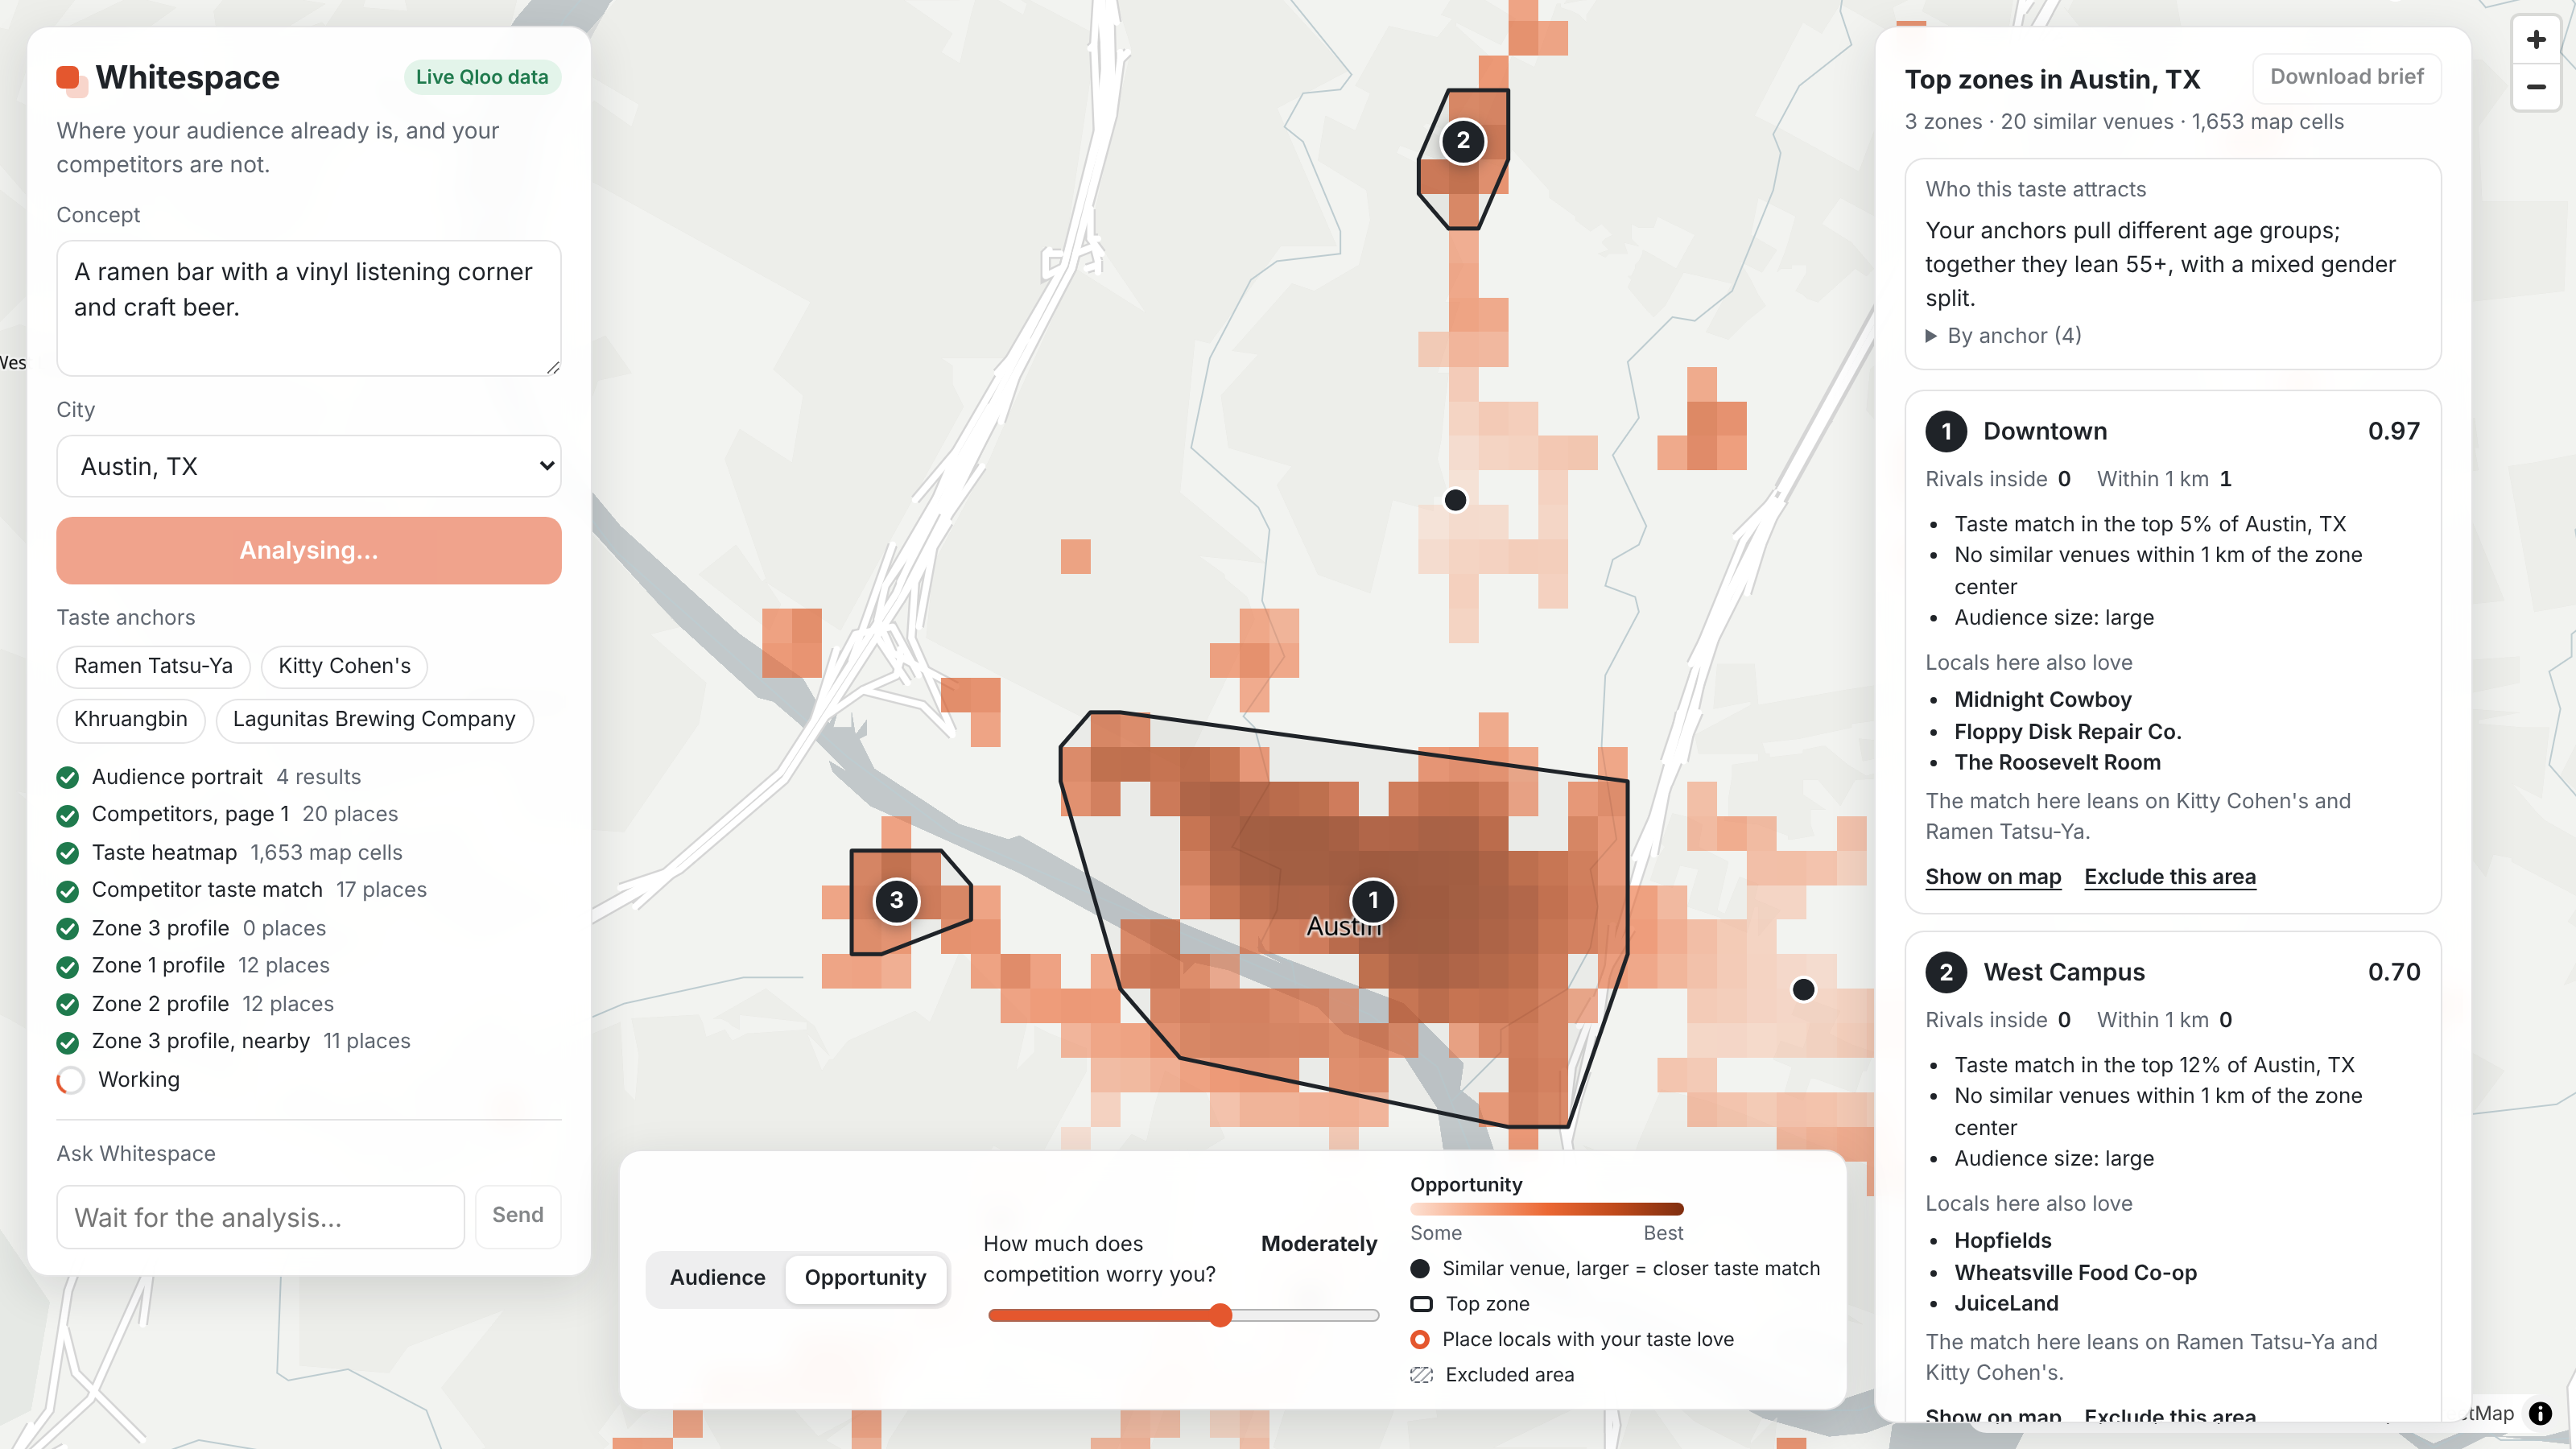
Results stream in live: audience portrait, competitors, heatmap, competitor taste match and zone profiles appear step by step.
-
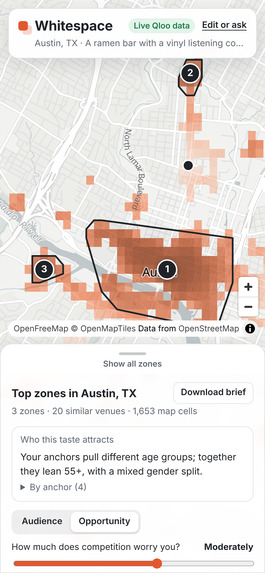
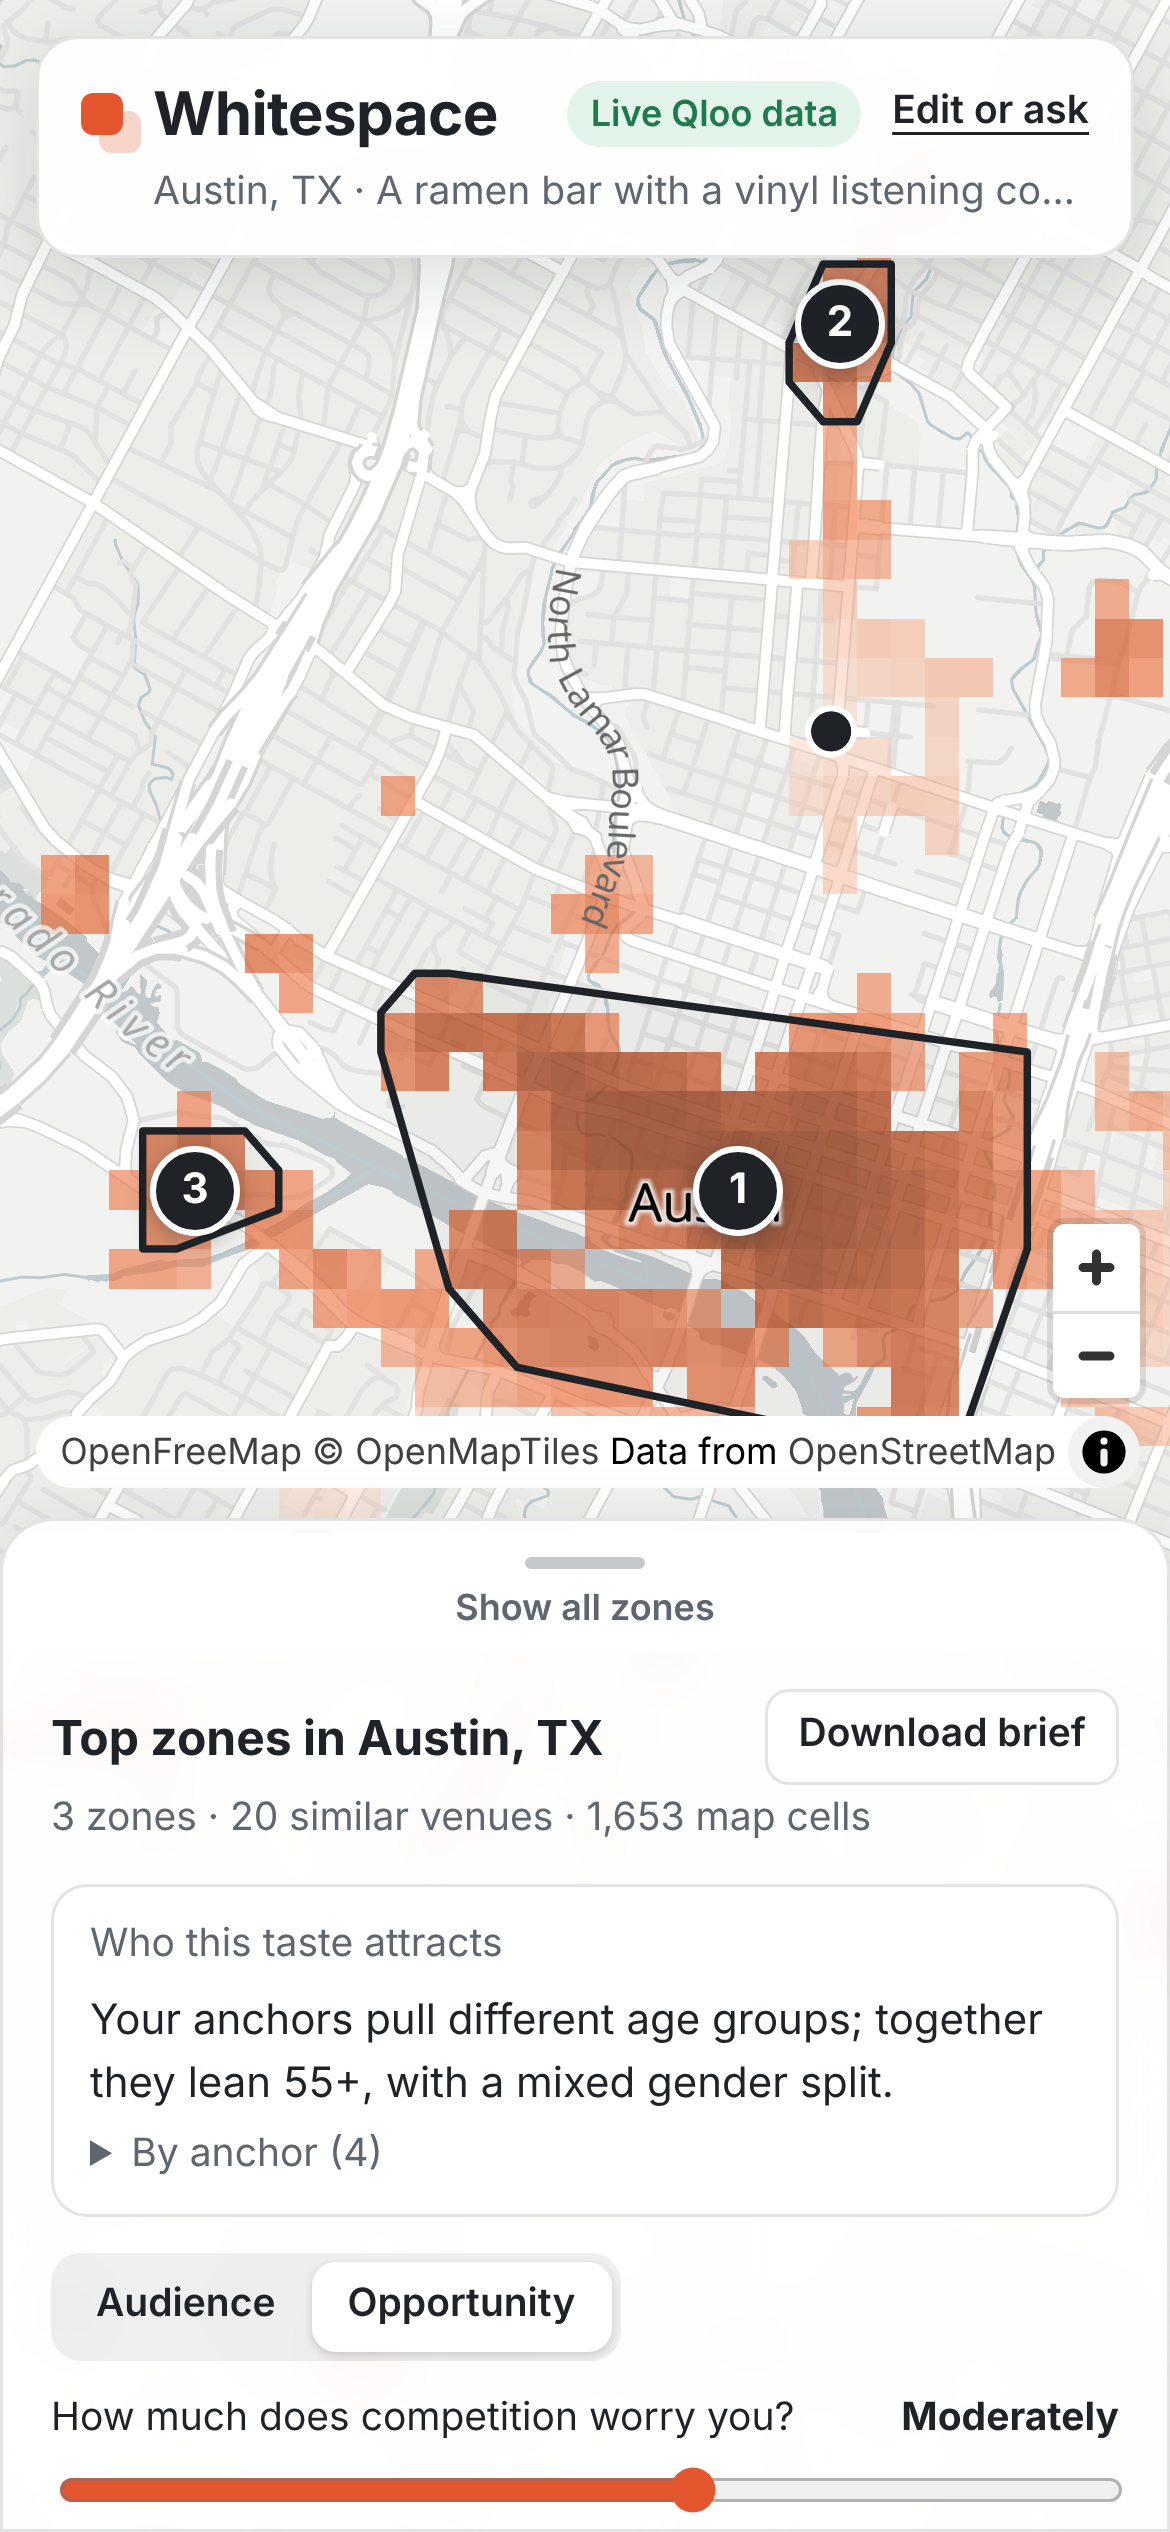
Mobile: map of the top 3 zones above the zone list, with the 'Download brief' export one tap away.
-
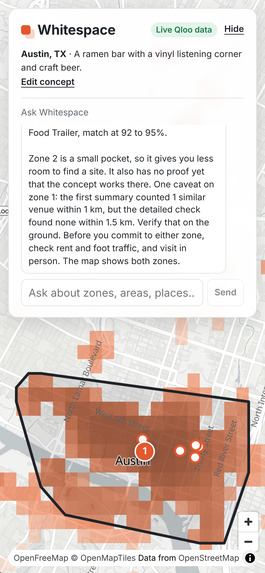
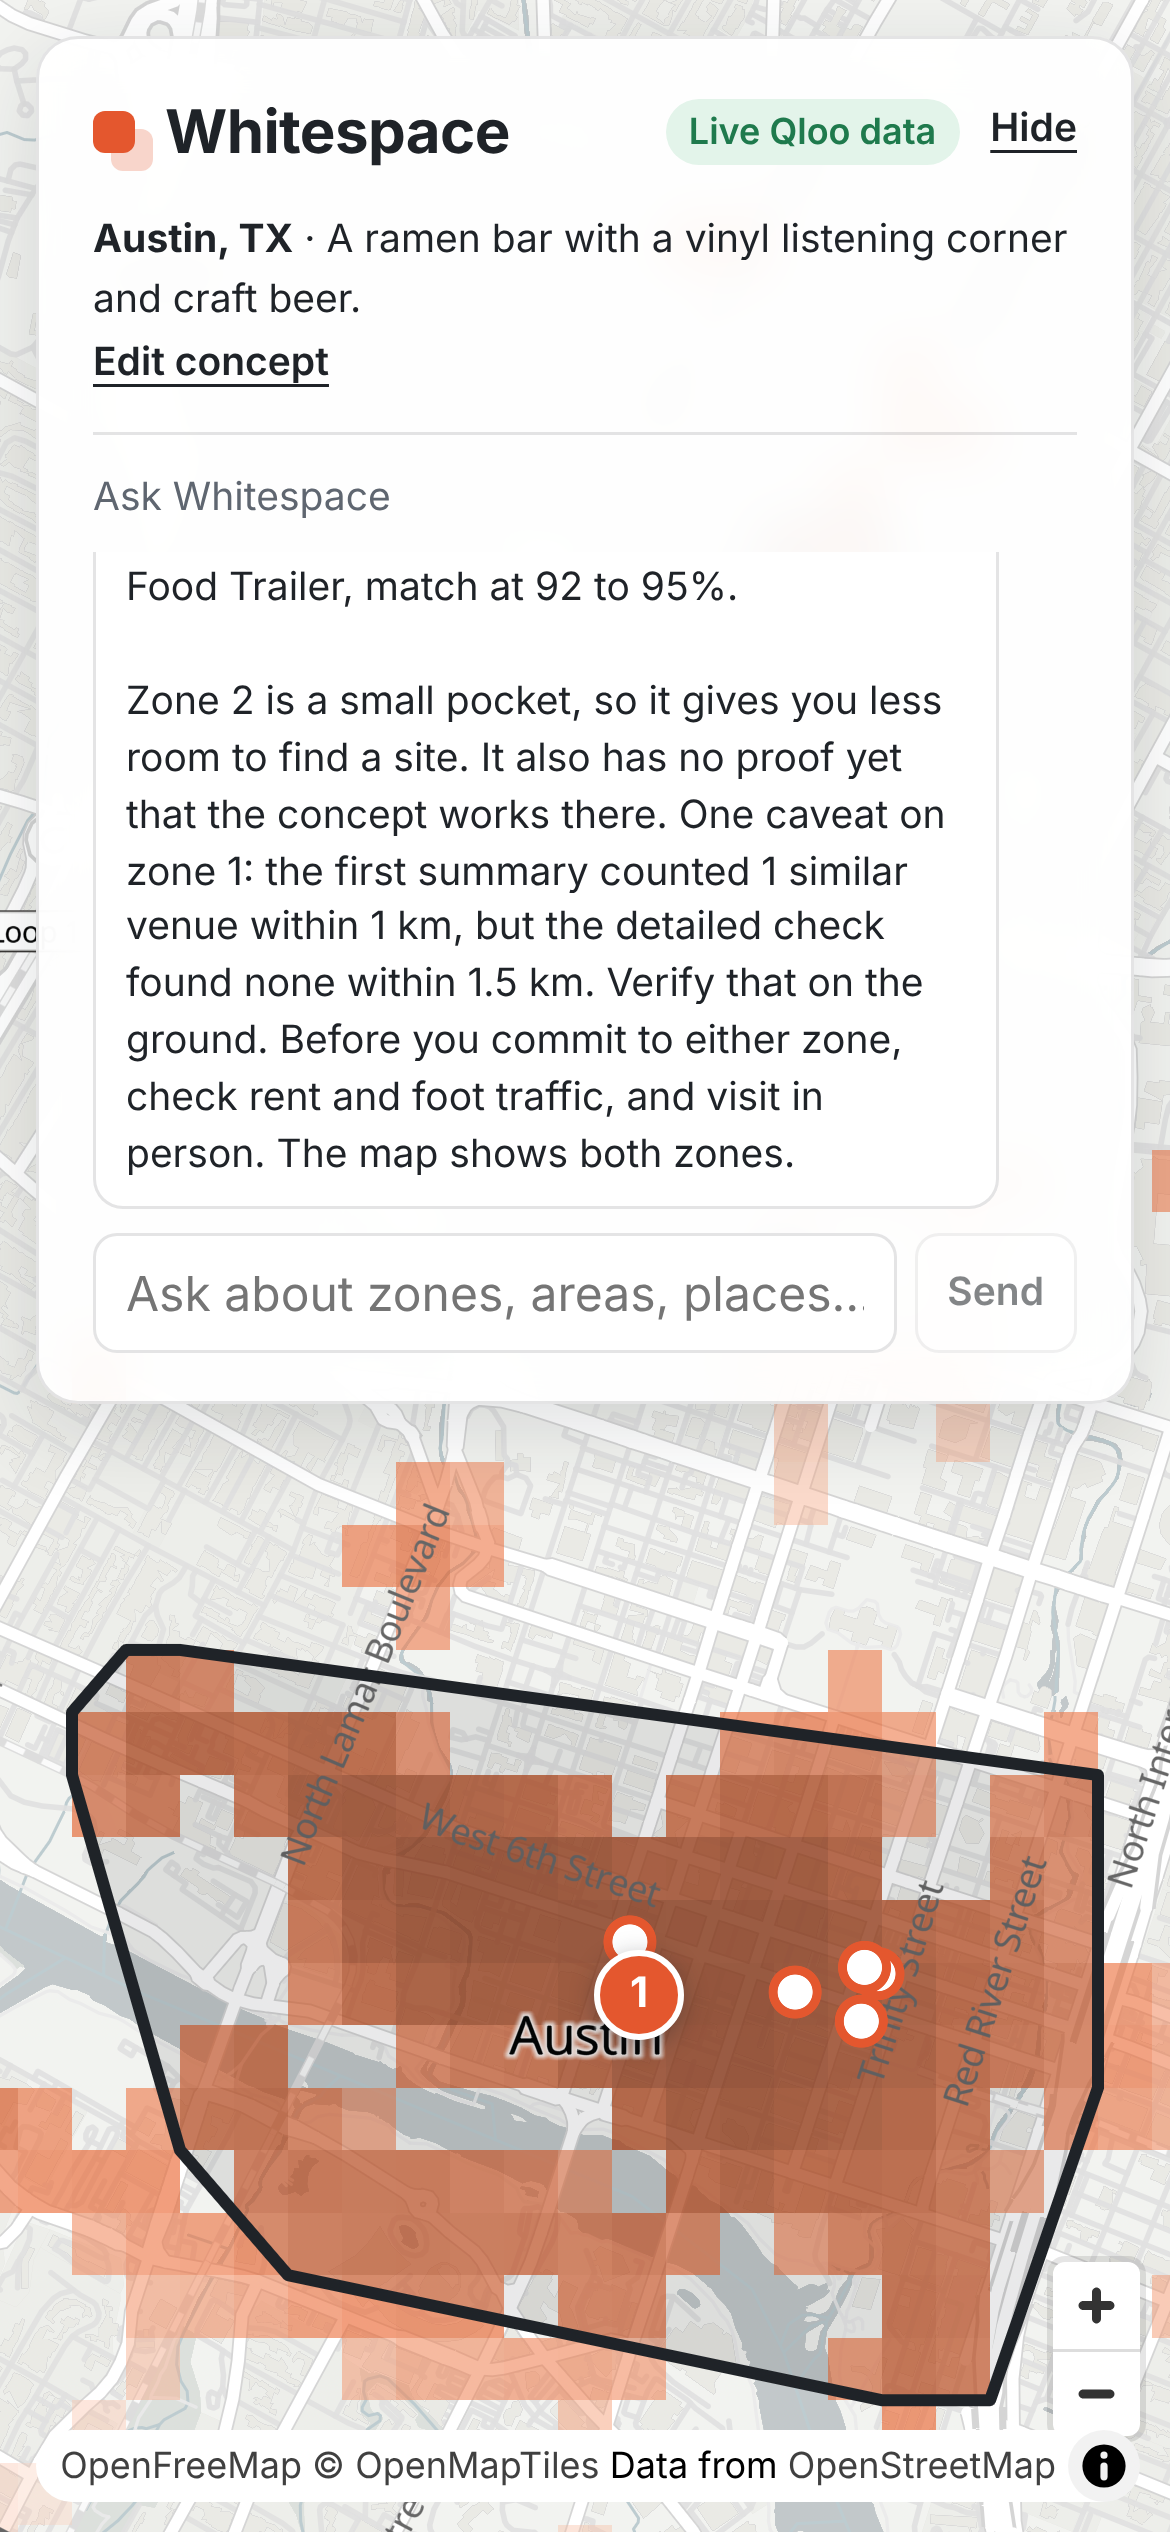
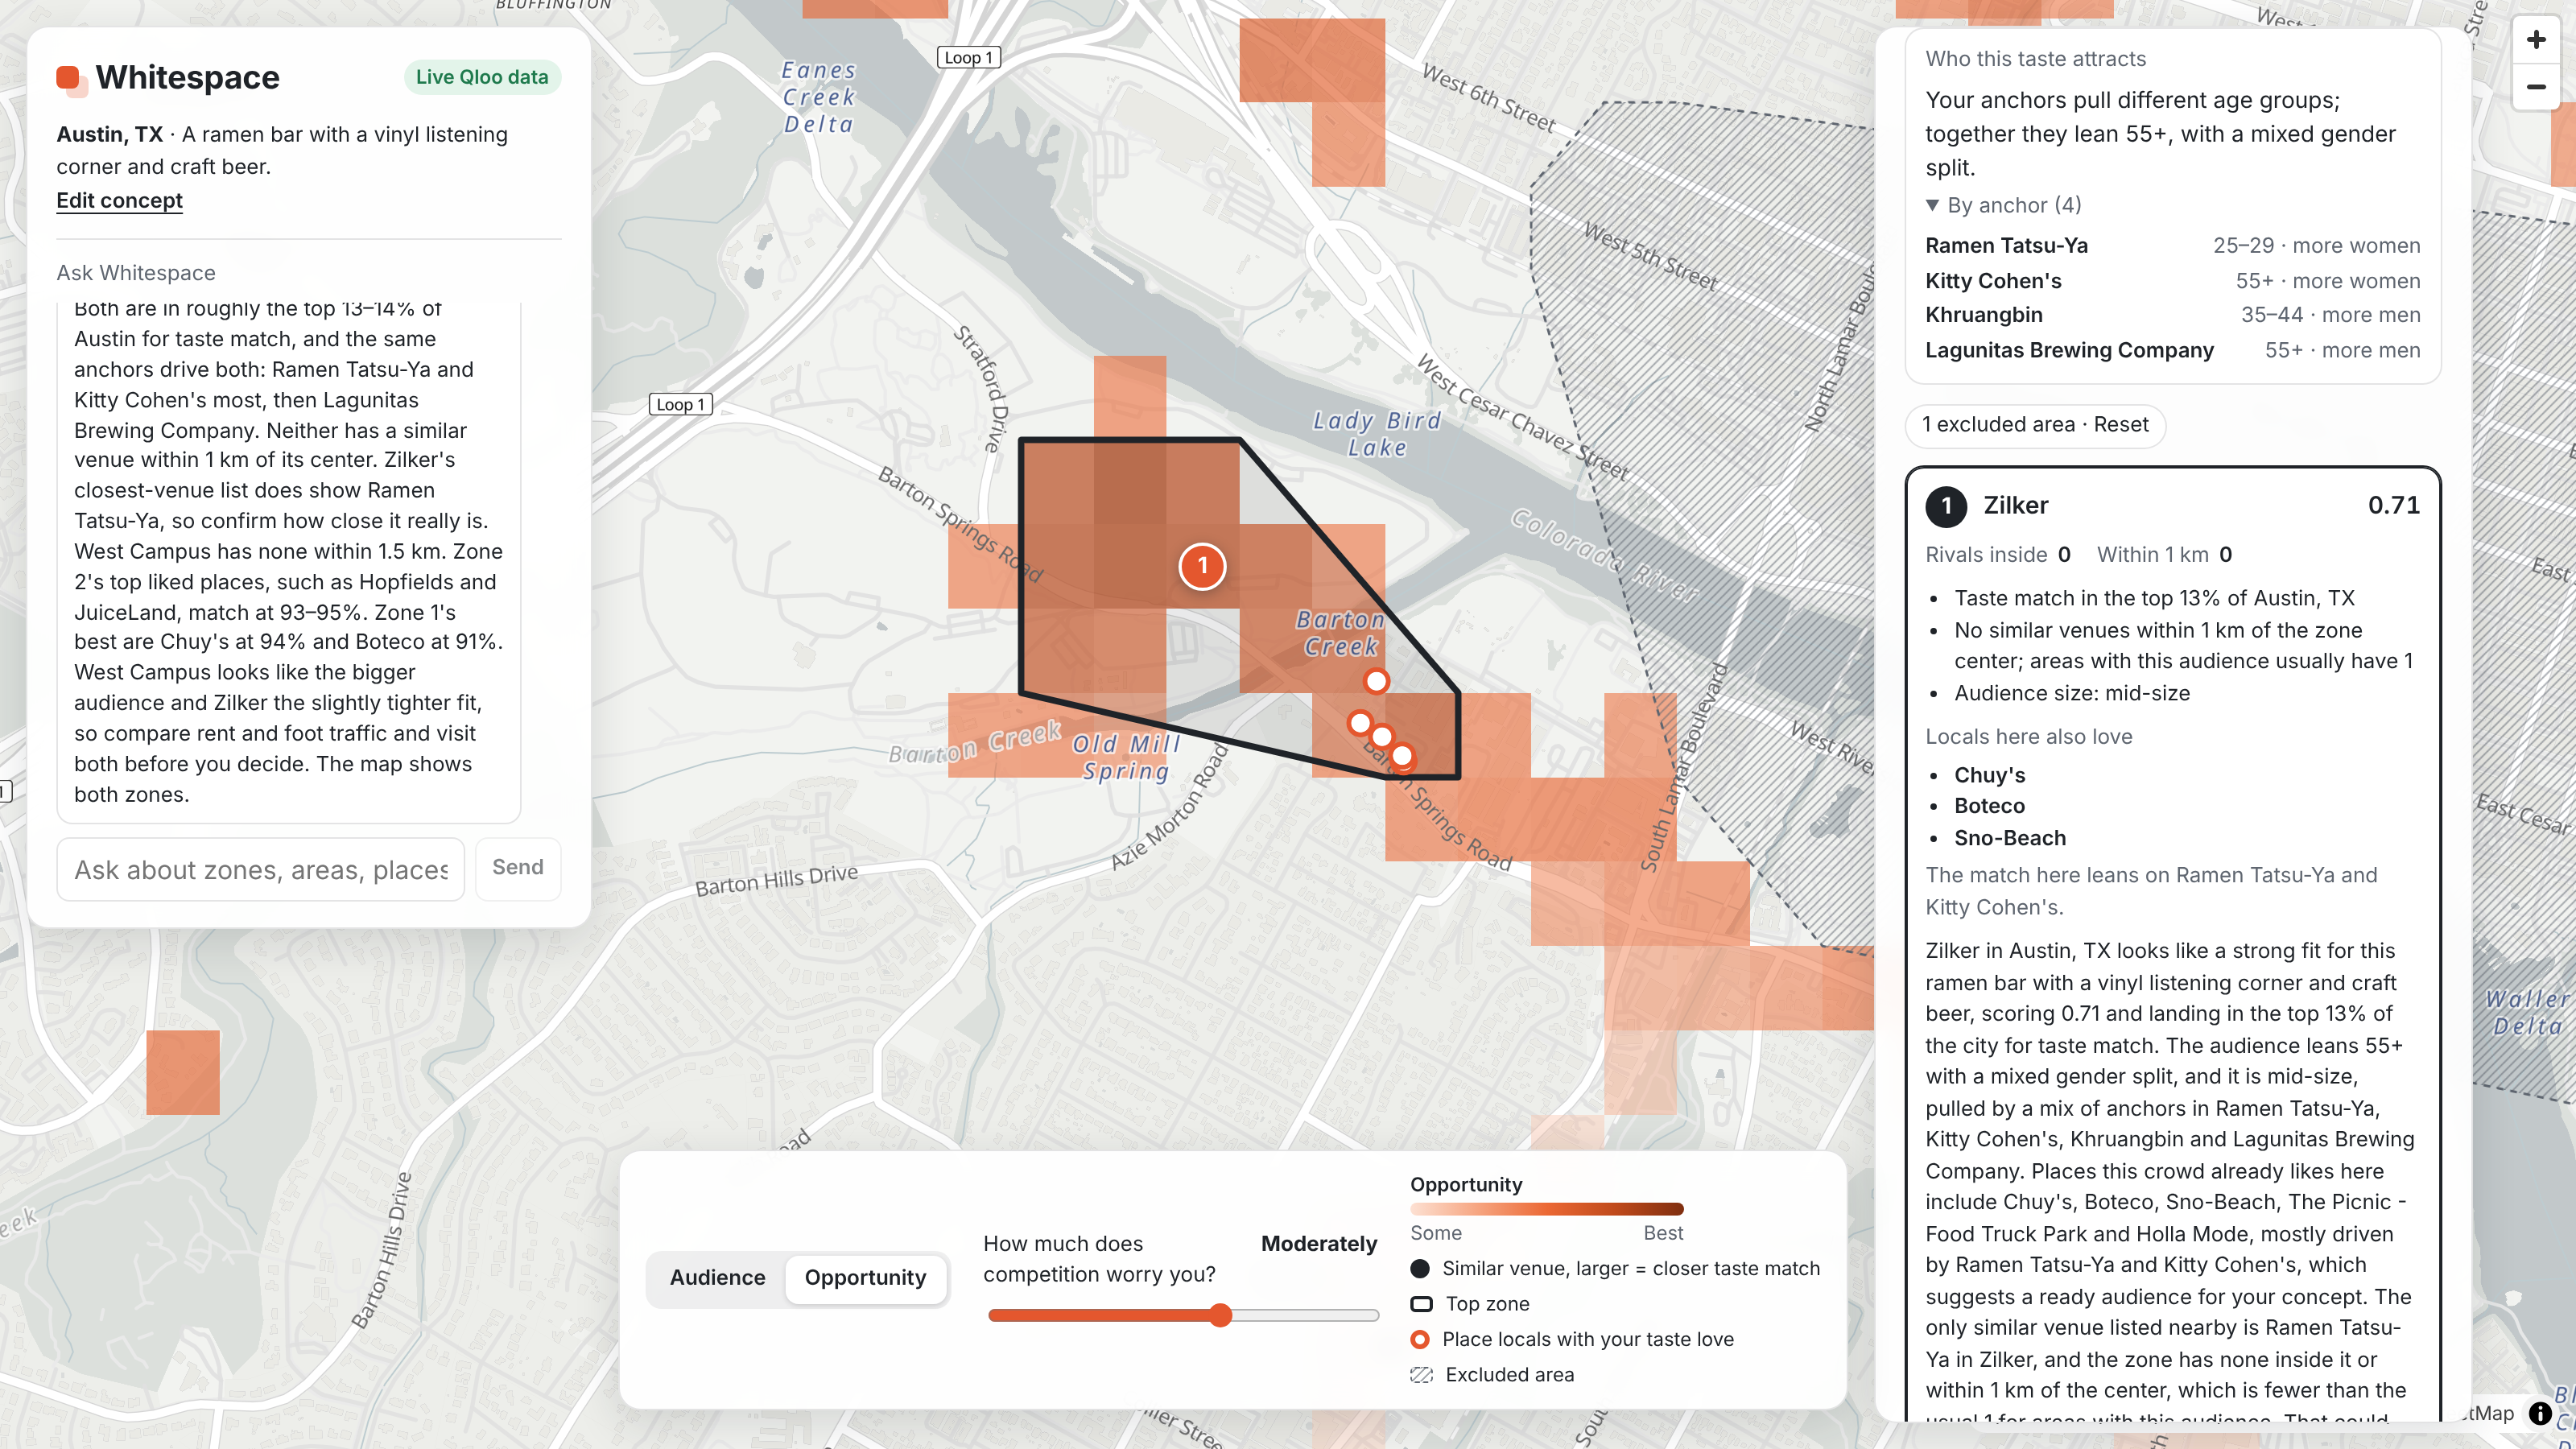
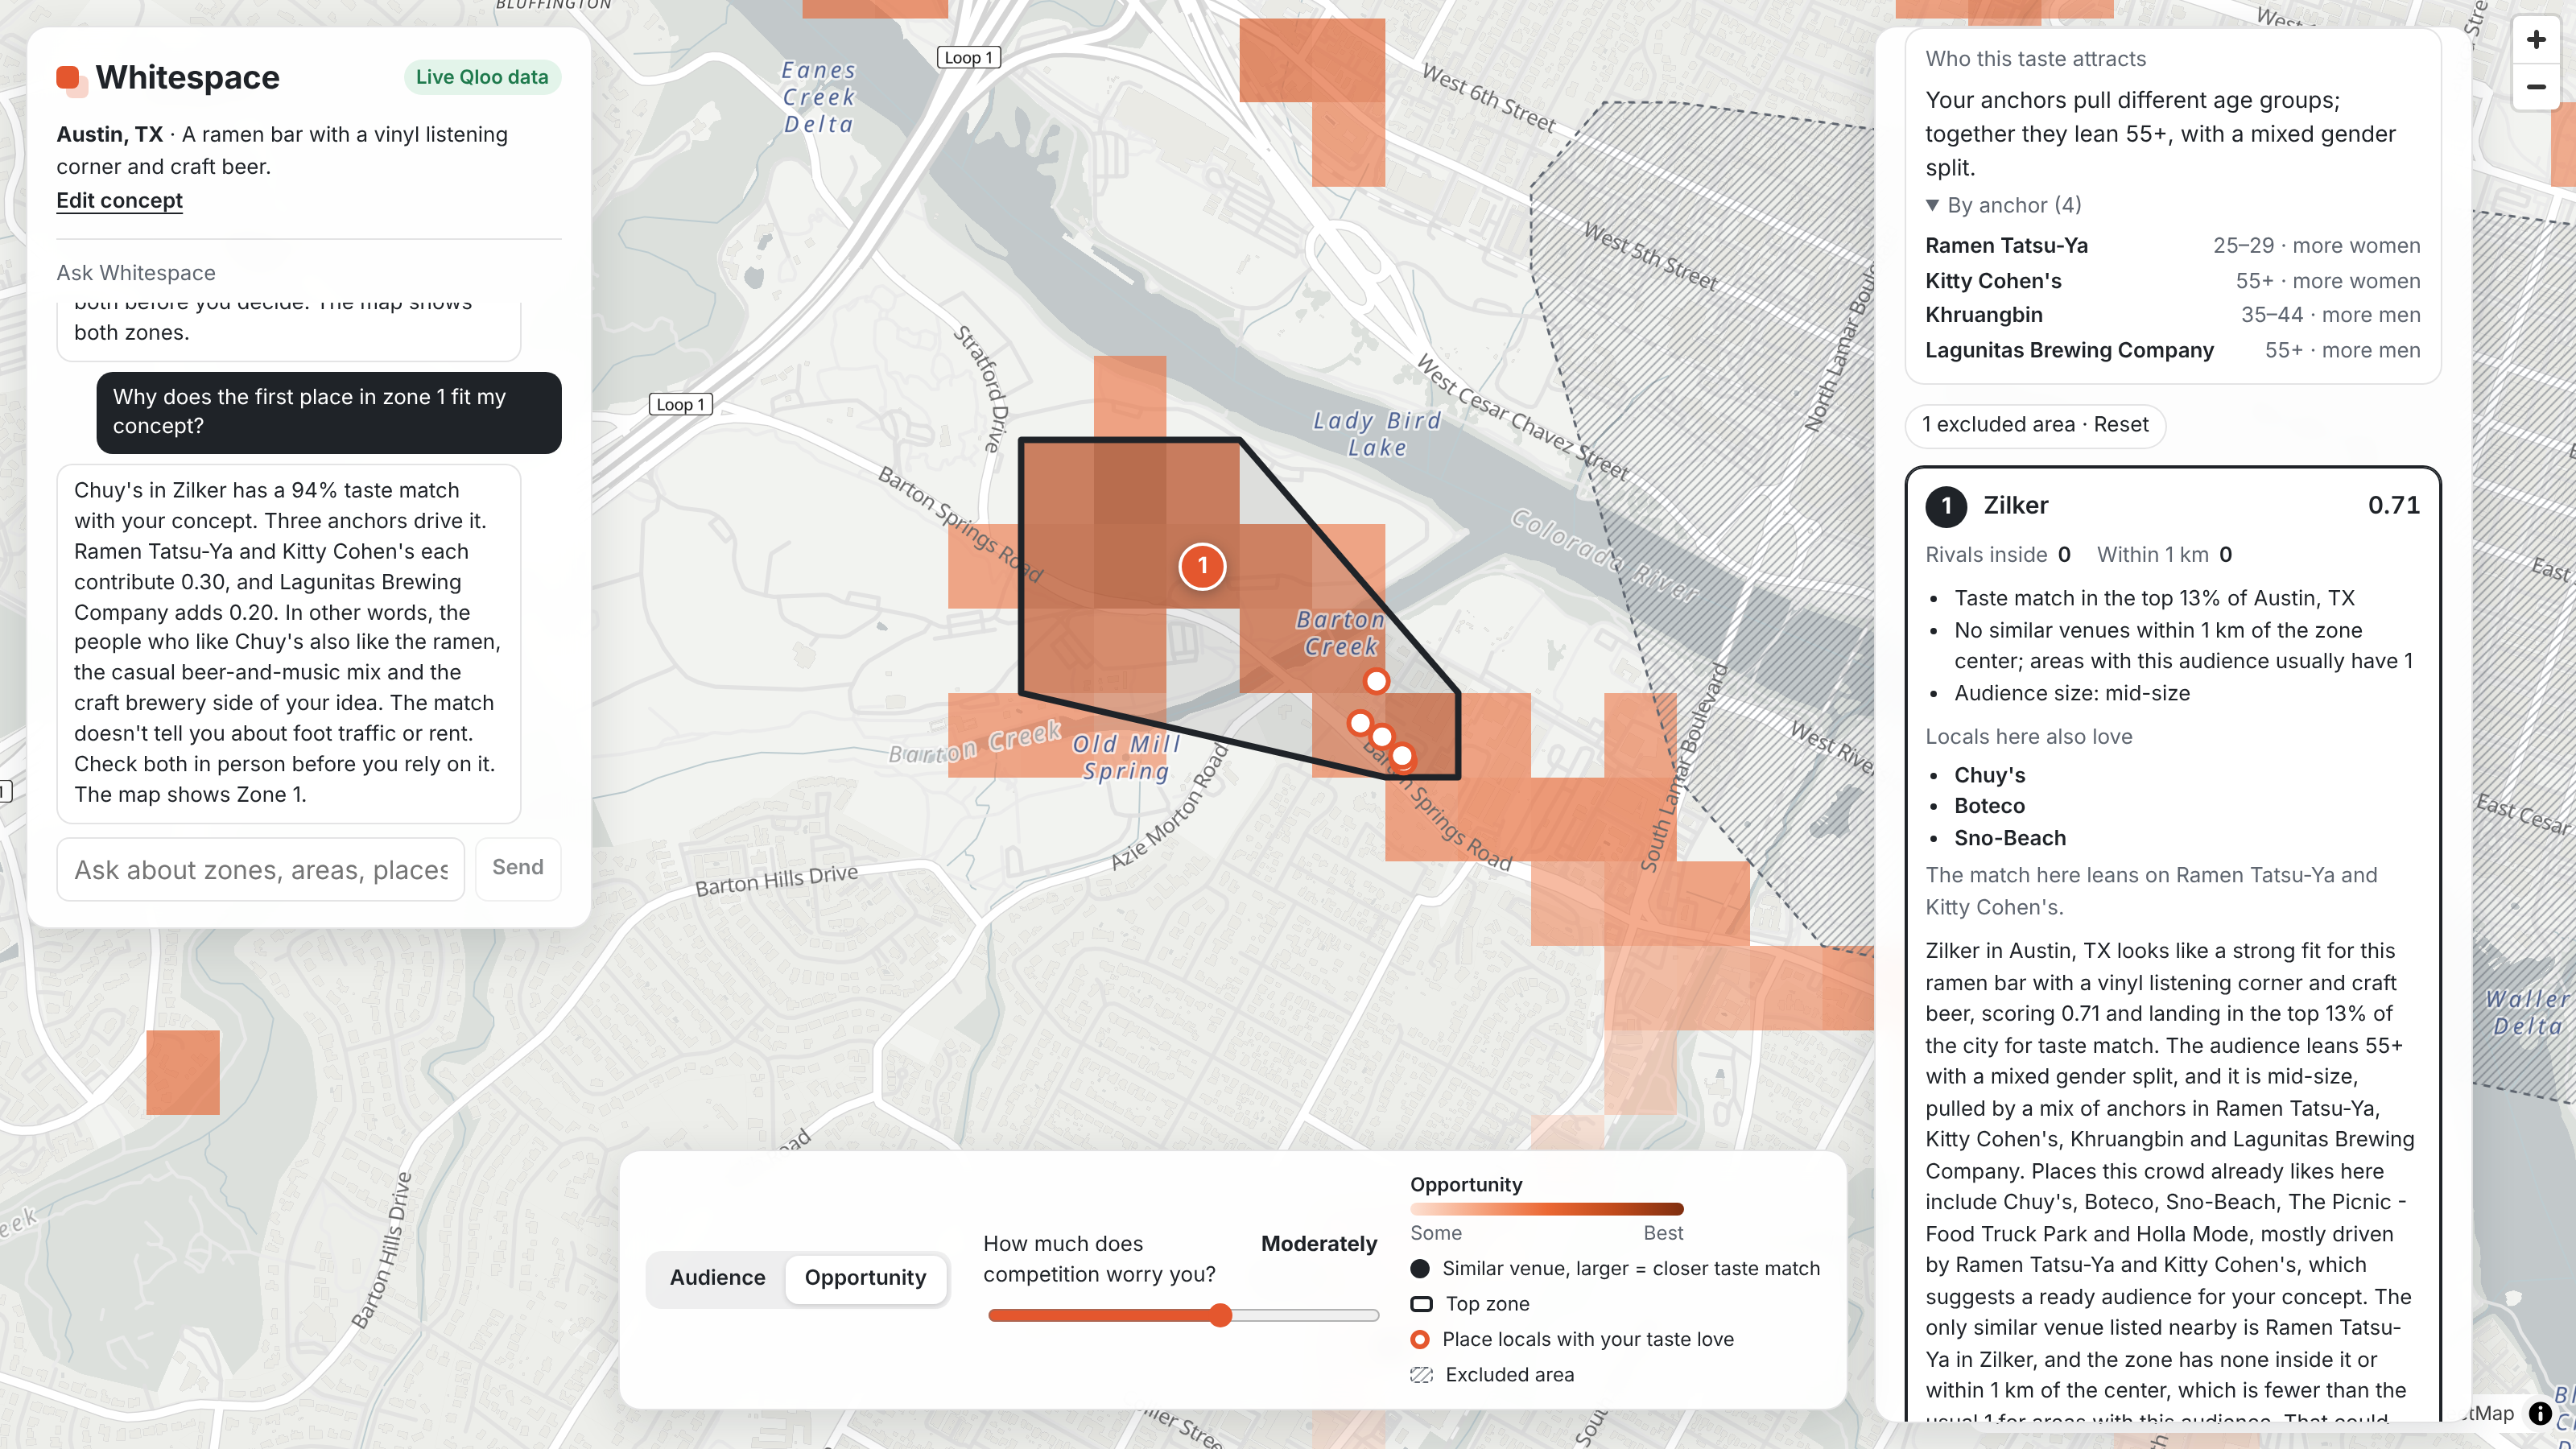
Mobile view: chat with the agent. It compares zones using Qloo data and reminds you to verify rent and foot traffic in person.
-
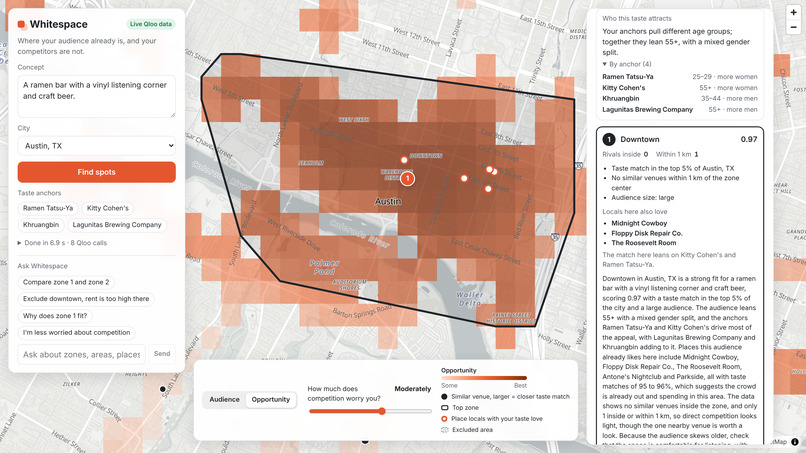
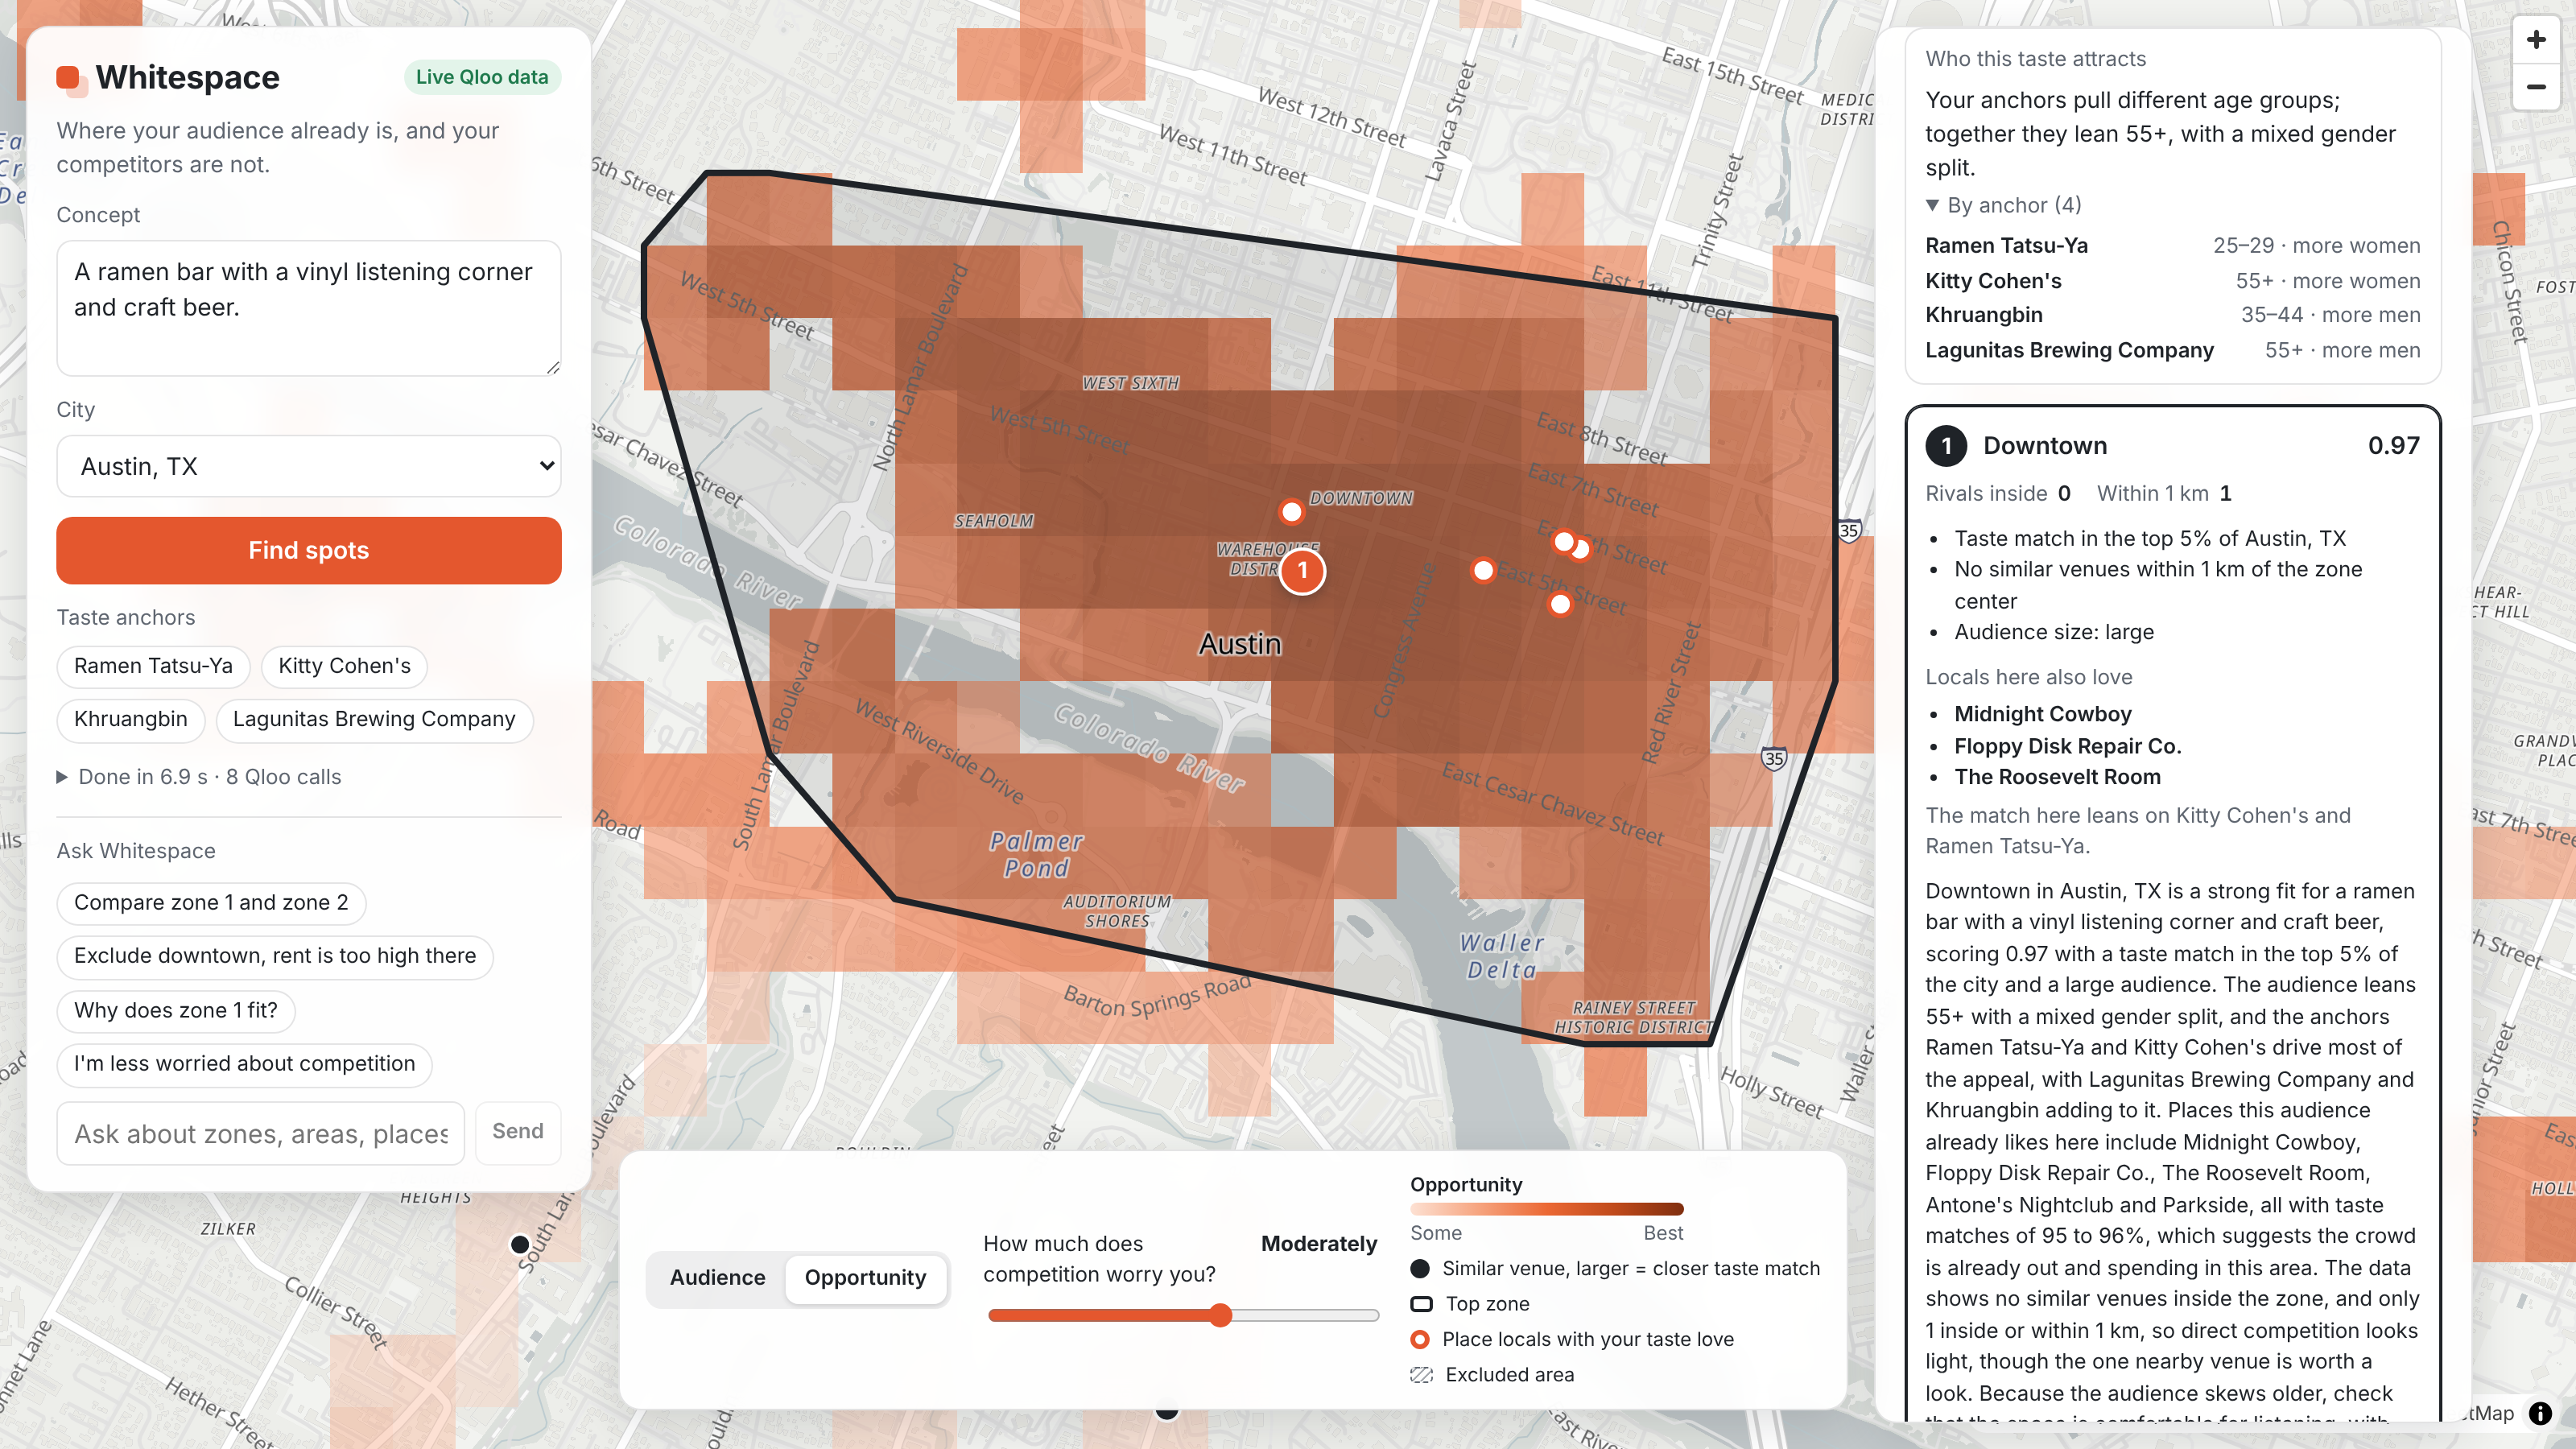
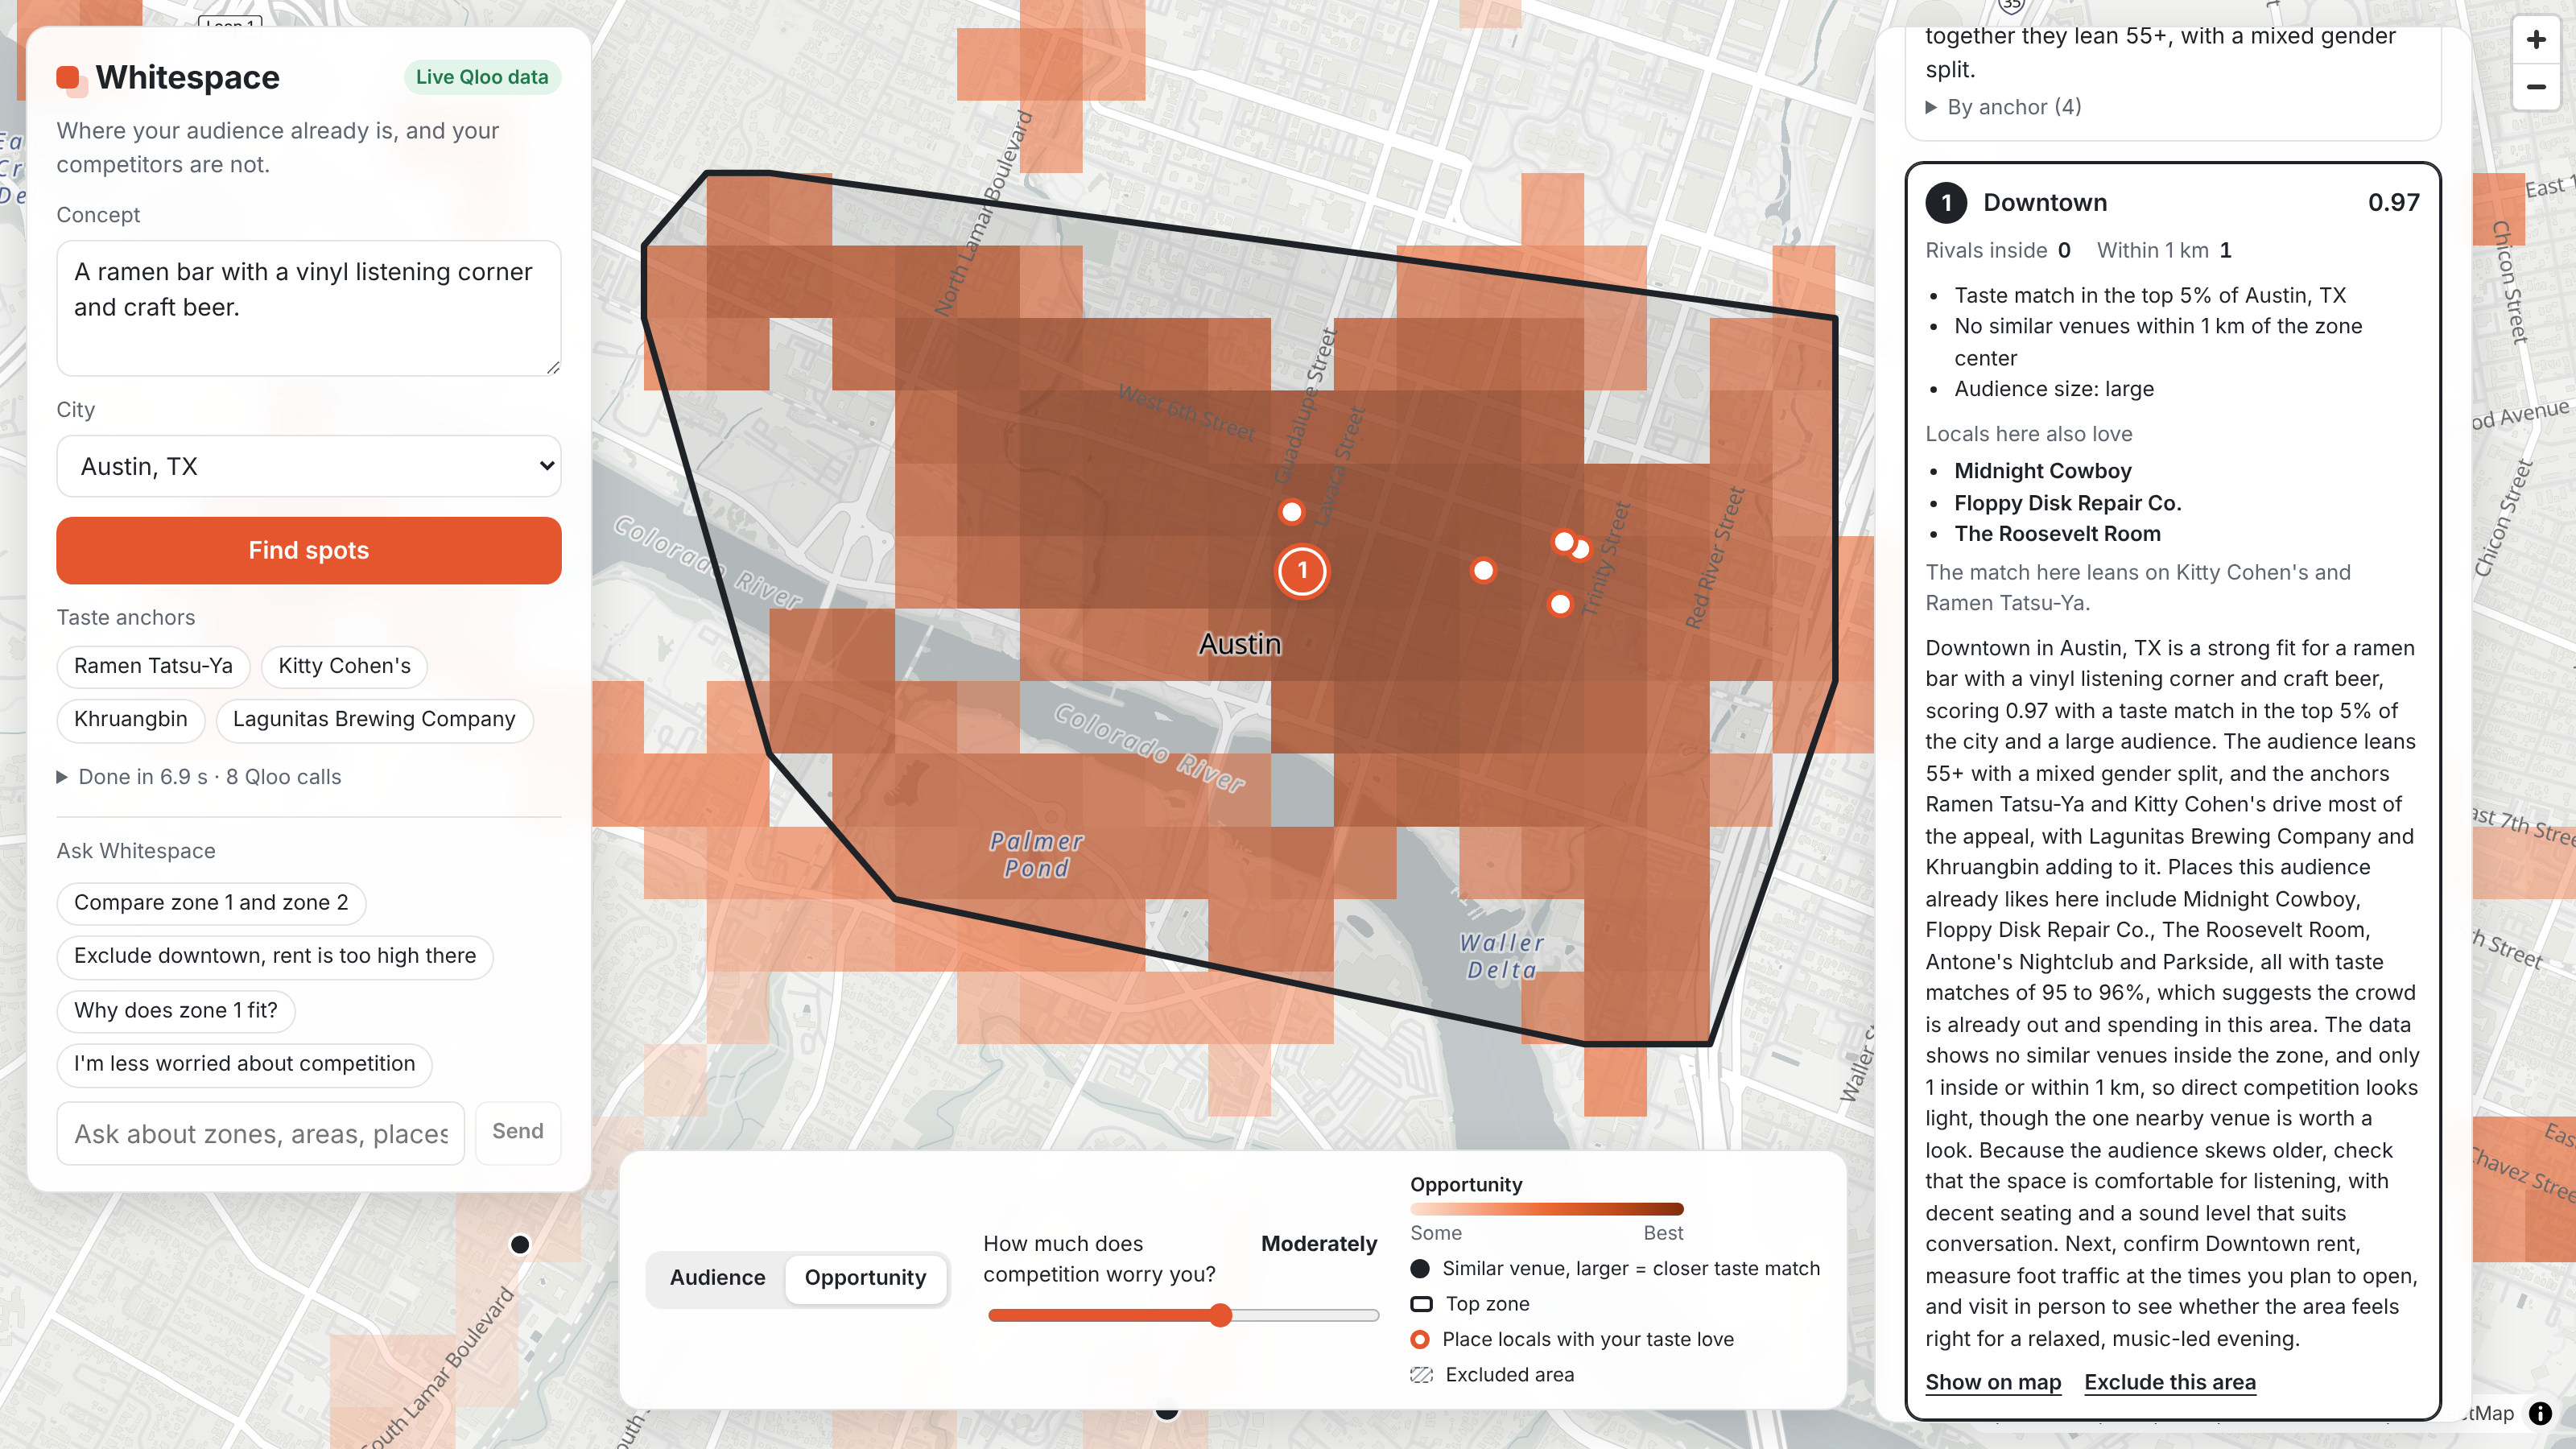
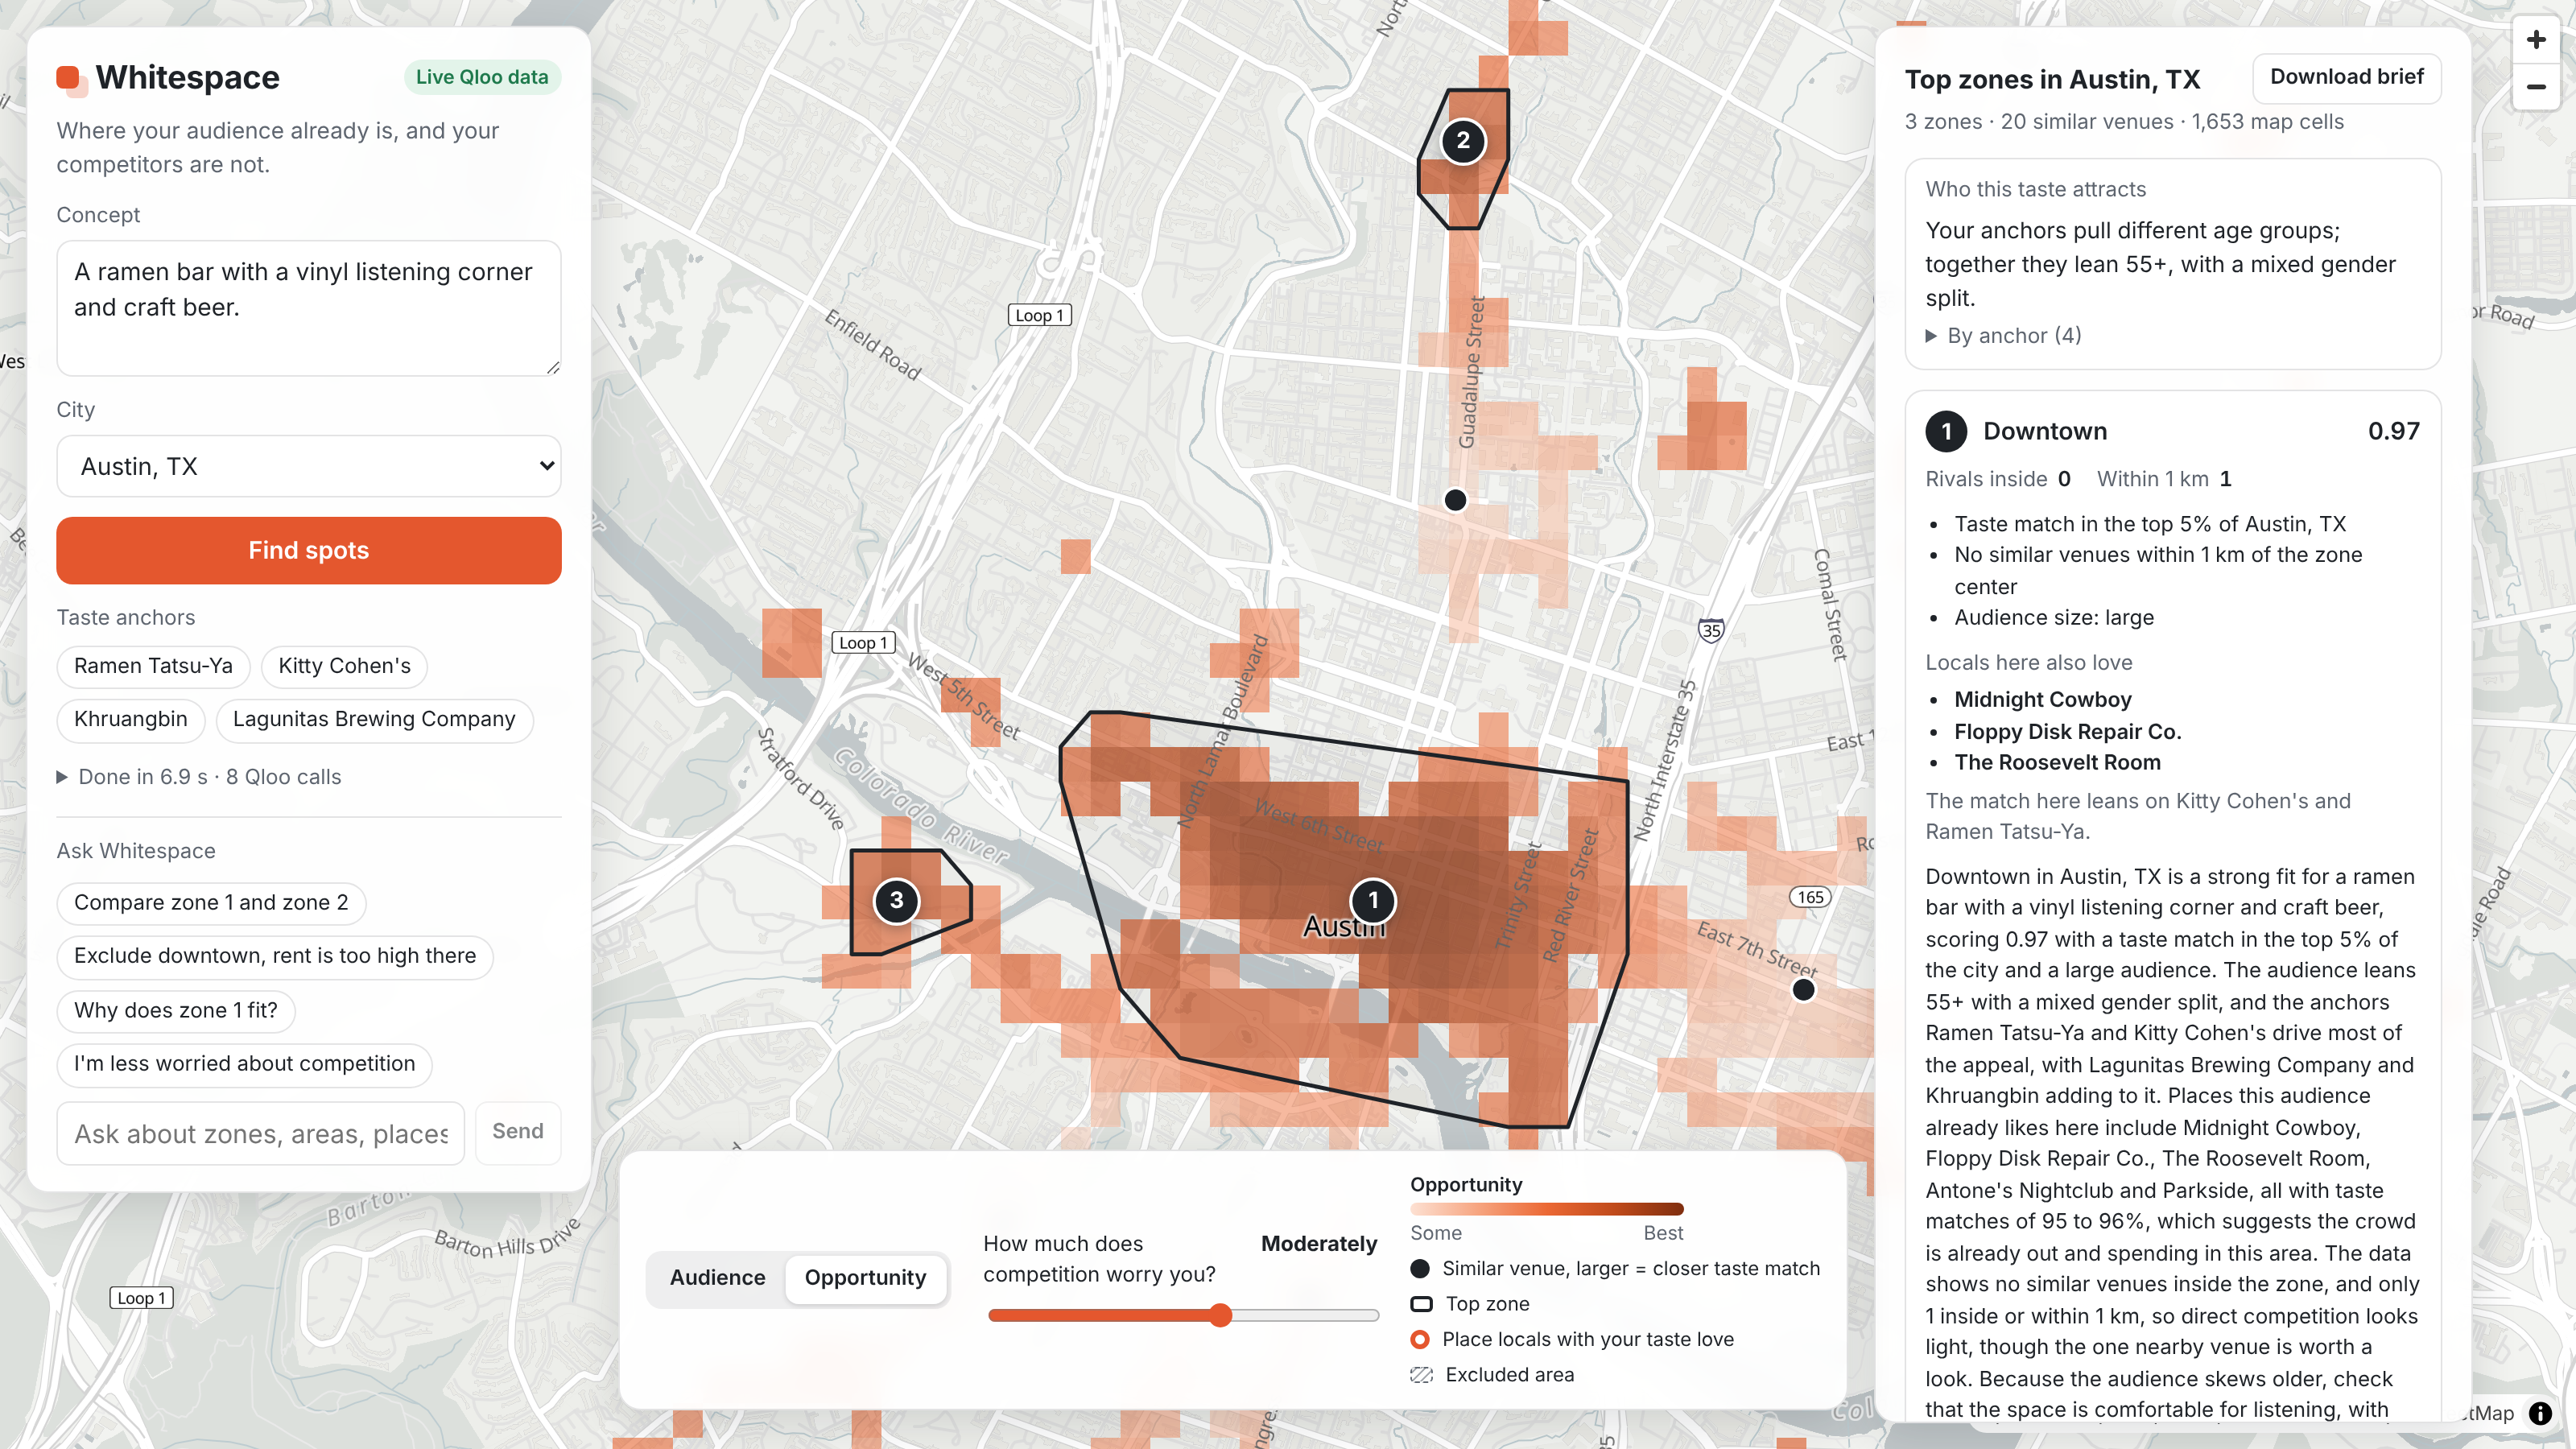
Zone 1, Downtown Austin: 0.97 score, top 5% taste match, no rivals inside. Locals also love Midnight Cowboy and Floppy Disk Repair Co.
-
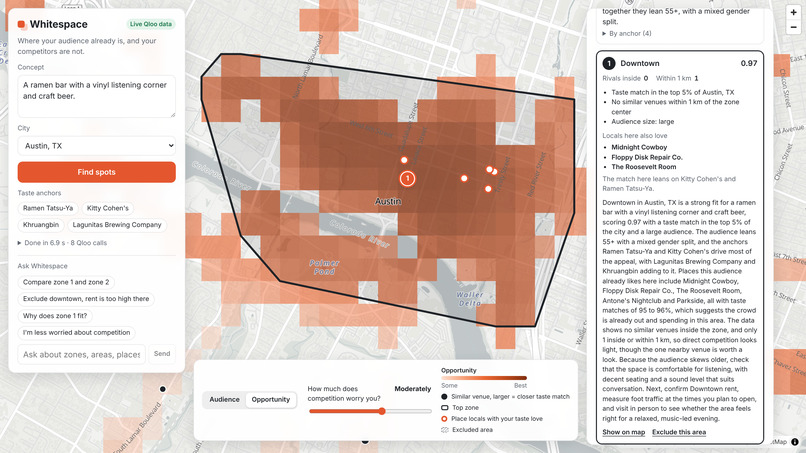
Each zone card ends with a grounded brief: why here, who the audience is, nearby rivals and what to check next (rent, traffic, a visit).
-
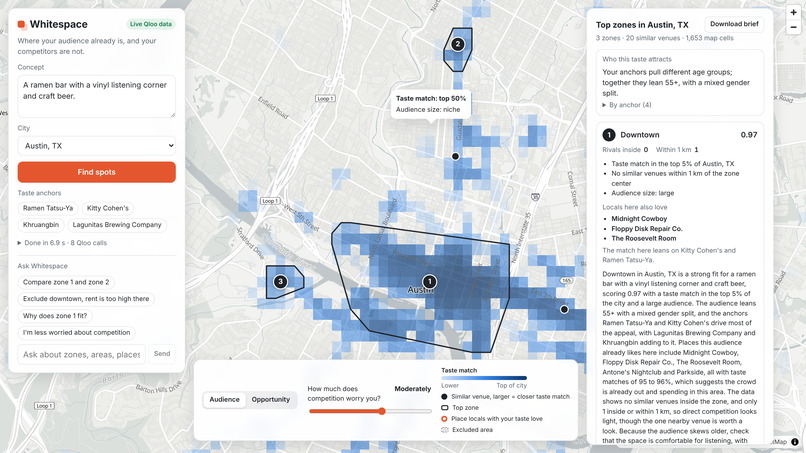
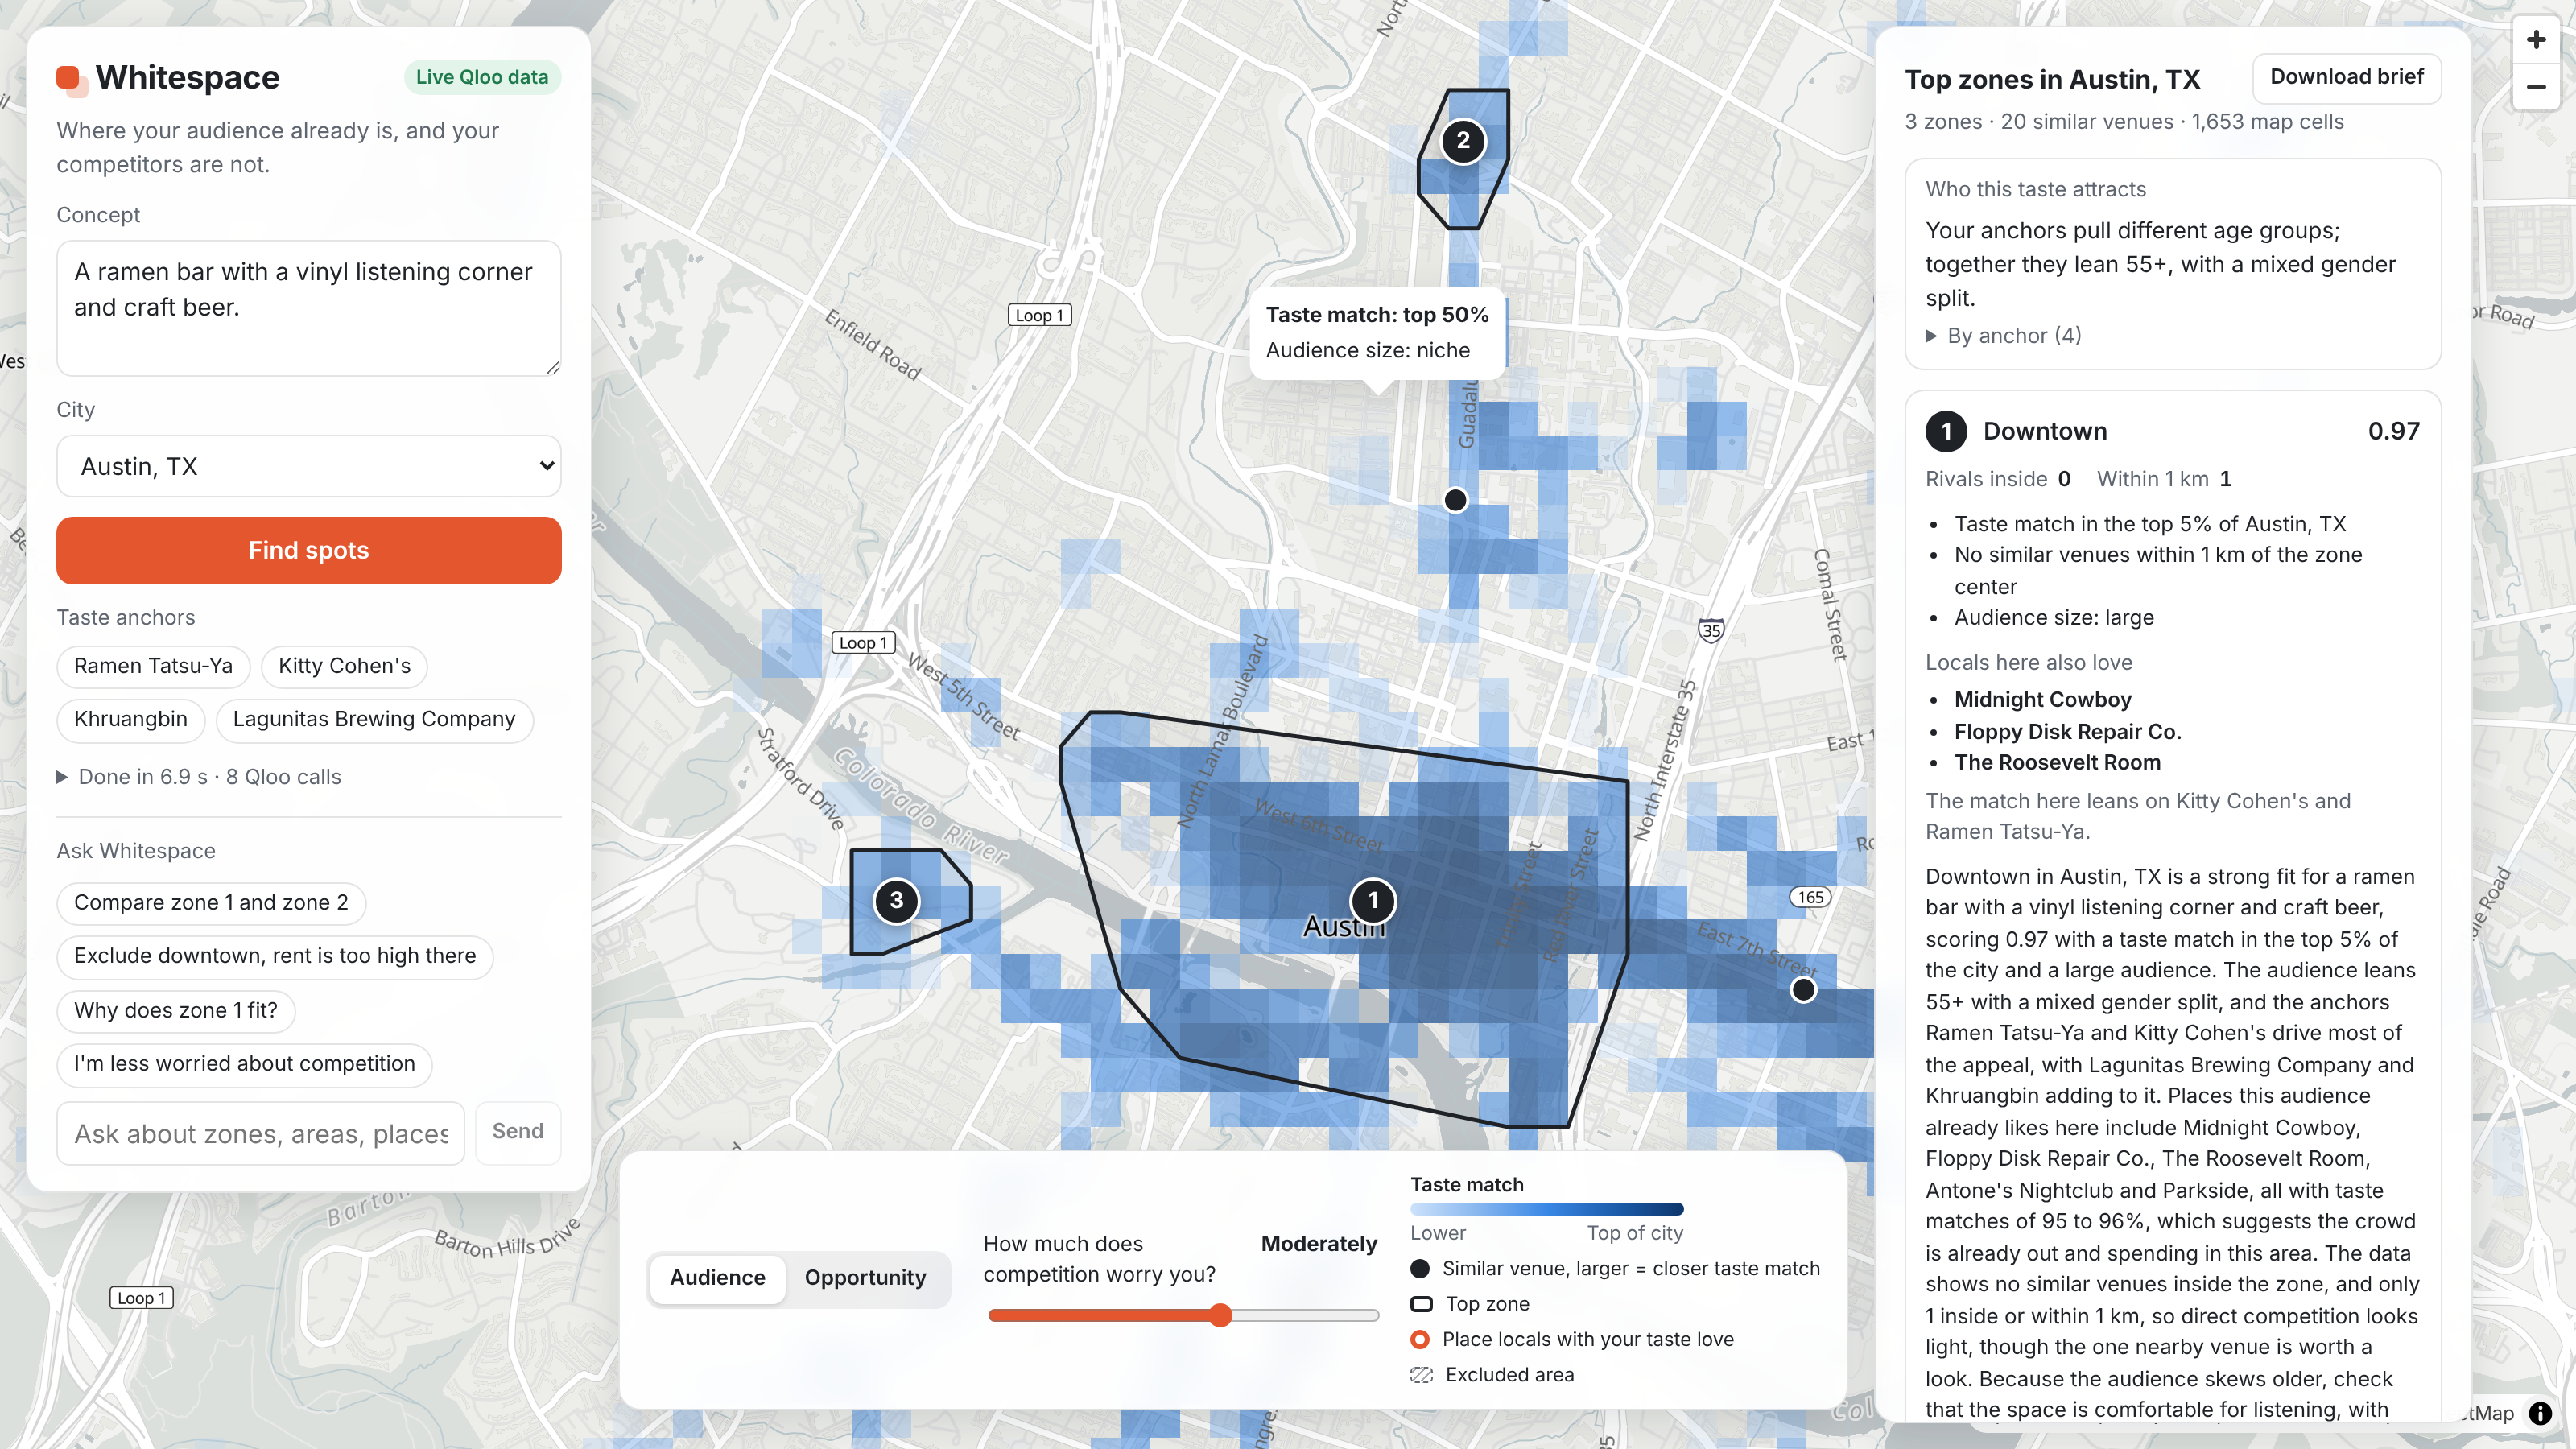
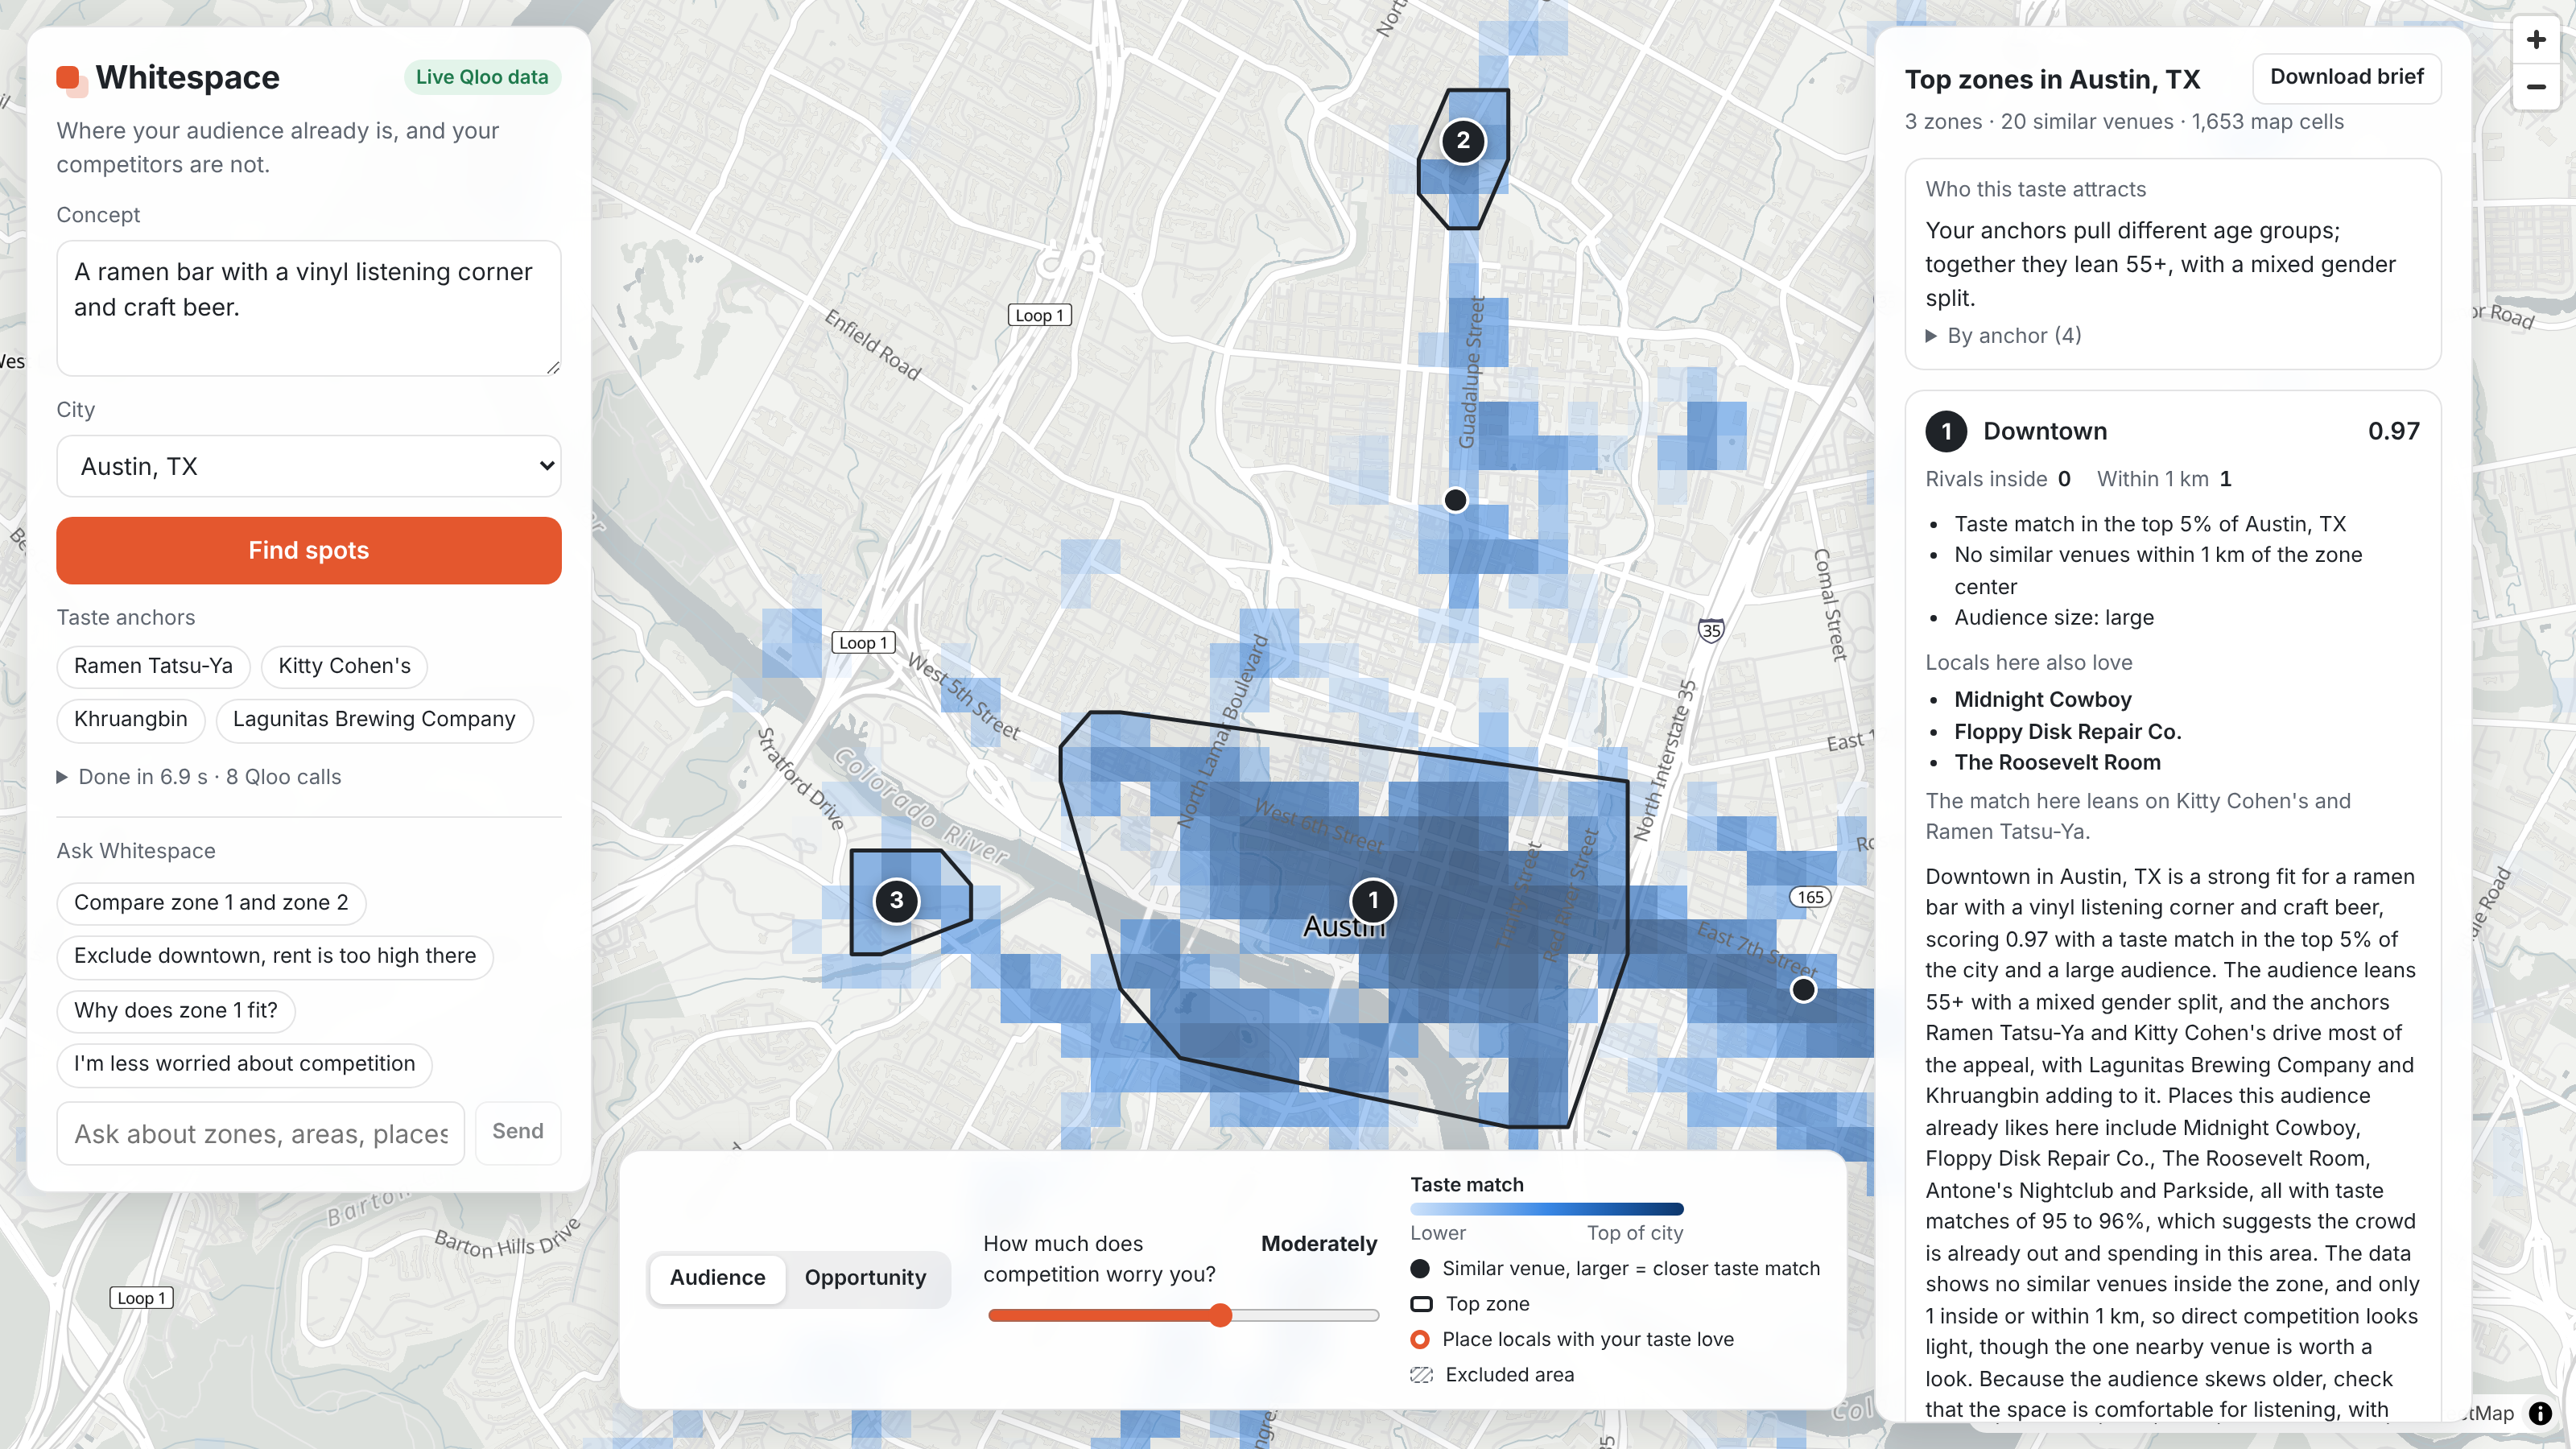
Audience layer: Qloo taste heatmap for 'ramen + vinyl + craft beer' across 1,653 Austin cells, with the top 3 zones outlined.
-
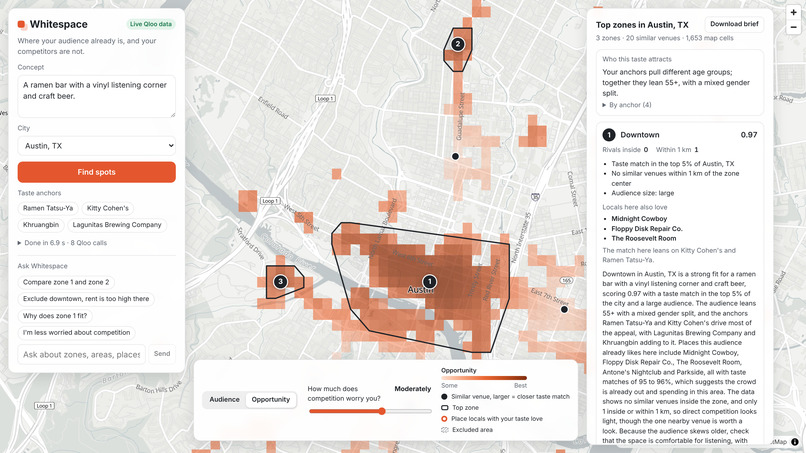
Opportunity layer: taste match minus taste-weighted competition. Rivals that appeal to the same audience count more.
-
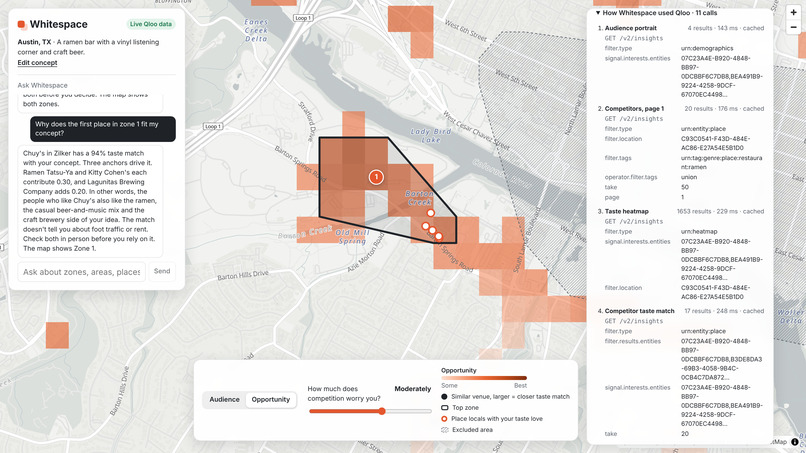
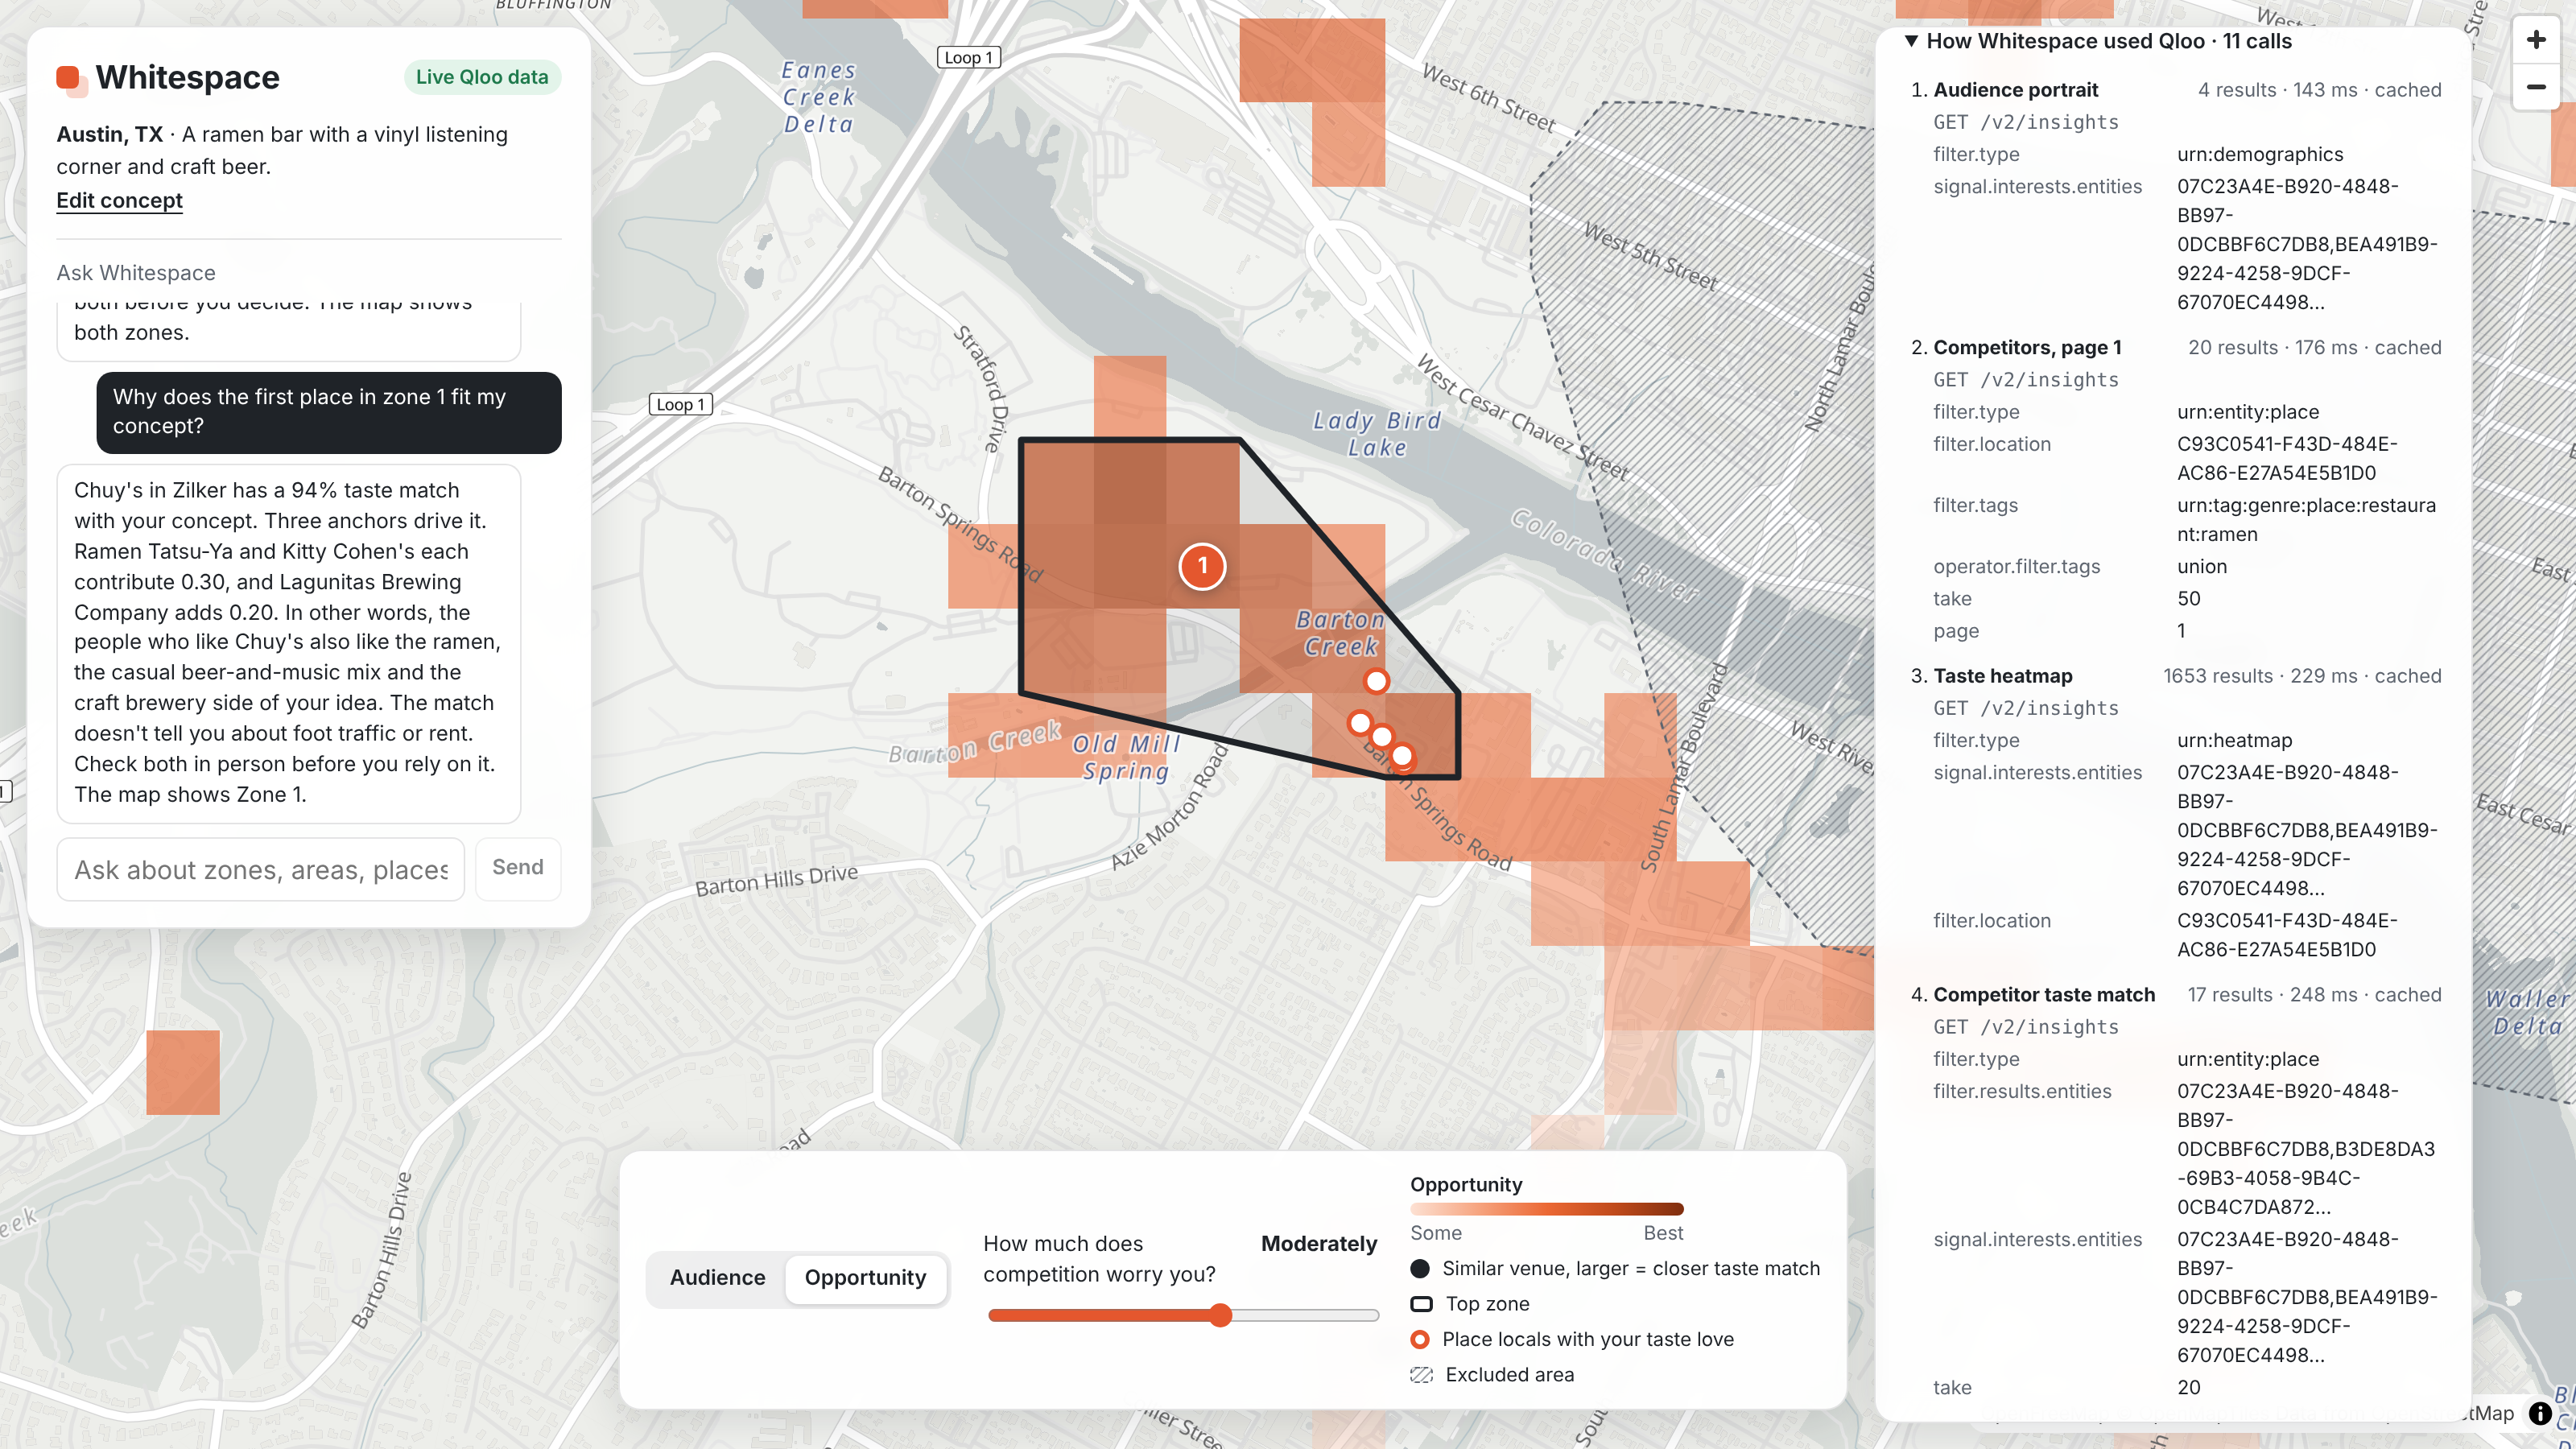
Trace panel: every Qloo call (demographics, places, heatmap, taste match) with params, result count, latency and cache status.
-
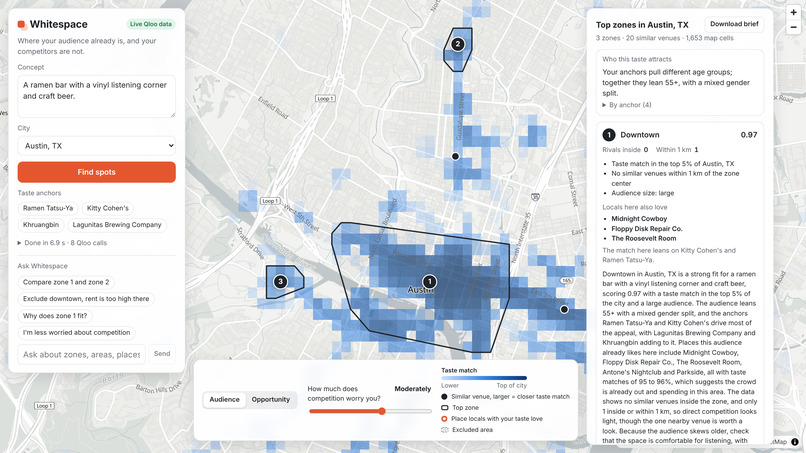
Hover a cell to see its taste-match percentile and audience size, straight from Qloo's urn:heatmap.
-
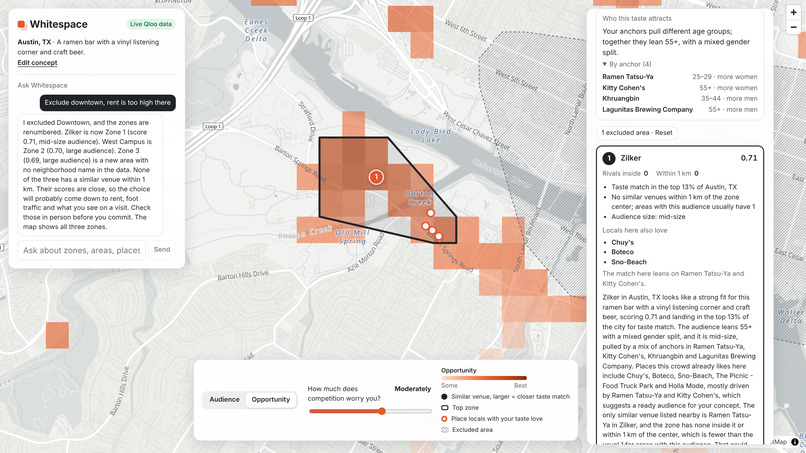
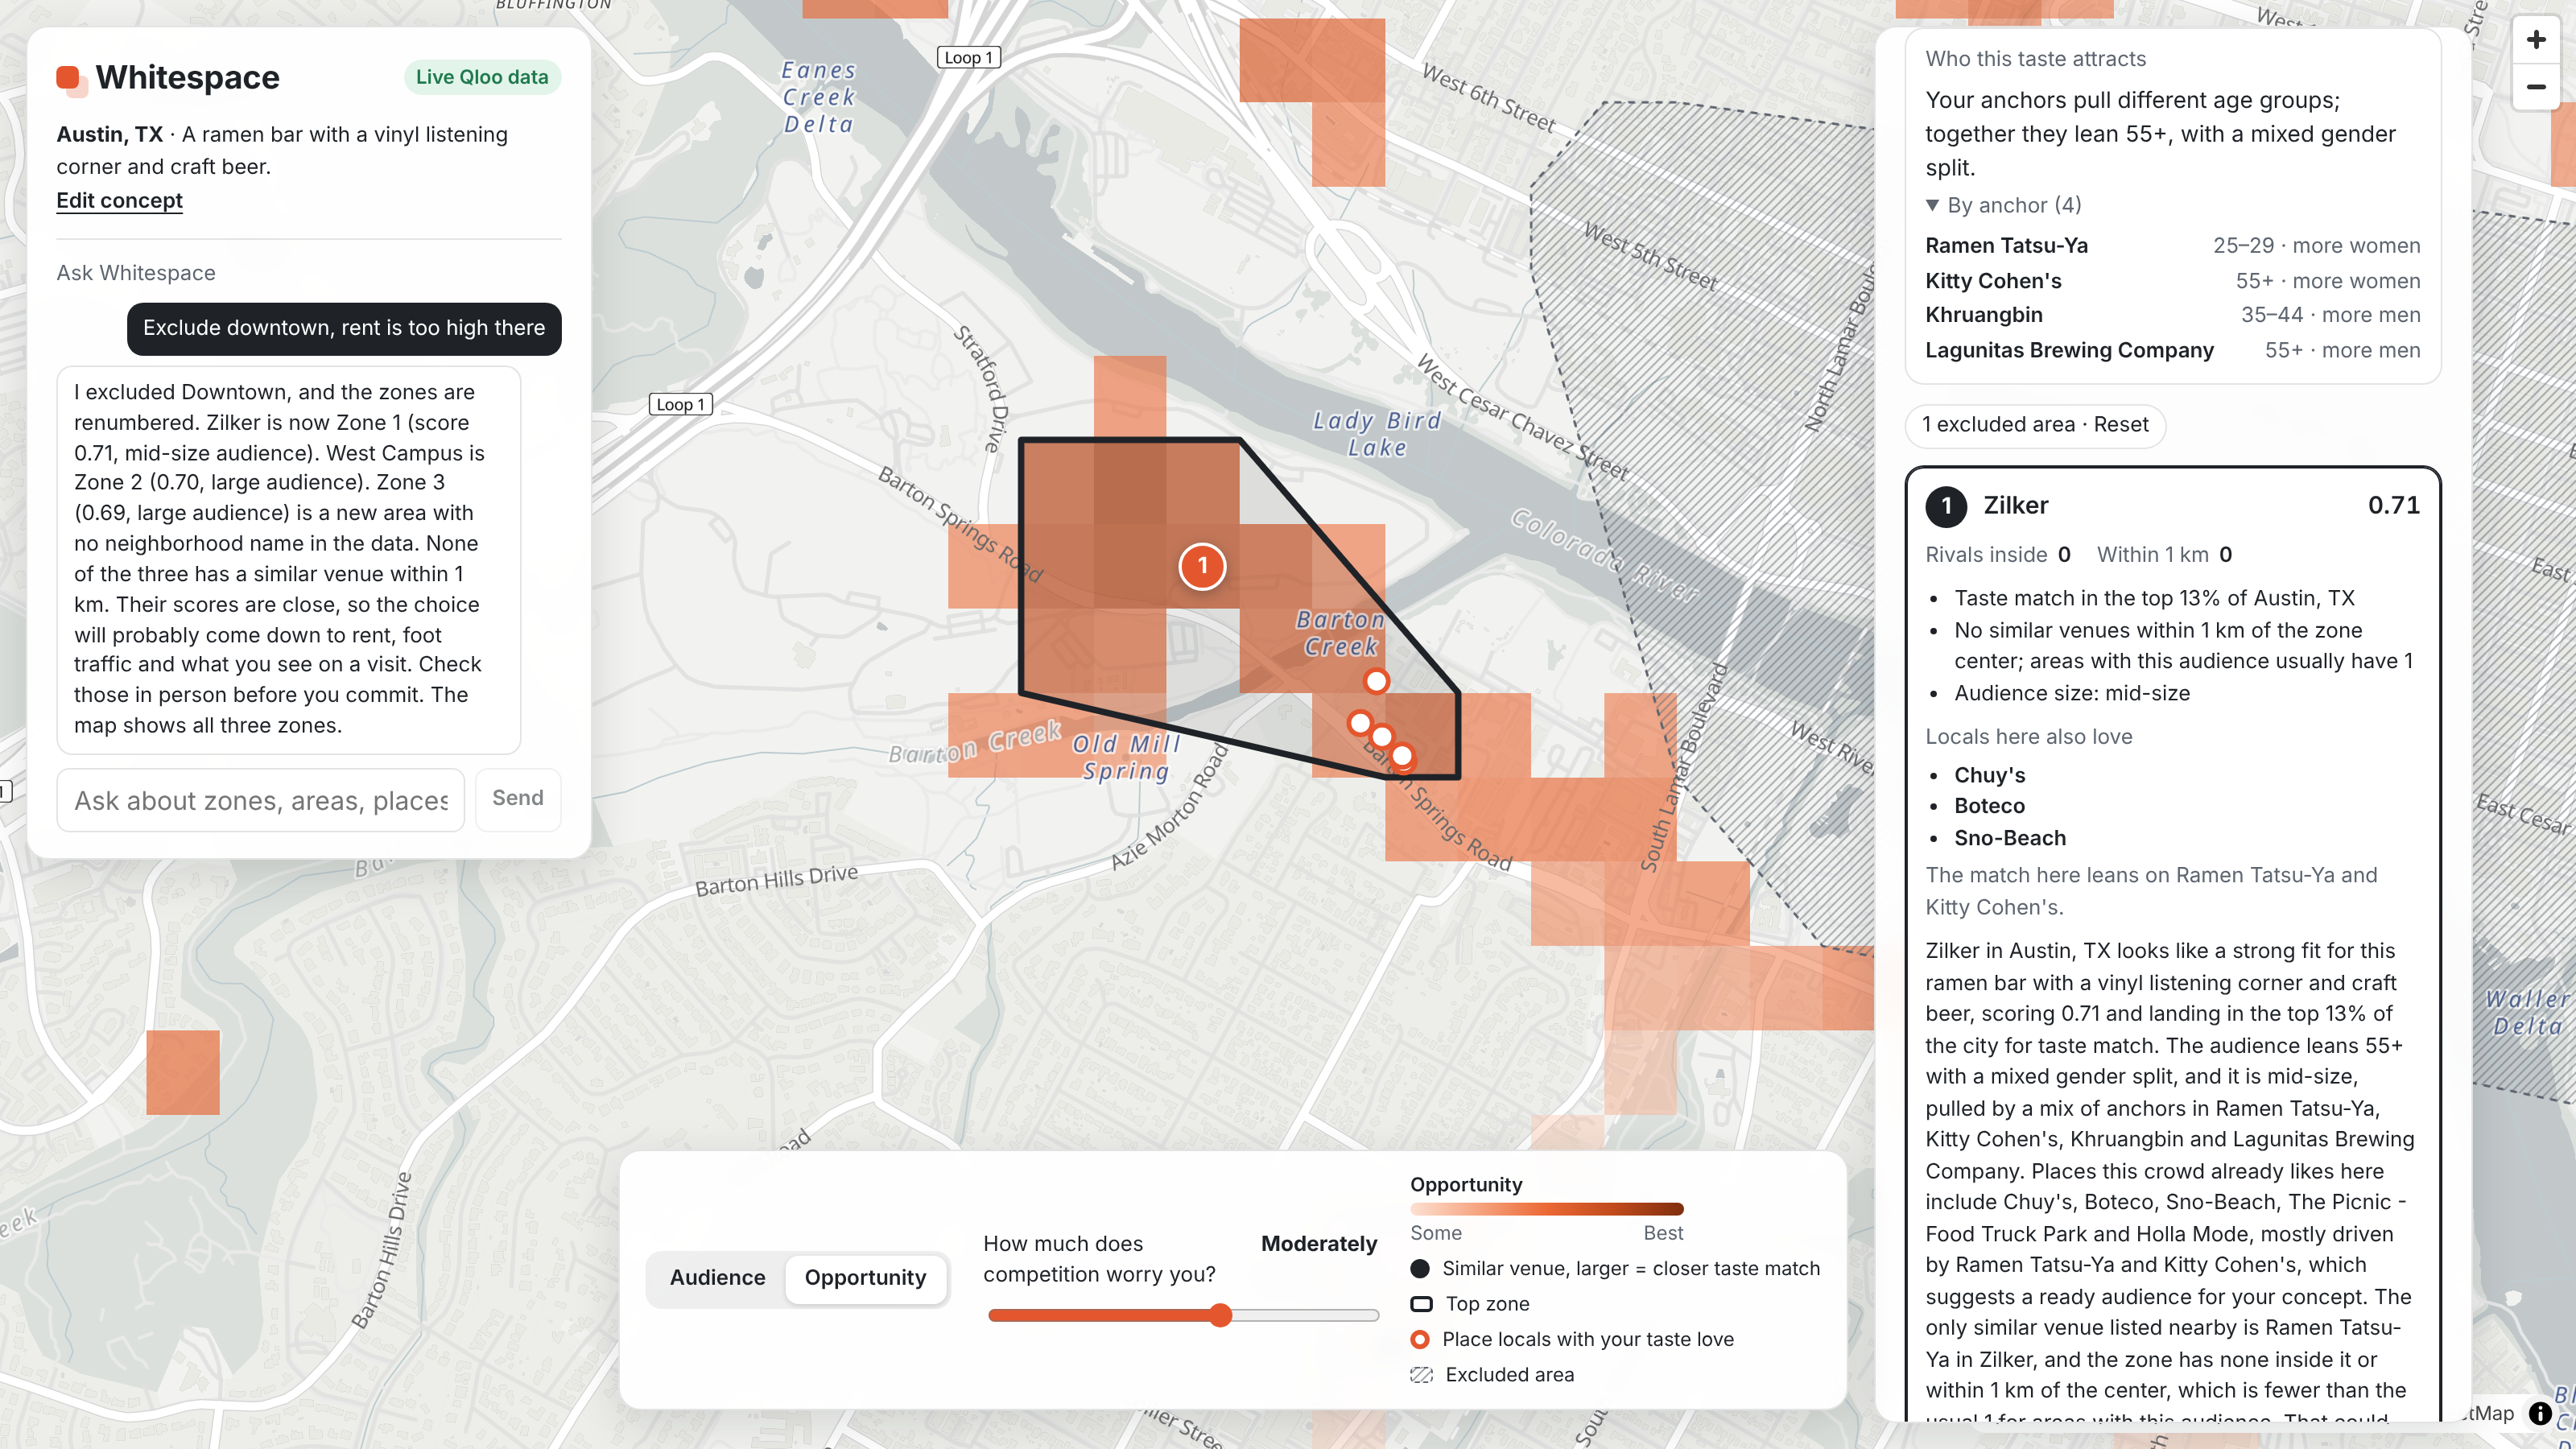
'Exclude downtown, rent is too high there': the agent removes the area, recalculates and renumbers the zones on the map.
-
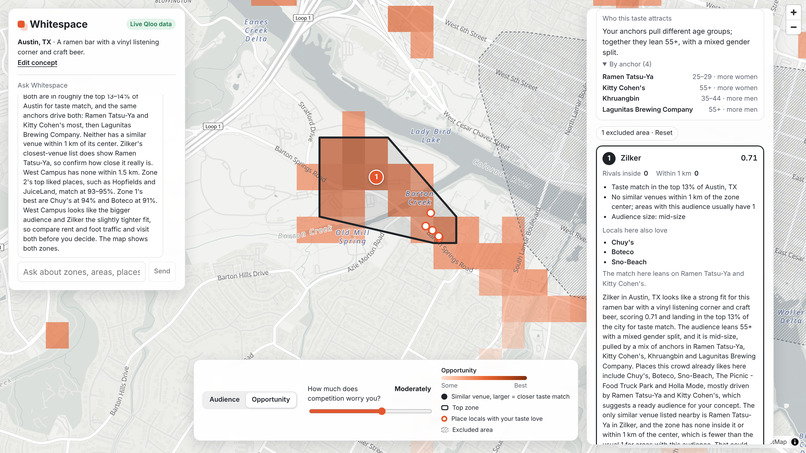
Asking the agent to compare zones: it answers from Qloo facts (taste match, drivers, rivals within 1 km), never invented numbers.
-
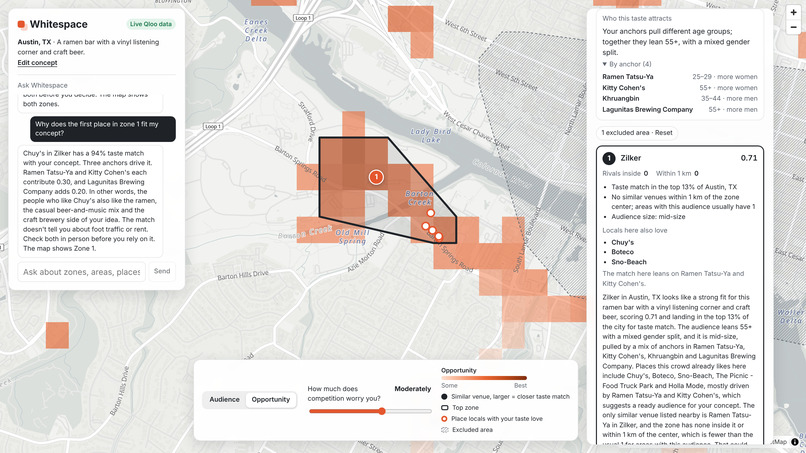
Downtown excluded: Zilker becomes zone 1. The card shows the per-anchor audience split (25-29 vs 55+) and the places locals love.
Inspiration
Classic site selection looks at foot traffic, demographics and rent. Those numbers tell you how many people are nearby, not whether they will like your concept. A ramen bar with a vinyl corner and craft beer and a family café can sit on the same street with the same traffic and have completely different fates.
We wanted a tool that answers the question a small business owner actually has: where do people with my audience's taste already live and go out — and where are similar venues still rare?
What it does
You describe your concept and pick a city (Austin, Brooklyn, Chicago and other large US cities). For example:
A ramen bar with a vinyl listening corner and craft beer. Austin, TX. Places like Ramen Tatsu-Ya and Kitty Cohen's.
Whitespace then:
- Finds taste anchors in Qloo — venues, music artists/genres and brands that capture the concept — and shows them as chips you can remove or extend.
- Paints a taste heatmap of the city (~150 m cells) showing where the concept's audience over-indexes.
- Maps competitors of the same category and weights each one by how much it appeals to the same audience.
- Scores every cell as audience minus taste-weighted competition and clusters the best cells into the top 3 zones, numbered on the map.
- Explains each zone: neighborhood, taste-match percentile, rivals inside and nearby, audience size, places the local audience loves and which anchors drive that match, plus a short grounded brief.
- Talks back through an agent: "Exclude downtown, rent is too high", "Compare zone 1 and zone 2", "Why does this place match?" — and the map recalculates.
A competition slider re-ranks zones instantly in the browser, and a Trace panel lists every Qloo call (endpoint, params, result count, latency, cache hit) so you can see exactly how the answer was produced. You can also download the whole analysis as a Markdown brief with a map snapshot.
Why it only works with Qloo
- Taste heatmap. Only Qloo gives a city-wide grid of cells with a percentile of affinity to a taste defined by specific venues, artists and brands. Maps and census data don't.
- Cross-domain taste. "Ramen + vinyl + craft beer" spans places, music and brands; Qloo merges them into one taste signal.
- Taste-weighted competition. We don't just count ramen bars — each competitor is weighted by its own Qloo affinity to the same anchors. A rival your audience loves counts more than a random venue in the same category.
- Grounded explanations. Qloo explainability tells us which anchors drive each place's match, so the agent explains zones with facts, not LLM guesses.
Without Qloo, Whitespace collapses into a "map of competitors" that any mapping service can draw.
How we built it
- Monorepo in TypeScript (npm workspaces):
api(Node.js + Hono),web(React + Vite + MapLibre GL on OpenFreeMap tiles) andshared. - Deterministic scout pipeline + agent on top. The core analysis is reproducible and streams step by step over SSE (anchors → heatmap → competitors → zones → profiles → briefs), so zones appear on the map in seconds. The agent (Claude via Amazon Bedrock, with tool use) handles concept parsing, refinements and explanations through tools like
run_scout,update_anchors,adjust_scoring,exclude_area,compare_zonesandexplain_place. - Qloo endpoints used:
/search(anchors),/v2/tags(category tags),/v2/insightswithurn:heatmap(taste map),urn:entity:placewithfilter.results.entities(taste affinity for every competitor) and with WKT zone polygons +feature.explainability(zone profiles), andurn:demographics(audience portrait by anchor). - Scoring model lives in
sharedas pure functions, so the same code runs in the browser (slider) and on the server (agent tools). Competition pressure uses a Gaussian kernel (σ = 600 m) with weight $$w_c = 0.5 + 0.5 \cdot \text{affinity}_c$$ and the cell score is $$\text{opportunity} = \text{affinity} \cdot (1 - k \cdot \text{pressure})$$ Top cells are clustered with DBSCAN into zones, withepsadapted to the geohash precision of each city. - Grounding by tokens. The LLM never writes entity names itself — it references places as
[[p1]]tokens that code replaces and validates; failed checks trigger one regeneration, then a template fallback. - One Qloo client with a parameter allow-list per
filter.type, rate limiting, retries, a two-level cache (memory + private persistent volume) and a "stale beats error" policy that is always labeled in the UI. - Deployment: a single Docker container serving API and frontend, with a scheduled GitHub Actions smoke test against the live demo.
Challenges we ran into
- Silent parameters. Qloo returns 200 with empty or unfiltered results for unsupported params, so we built a per-type allow-list and verified every parameter live.
- Noisy heatmaps. Raw cells ripple, and single spikes (like Austin airport) became fake zones. We added Gaussian smoothing over neighbors and re-ranked to percentiles.
- Mixed audiences. Demographics per anchor differ wildly (ramen skews 25–29, a beer brand 55+), so a plain average lied. We show both the overall portrait and the per-anchor breakdown.
- Different grid sizes. Some cities come back in geohash-6, others in geohash-7, so clustering distance had to adapt to cell size.
- Keeping the LLM honest about names and numbers — solved with token grounding and code-built reasons.
Accomplishments that we're proud of
- A taste-first site-selection workflow that goes from a sentence to three explained zones on a map in seconds.
- Every claim is traceable to a Qloo call in the Trace panel.
- Instant, offline re-scoring in the browser with the same code the agent uses.
What we learned
Taste and density are different signals: high affinity often appears where popularity is low, which is exactly where opportunities hide. We also learned how much careful parameter validation and caching matter when building on a rich but strict API.
What's next for Whitespace
- Price-level matching for competitors and a neighborhood price layer.
- Zone taste tags ("locals here over-index on…") and audience culture (artists and brands) for marketing ideas.
- Combining taste with rent and foot-traffic data, and more cities beyond the US.
Taste match is one signal, not a full site analysis — always check rent, traffic and visit in person.
Built With
- amazon-bedrock
- claude
- docker
- github-actions
- hono
- maplibre
- node.js
- openstreetmap
- qloo
- react
- turf.js
- typescript
- vite
- vitest
- zod


Log in or sign up for Devpost to join the conversation.