-
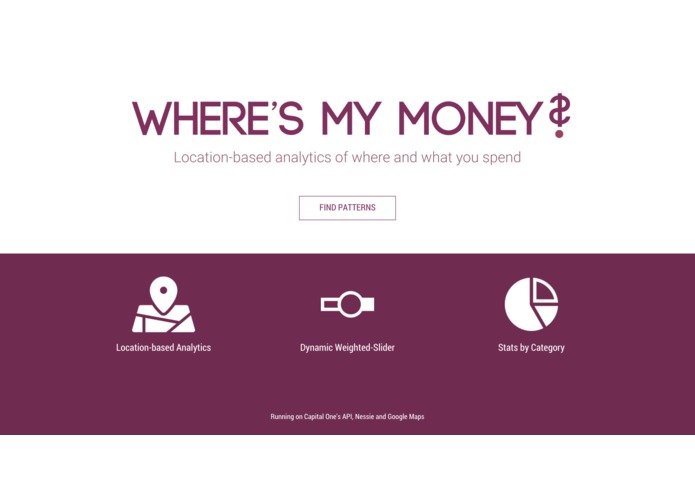
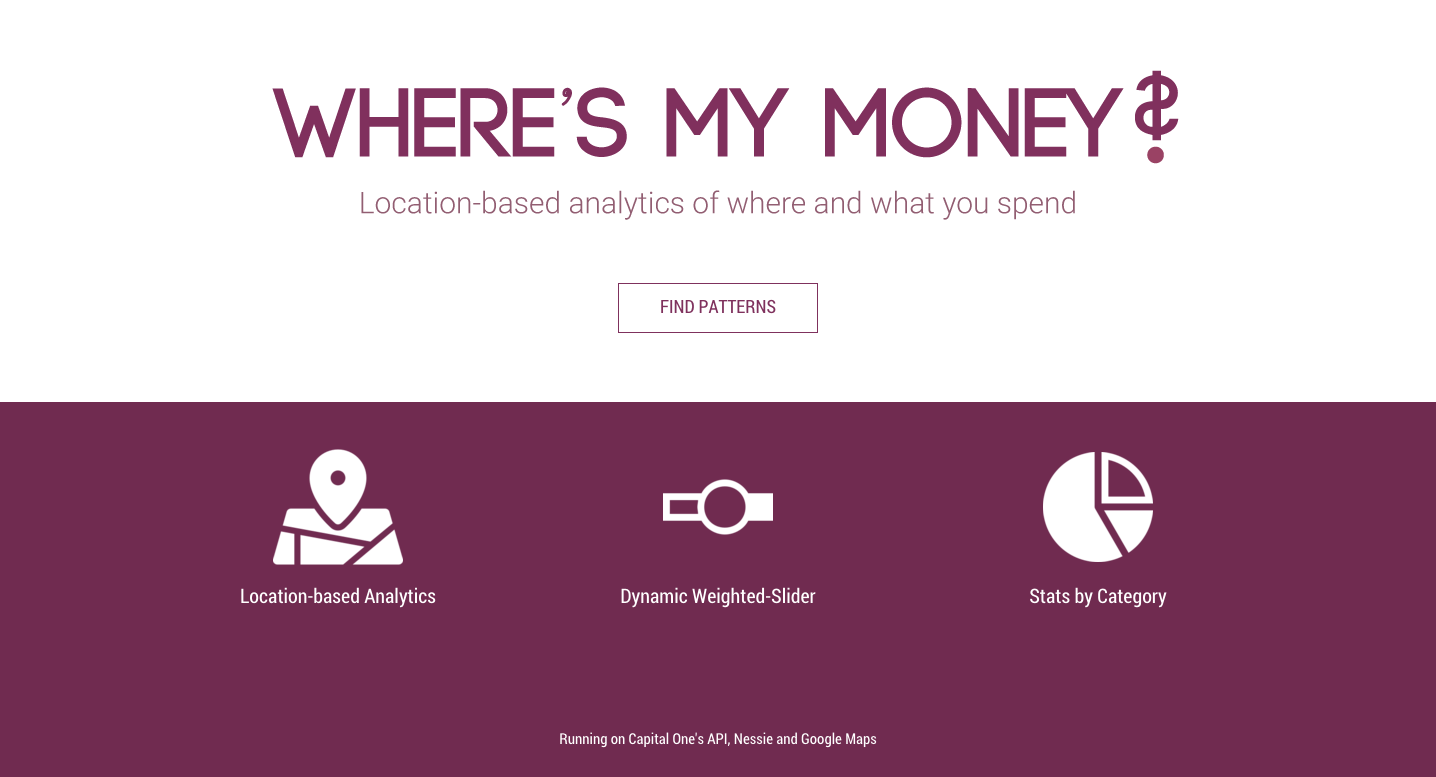
Welcome Screen
-
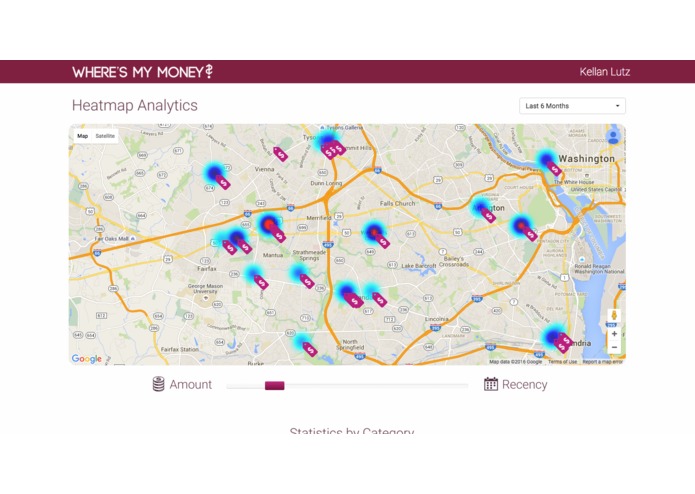
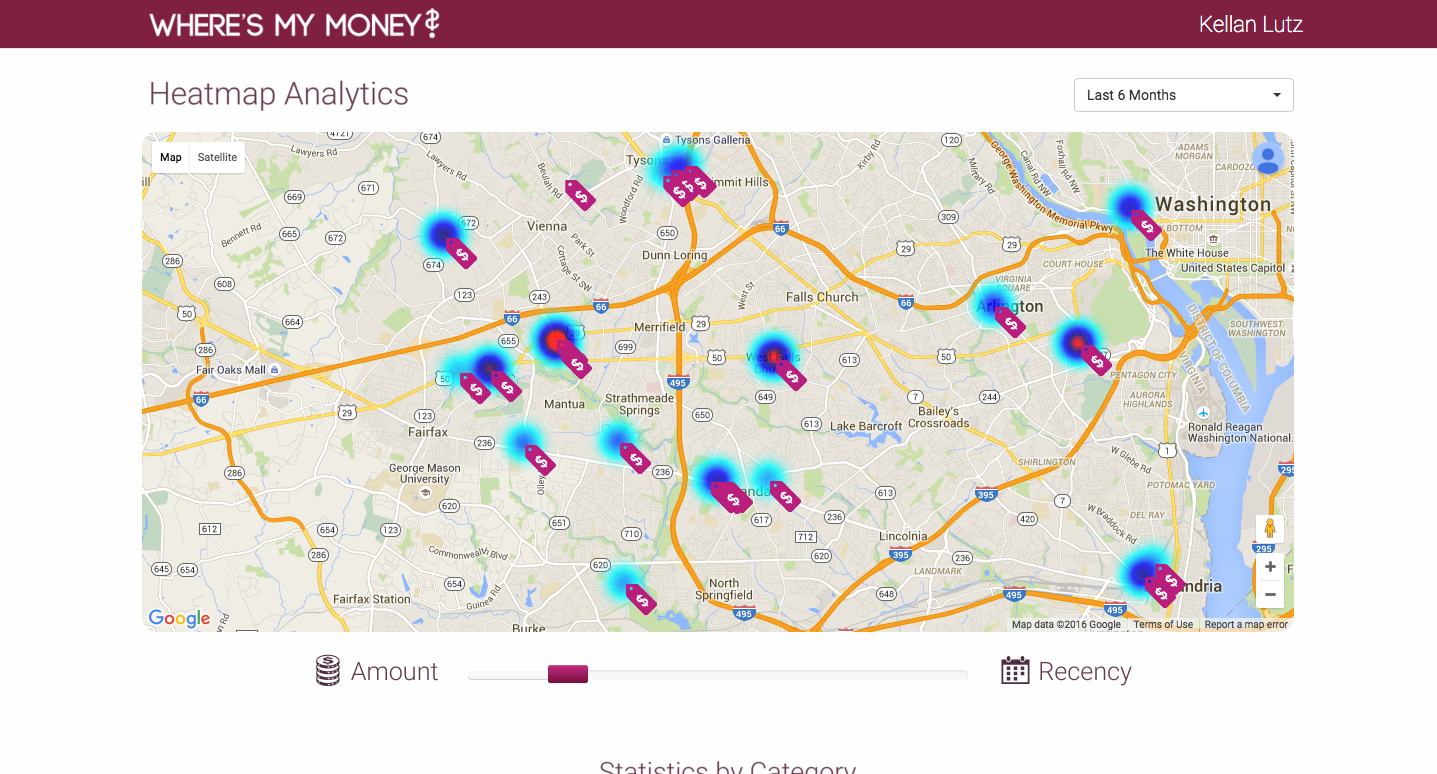
Dynamic Heatmap
-
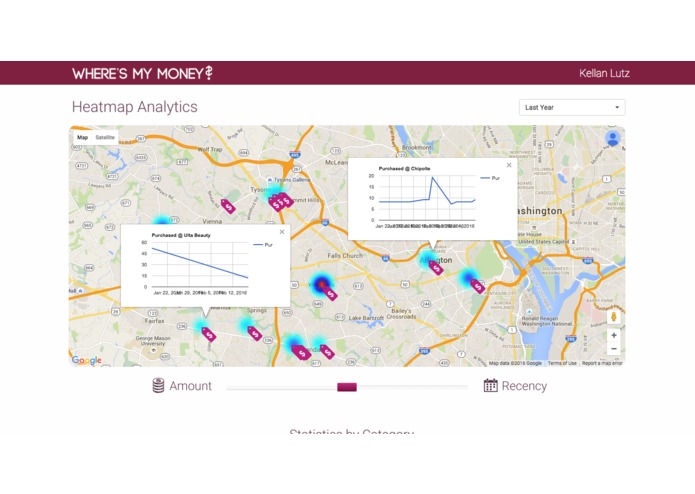
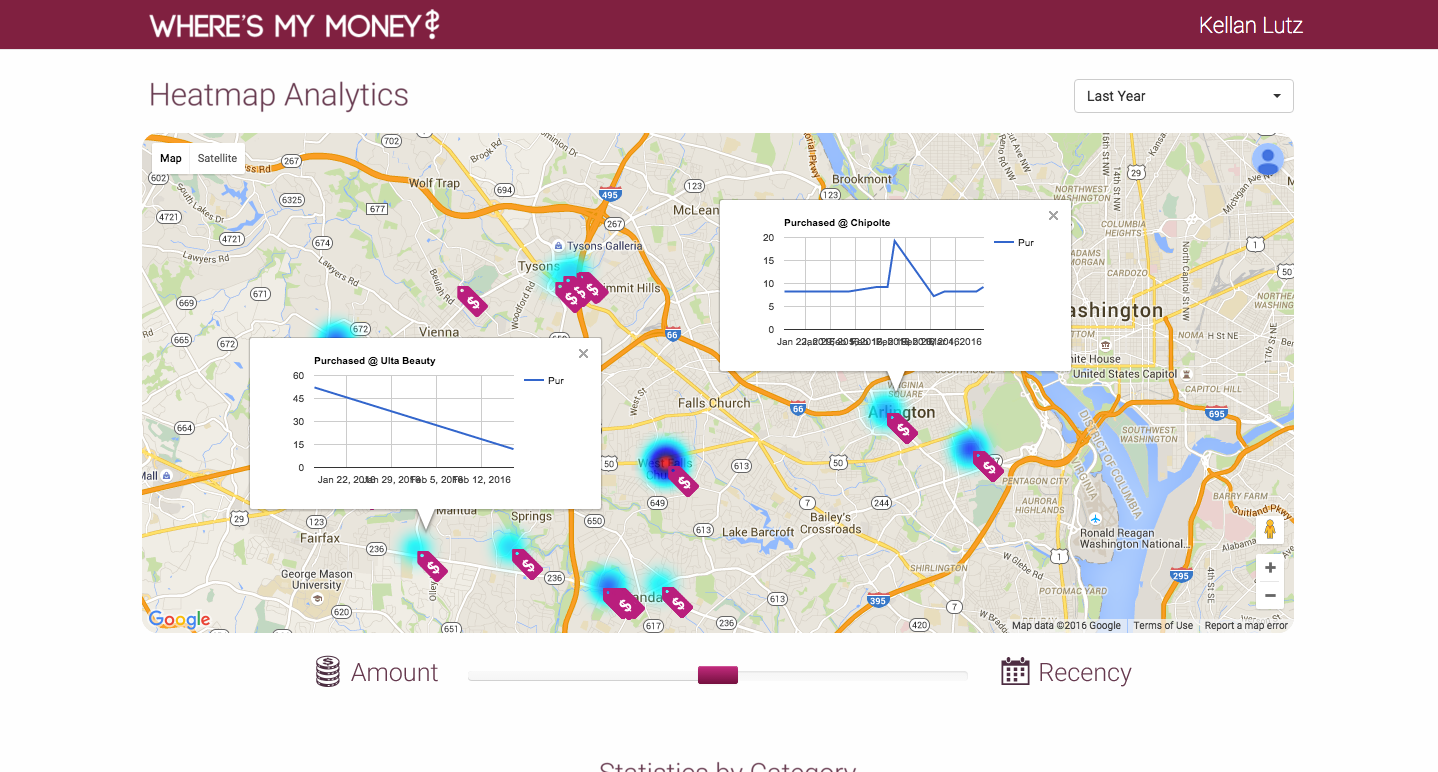
Spending History Chart on Map Markers
-
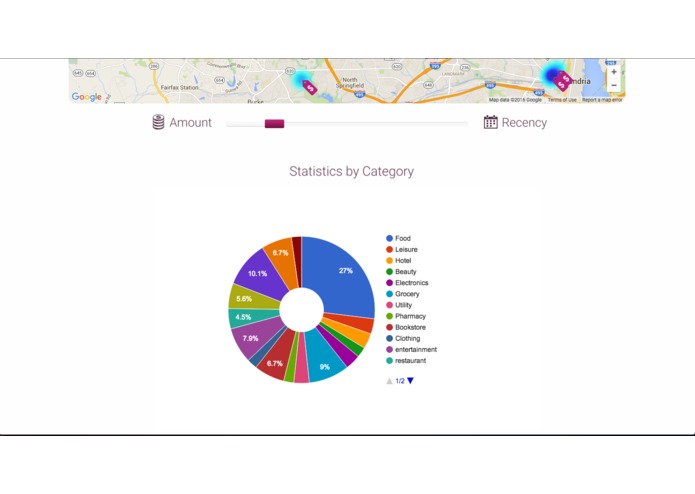
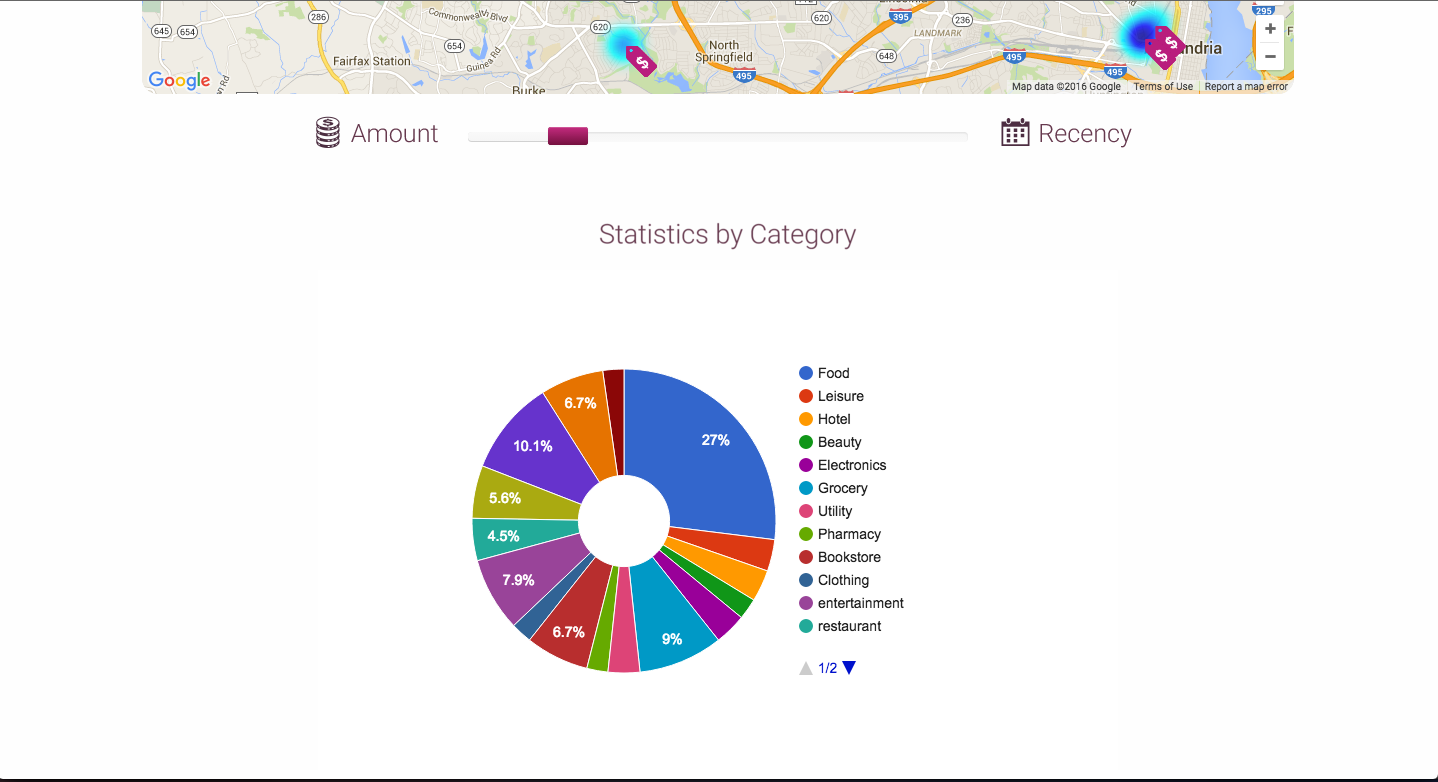
Category Data Pie Chart
Inspiration
People often make impulse purchases and quickly forgot that did so. Often, these purchases are made in same vicinity, and there is a lack of data-analytical tools for customers to view these correlations. By allowing customers to view this data, they'll be able to discern general spending patterns and can save money by changing their habits.
What it does
Where's My Money? tracks your spending history onto a dynamic heatmap. The dynamic weighted-slider below the map allows one to place weight based on the recency of the purchase and/or the amount of the purchase. In addition, the period of time can be cycled between the last several months to the last year or all-time. Where's My Money? also provide stats based on category of the purchase such as food, clothing, and groceries.
How we built it
Where's My Money? is a client-based web application that uses Capital One's API, Nessie to query spending data and Google Maps to illustrate this data onto a heatmap. It uses Bootstrap for the front-end and is written in HTML, CSS3, and JS.
Challenges we ran into
Asynchronous processing of querying data and adding it to the heat-map
Accomplishments that we're proud of
Synchronous processing of querying data and adding it to the heat-map
What we learned
This was our first experience using Bootstrap and JQuery to build a web application so we learned tons.
What's next for Where's My Money
We're looking to go on Shark Tank.


Log in or sign up for Devpost to join the conversation.