-
-
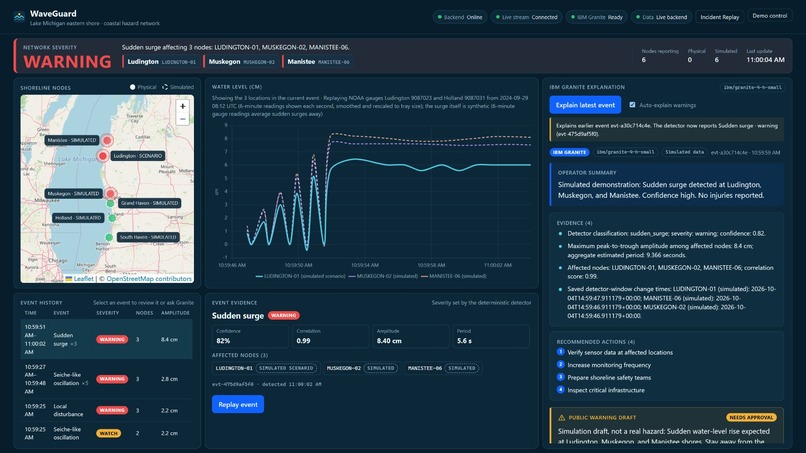
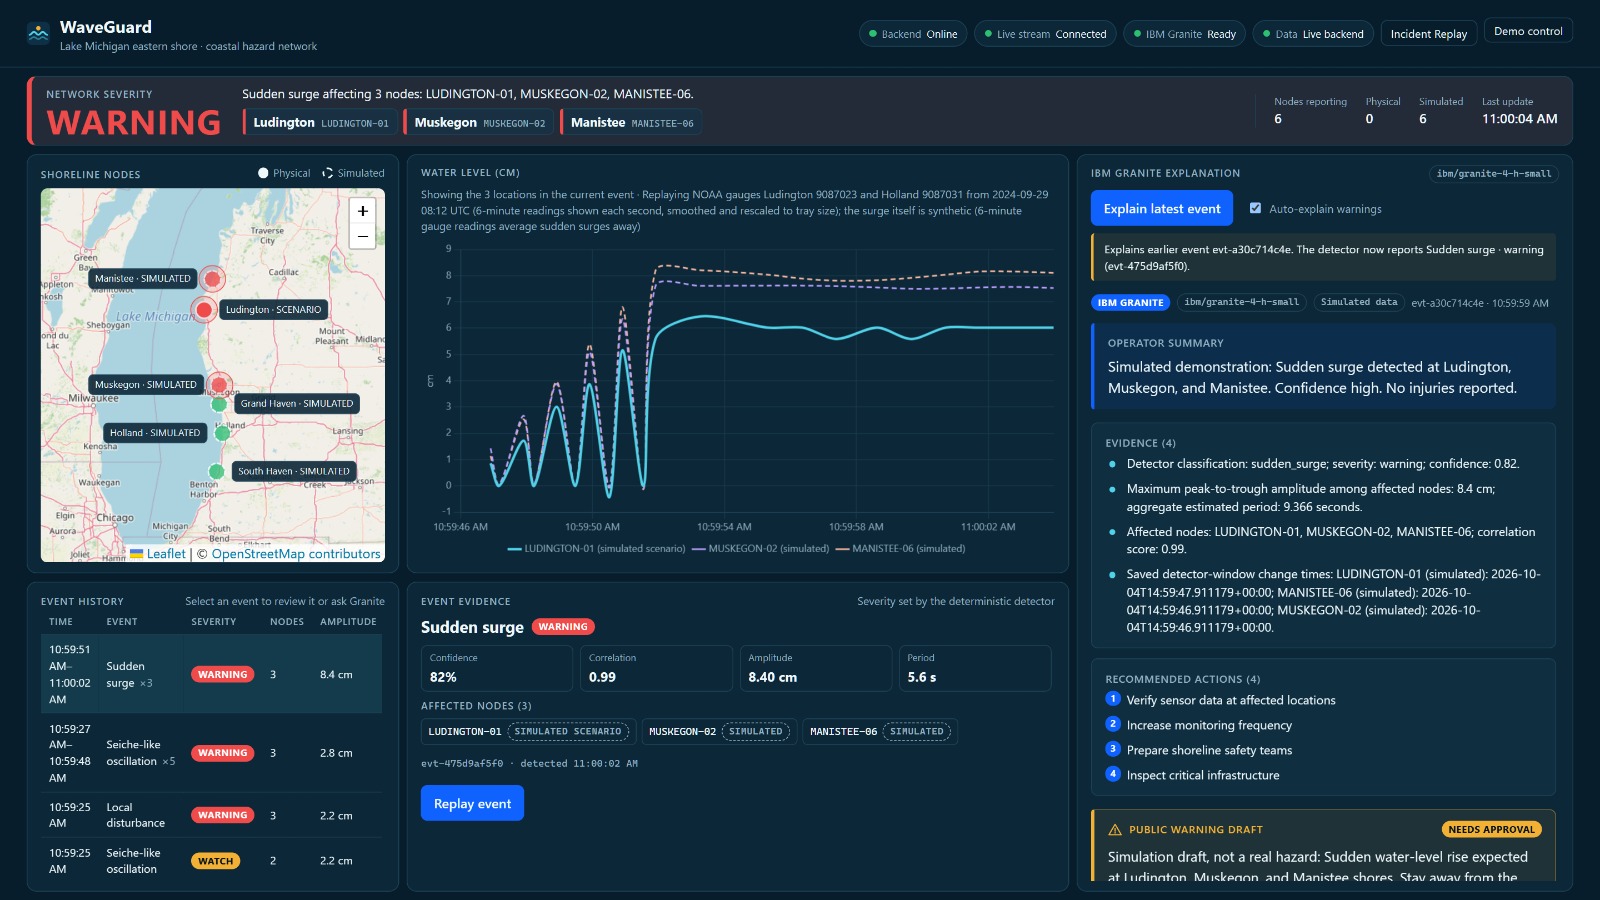
sudden surge
-
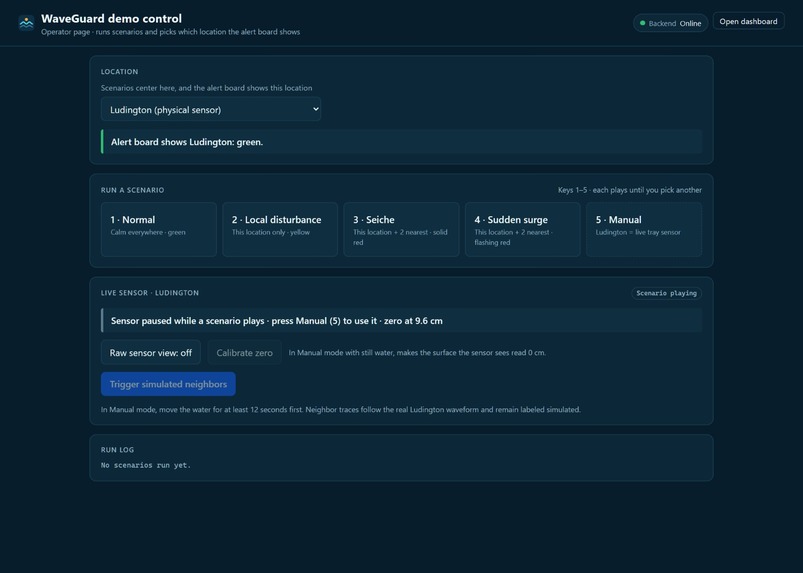
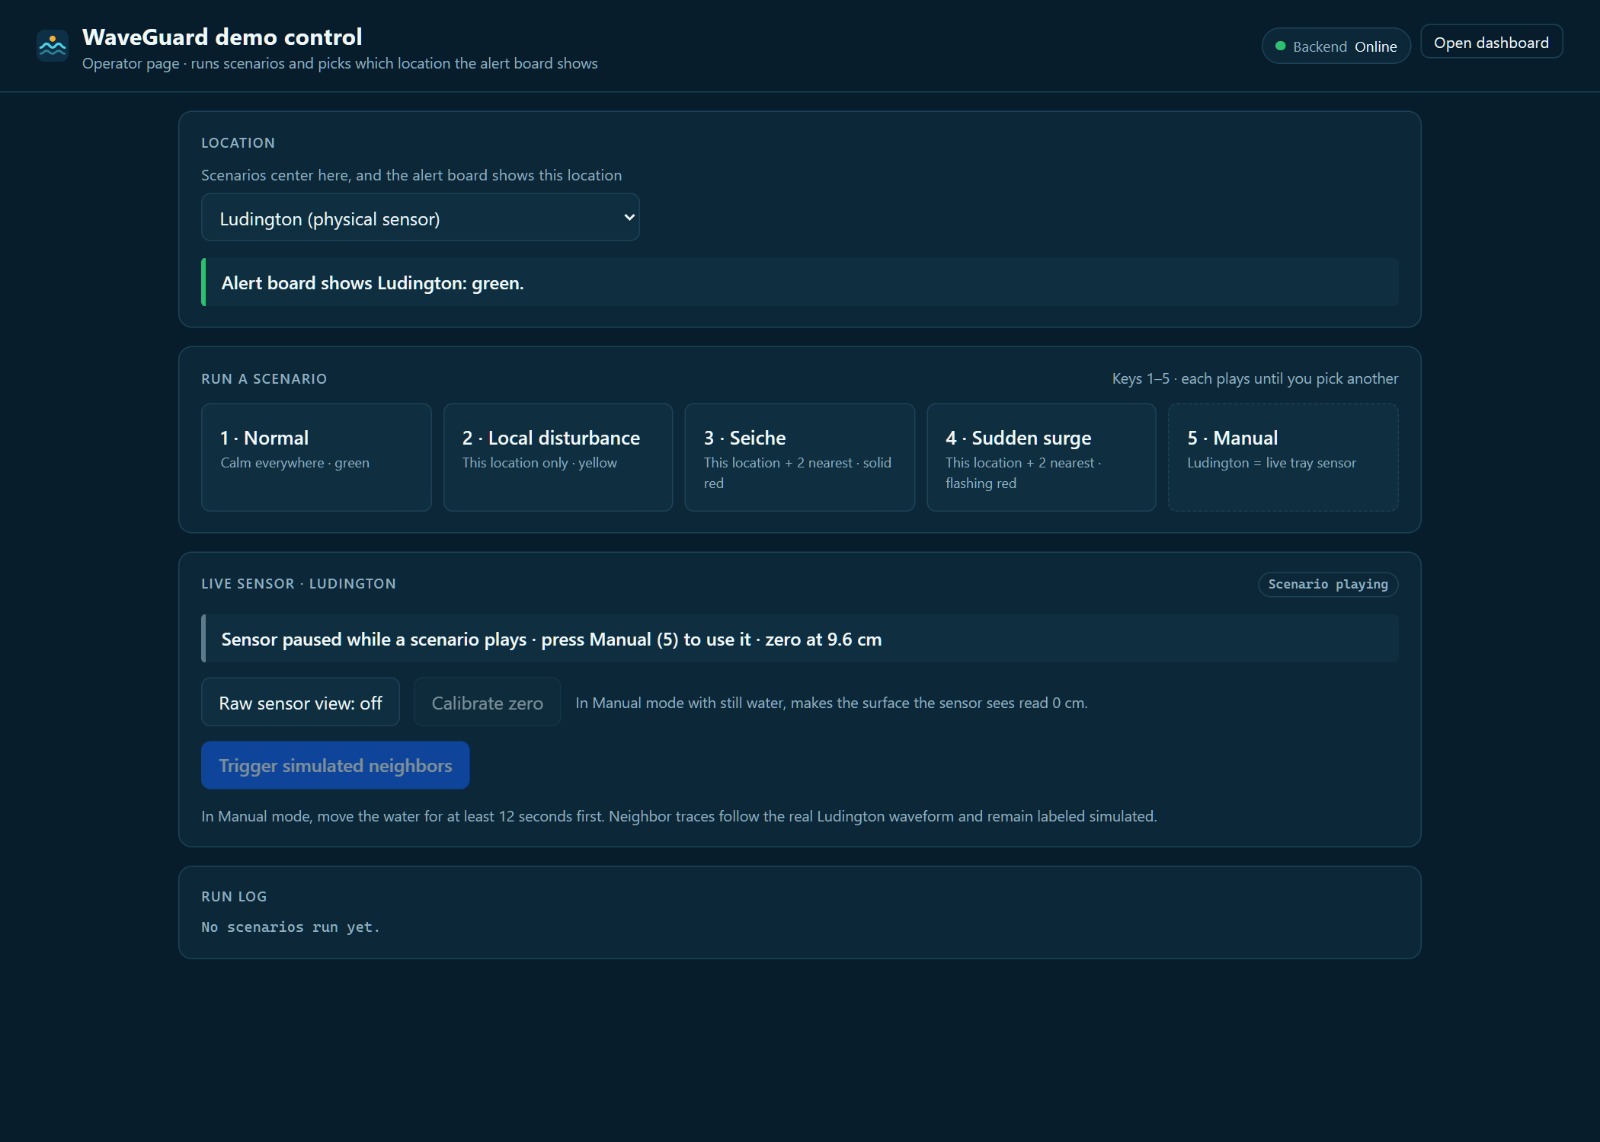
admin portal for simulation/callibration
-
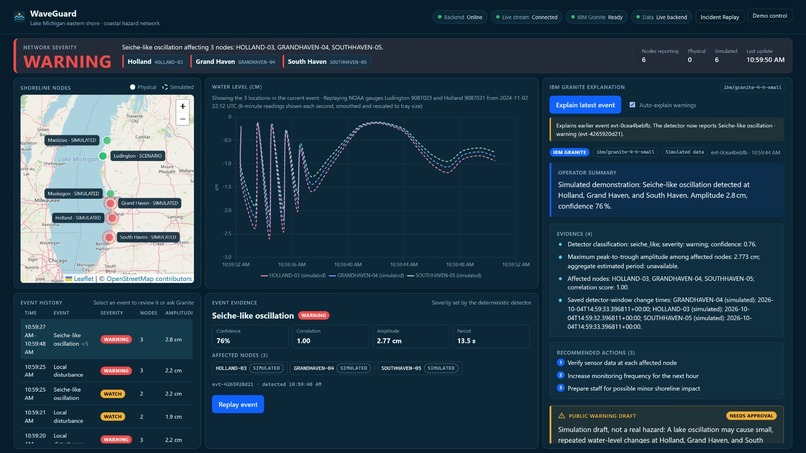
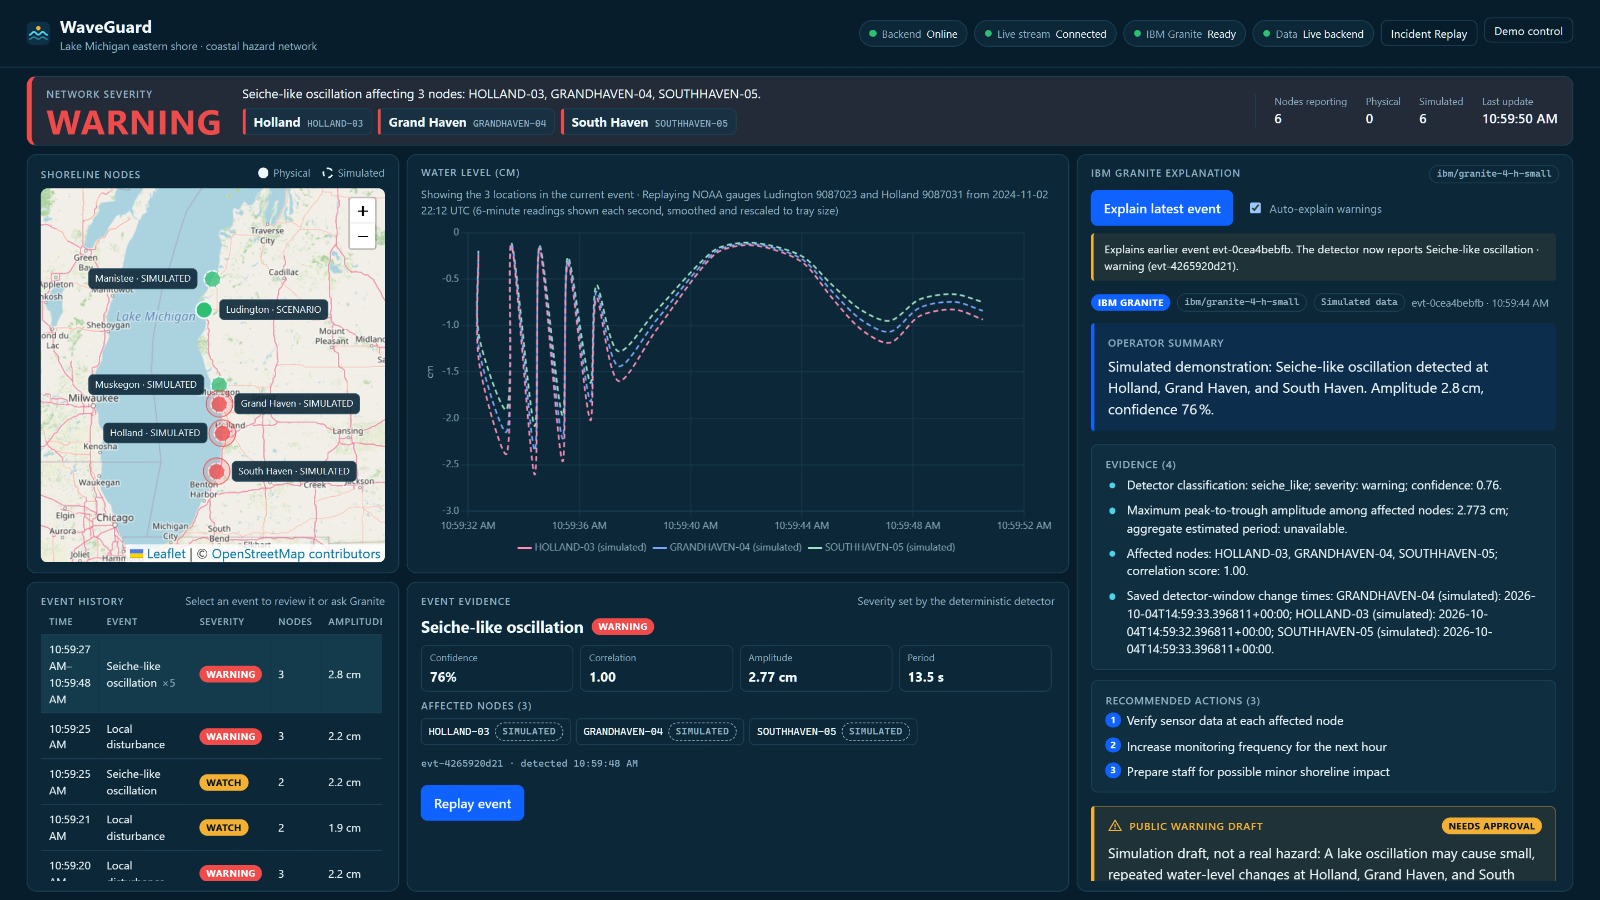
seiche
-
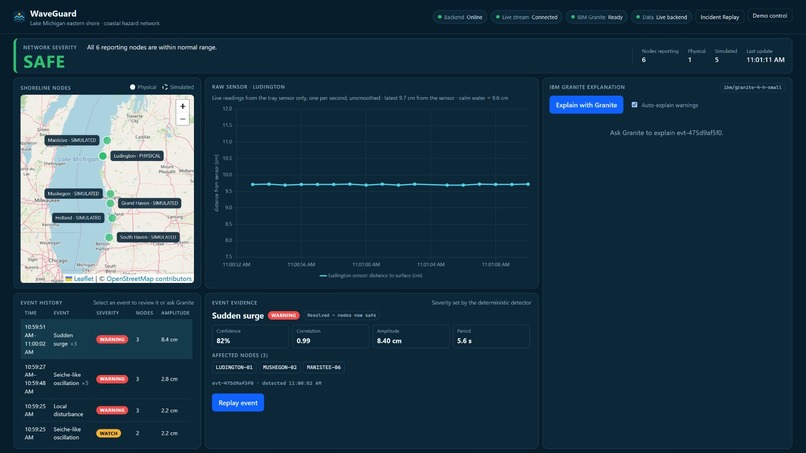
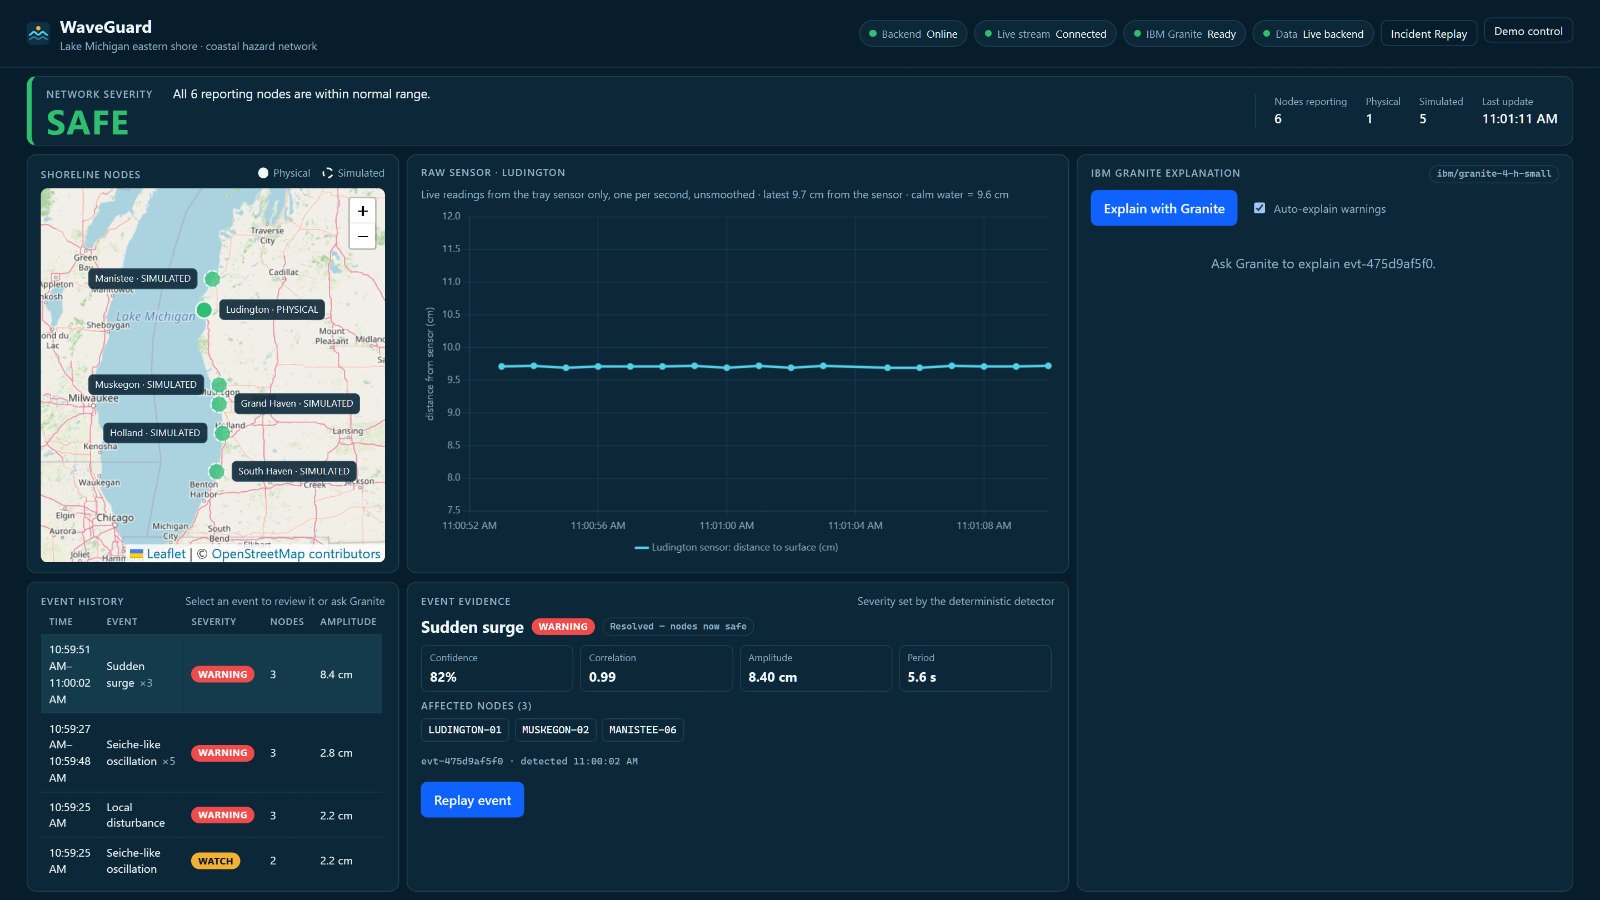
safe
Inspiration:
A seiche is what happens when wind pushes water across a lake and it sloshes back, much like water in a bathtub. That movement can raise water levels along a shoreline surprisingly quickly. Michigan has seen a related danger firsthand: in April 2018, a weather-driven meteotsunami near Ludington overtopped harbor walls and damaged homes and boat docks.
That made us wonder: if water suddenly rises at one sensor, how do you know whether it is a real shoreline hazard, a boat wake, or a bad reading? WaveGuard looks for the pattern across multiple locations and gives people a clear explanation of what it found.
What it does:
Our physical Arduino node measures the water level in a tray once per second and represents Ludington. Five clearly labeled simulated stations represent other locations along Lake Michigan. For our calm and seiche demos, those stations replay NOAA gauge records scaled to the tray; our sudden-surge scenario is synthetic and labeled as such.
A Python detector checks each station, then compares them. One unusual reading is treated as a local disturbance. When at least three stations show a correlated change, WaveGuard raises a seiche-like or sudden-surge warning. A live dashboard shows the map, chart, and alert, while LEDs and a buzzer give an immediate signal at the physical station.
IBM Granite on watsonx.ai turns the detector’s result into an operator summary, supporting evidence, recommended actions, and a draft public warning. The detector decides the severity; the AI explains it.
Tiger Data lets us show the evidence after an alert. Every physical and simulated reading is saved in a TimescaleDB hypertable with its time, station, and source. When an incident is detected, WaveGuard also saves the exact window of readings the detector used. In Incident Replay, you can play or scrub through those readings, see which stations changed first, check which data came from the Arduino or simulation, and read the rule behind the warning.
How we built it:
WaveGuard uses an Arduino UNO Q and an ultrasonic sensor for the physical node, FastAPI and Python for detection, WebSockets for live updates, and a JavaScript dashboard with Chart.js and Leaflet. Tiger Data stores the time series and incident evidence. A phone-friendly admin page lets us choose a scenario, switch to the live sensor, and calibrate it over still water.
The hardware taught us the most. We had to route serial data through the UNO Q’s RouterBridge, replace unreliable echo timing, and smooth sensor noise before the physical readings worked well with our detector. We also built a mixed-source demo: moving real water in the tray can trigger simulated neighboring stations, with each source clearly labeled.
What we learned and what’s next:
We learned that an alert is more useful when someone can inspect how it happened. Keeping detection rule-based made the result predictable; IBM Granite makes that result easier to understand; Tiger Data makes it possible to replay the evidence. Our 40 automated tests cover the detector, scenarios, serial protocol, and AI client.
This is a proof of concept. Next, we want to replace the simulated stations with weatherproof sensors on real harbor walls, connect live NOAA feeds, and tune the warning thresholds against longer real-world recordings.
Built With
- arduino
- arduino-uno-q
- c++
- chart.js
- css3
- fast-api
- hc-sr04
- html5
- ibm-granite
- ibm-watsonx
- javascript
- leaflet.js
- noaa
- openstreetmap
- postgresql
- pydantic
- pyserial
- python
- sqlite
- tigerdata
- timescaledb
- websockets


Log in or sign up for Devpost to join the conversation.