-
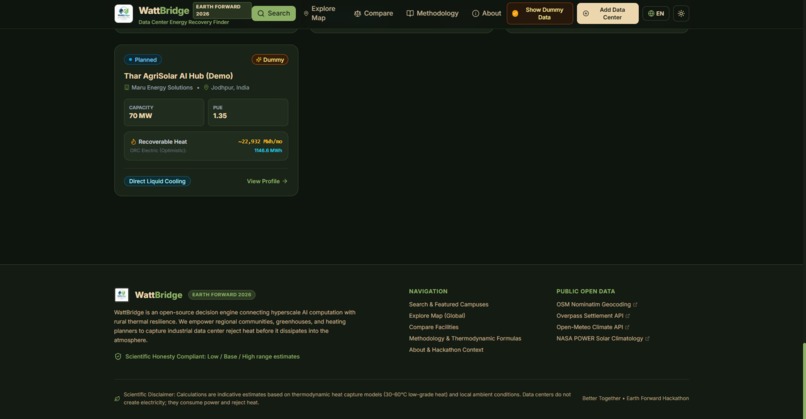
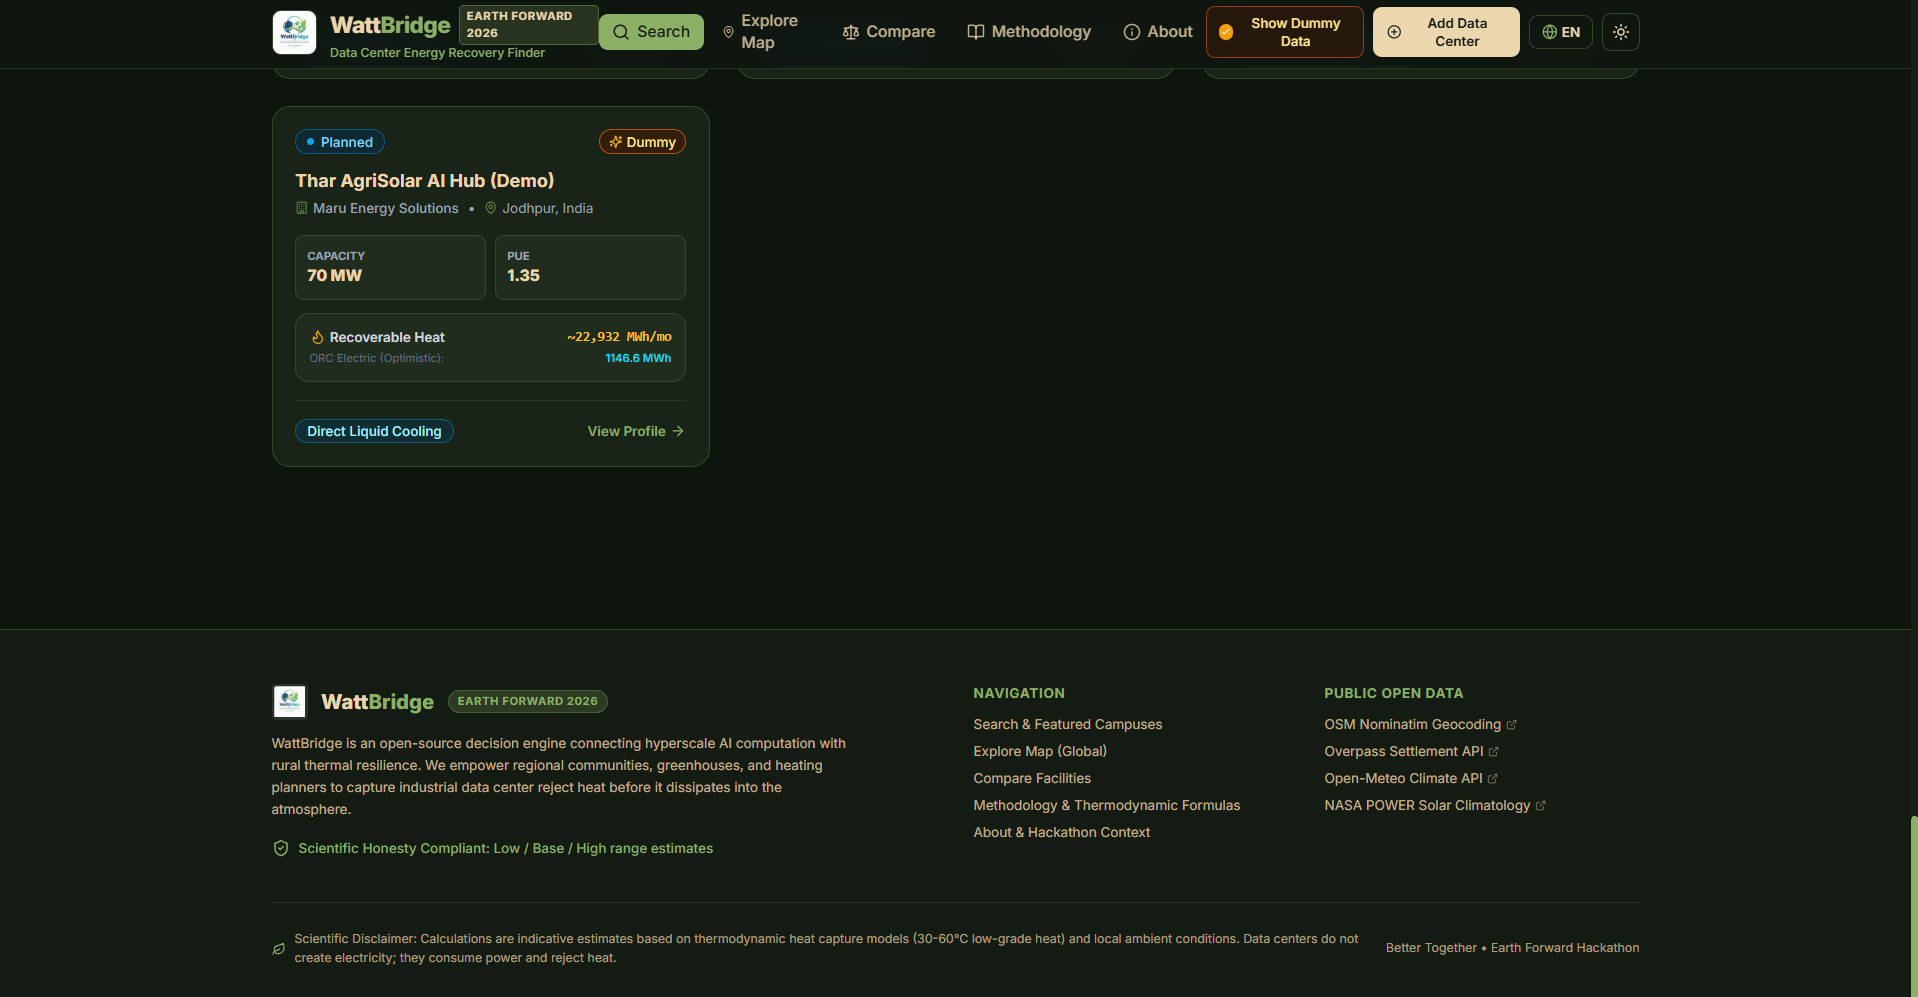
Details for the planned Thar AgriSolar AI Hub demo alongside WattBridge's open-source recovery overview.
-
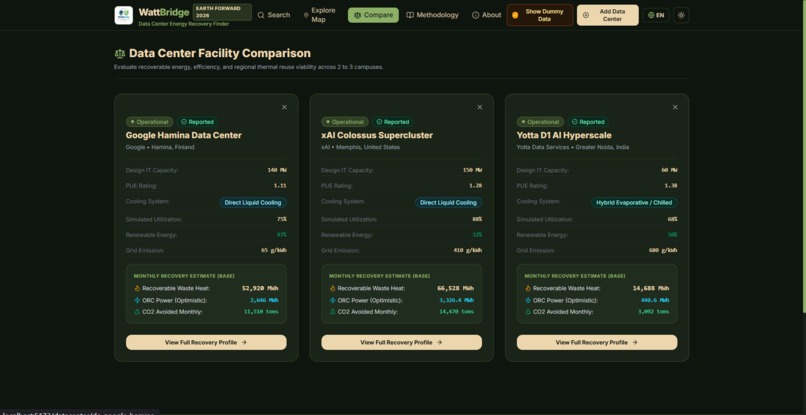
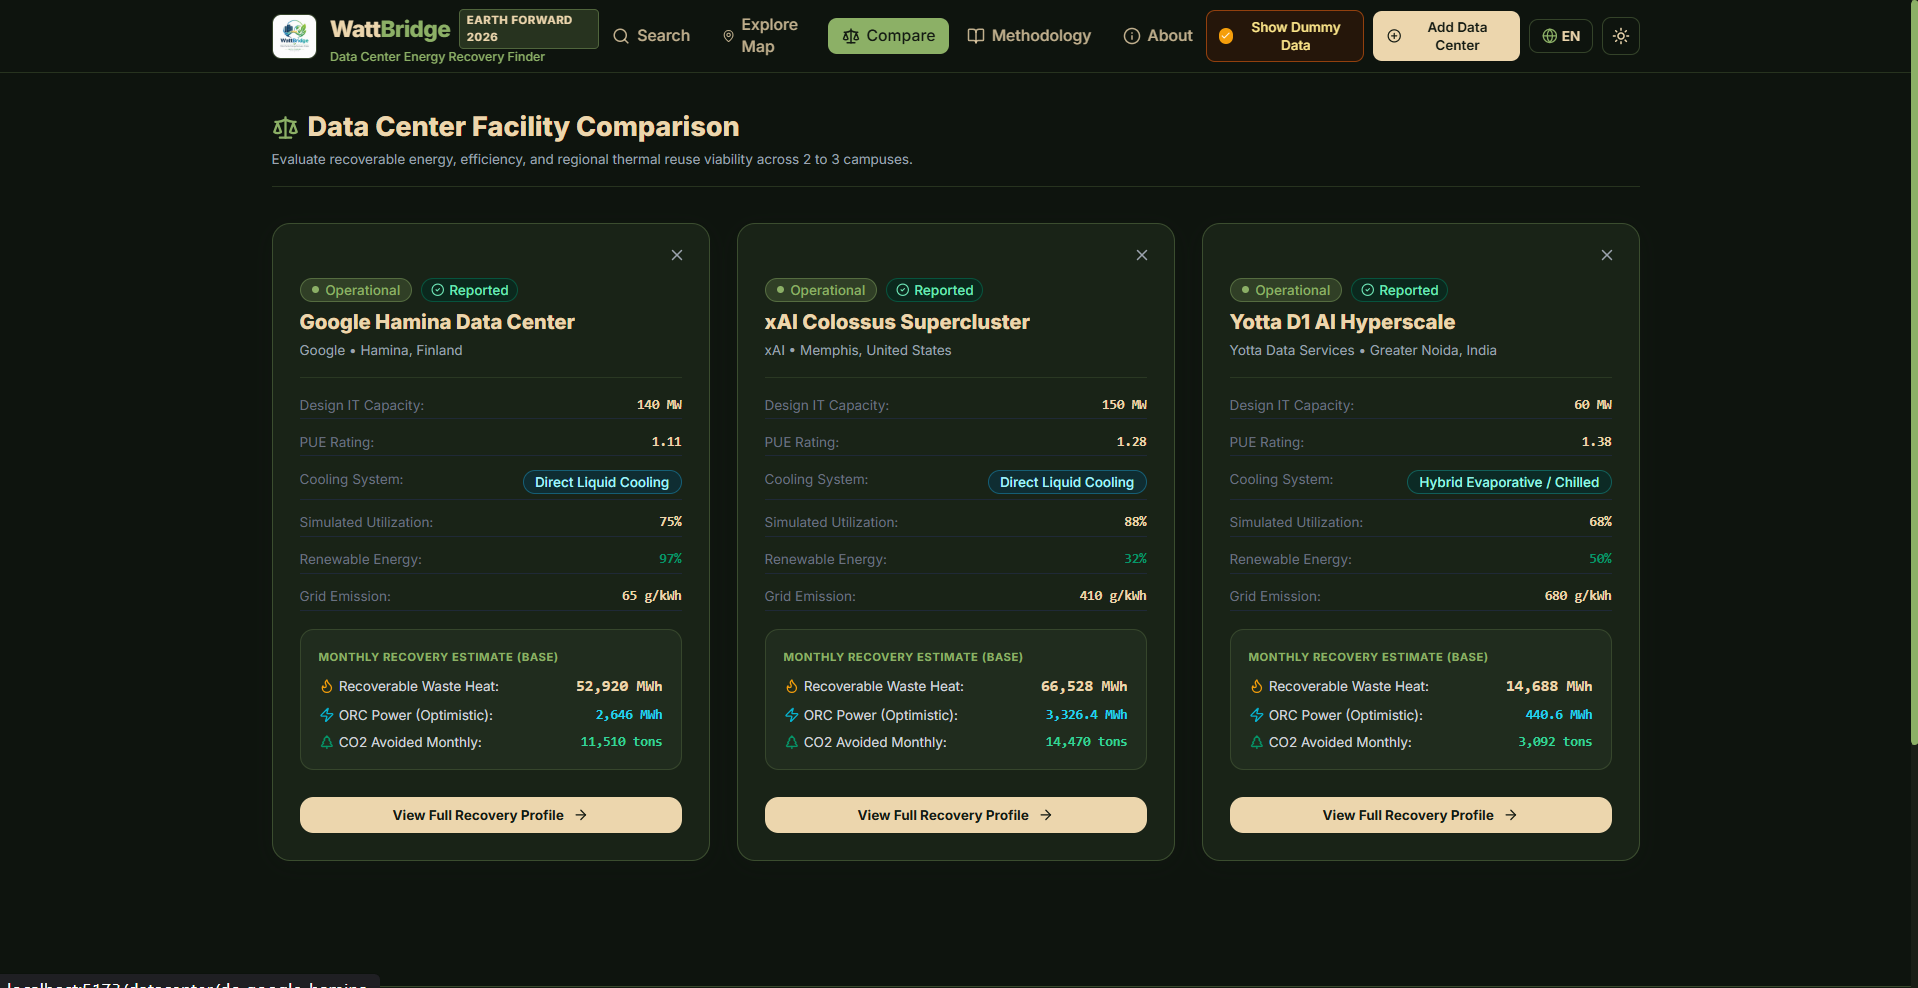
Data Center Facility Comparison tool evaluating efficiency, capacity, and monthly recovery estimates.
-
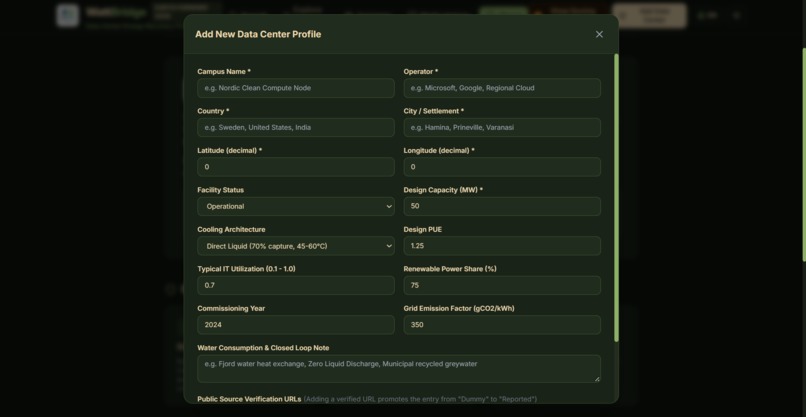
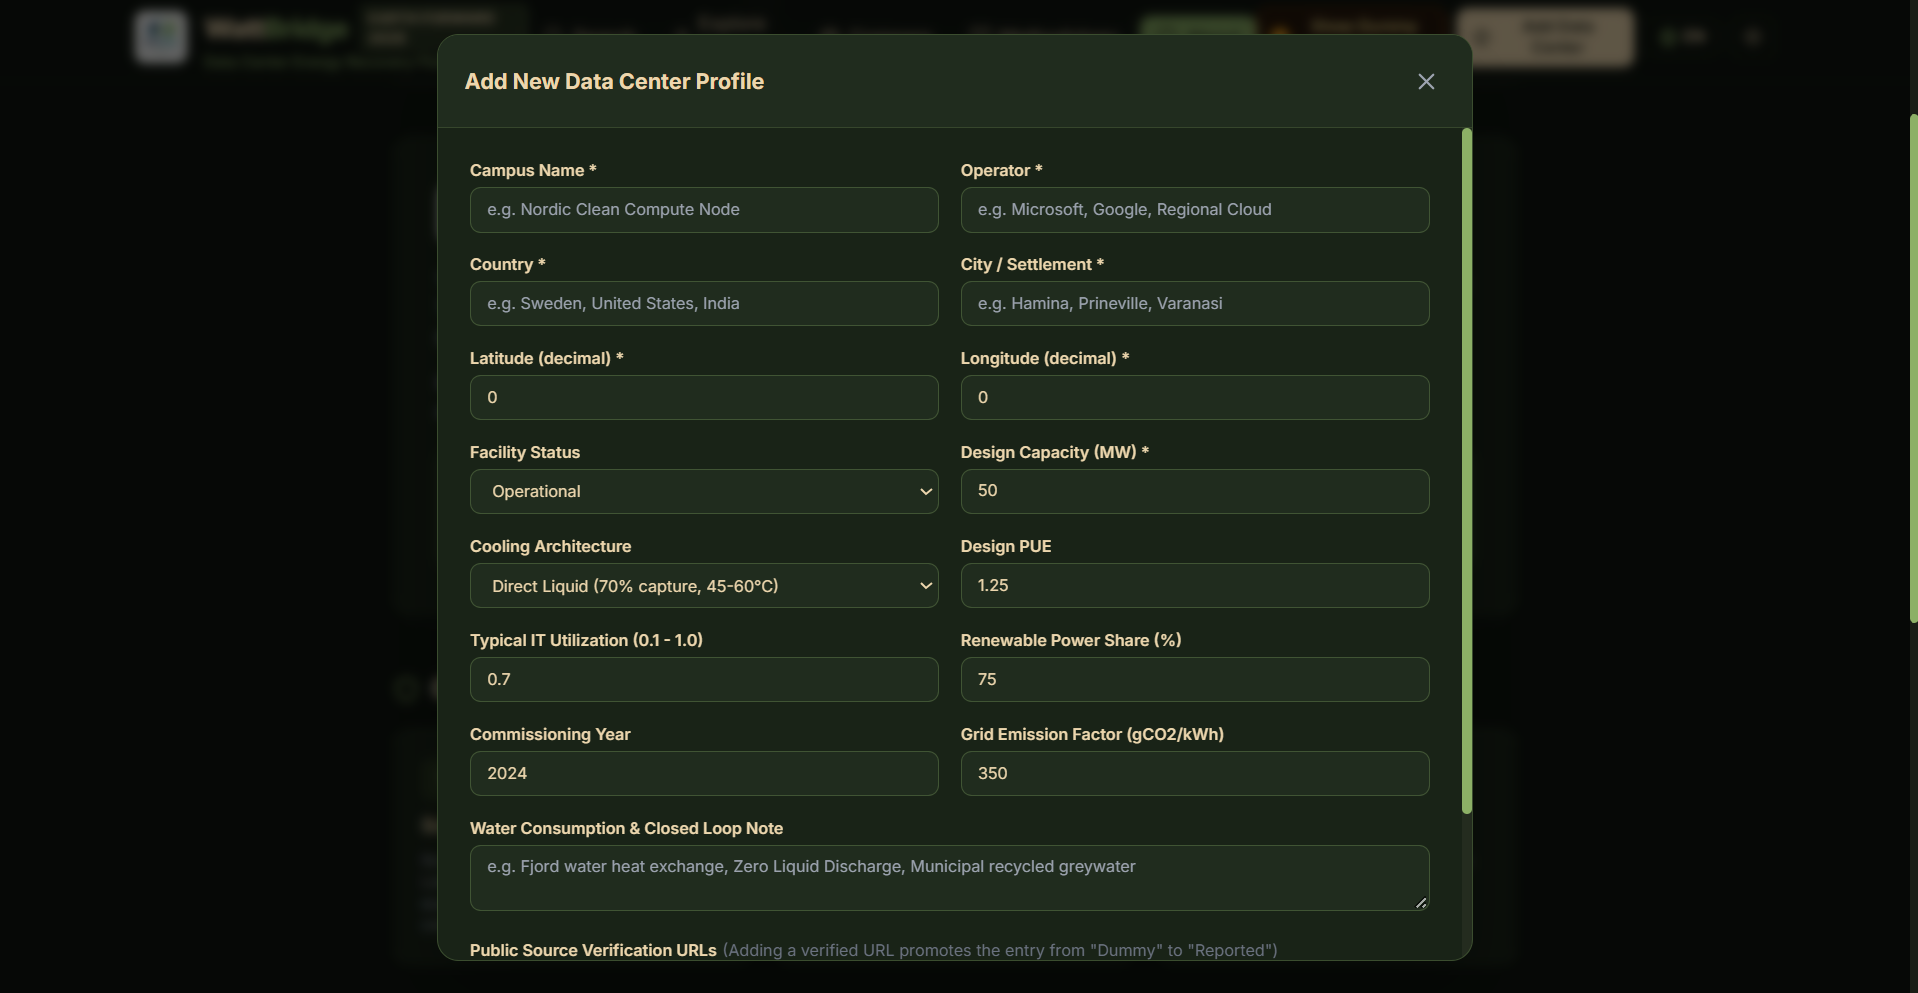
Add New Data Center Profile form to input campus specs, PUE, cooling architecture, and verification URLs.
-
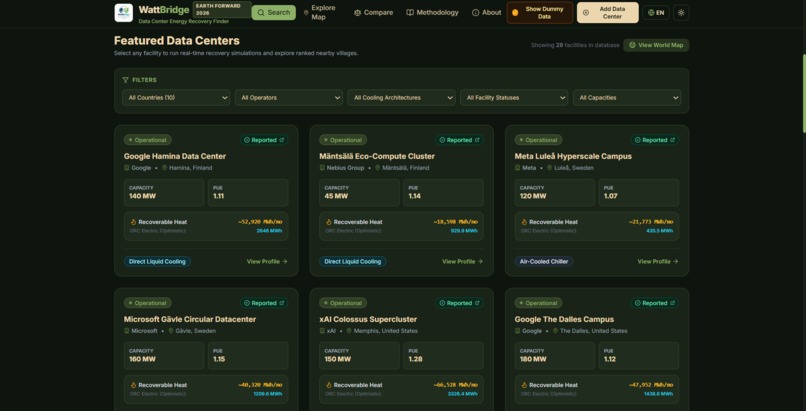
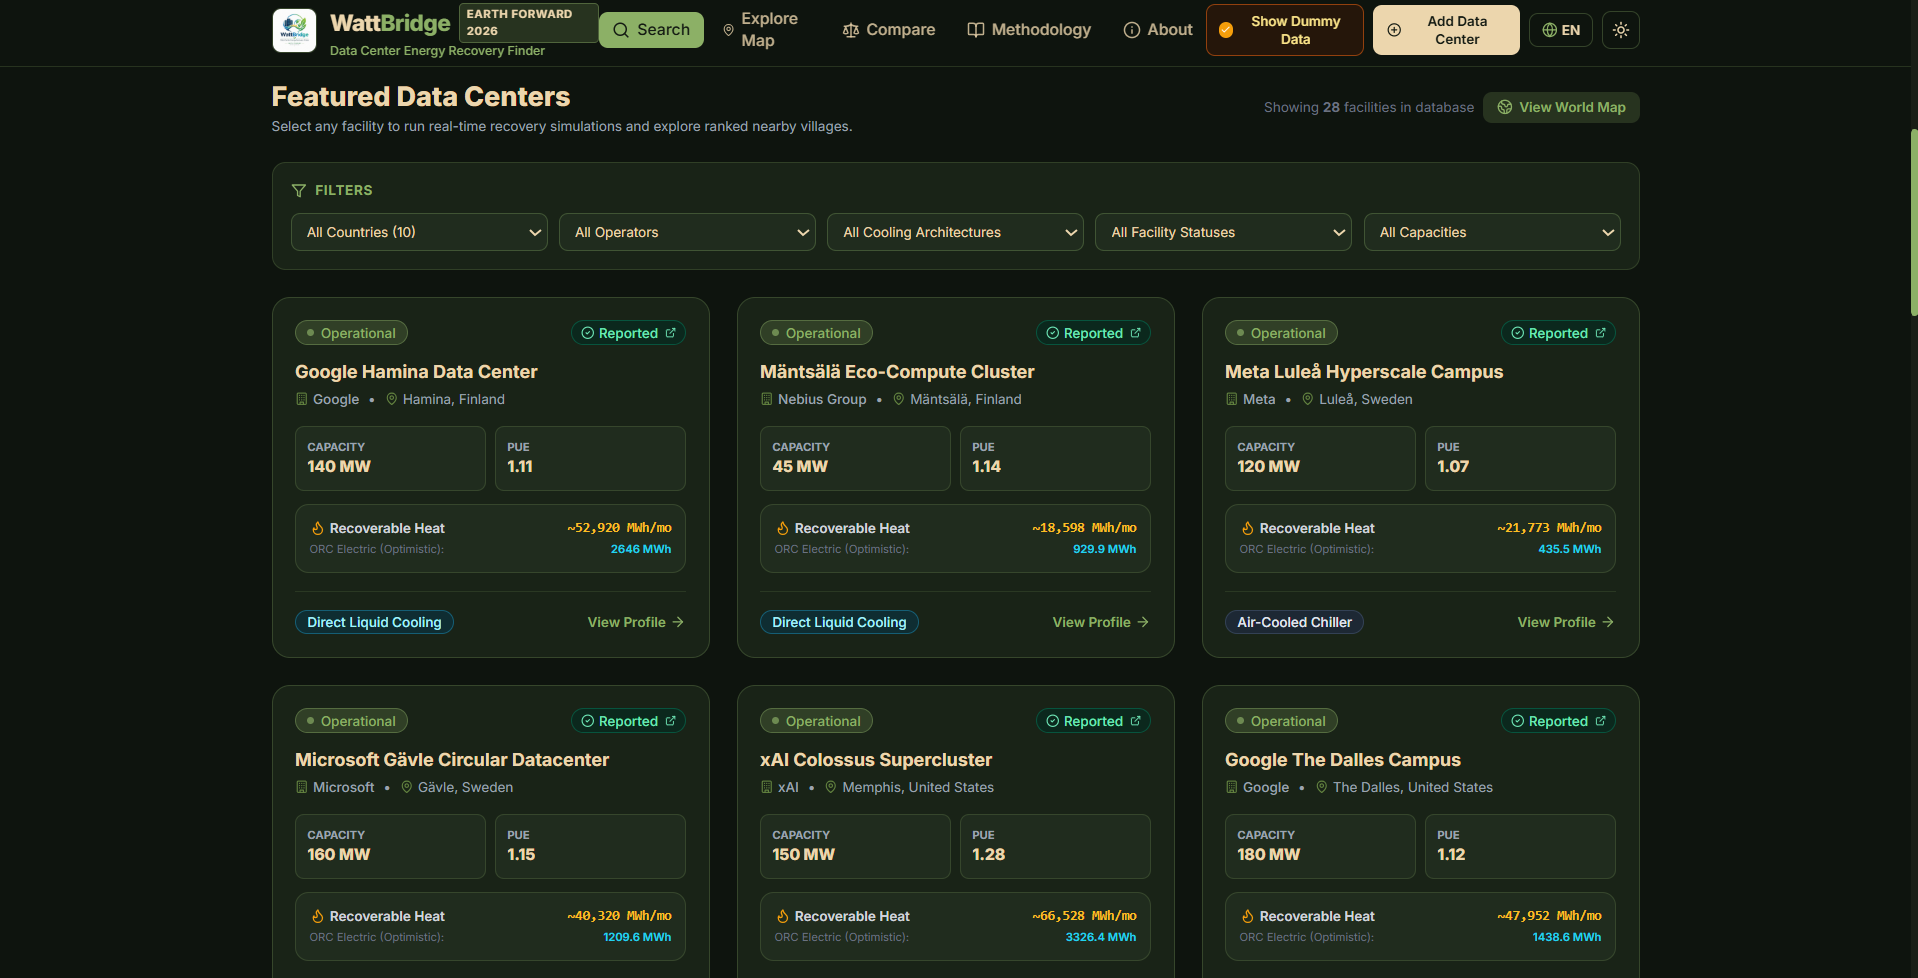
Featured Data Centers dashboard showing operational facilities, capacity, PUE ratings, and recoverable heat.
-
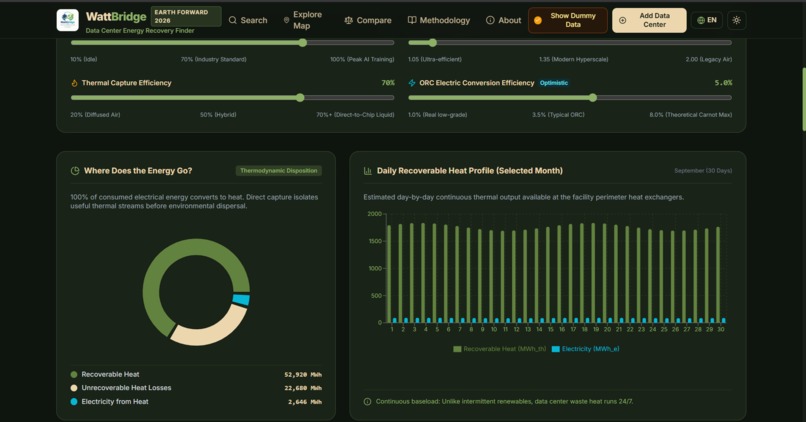
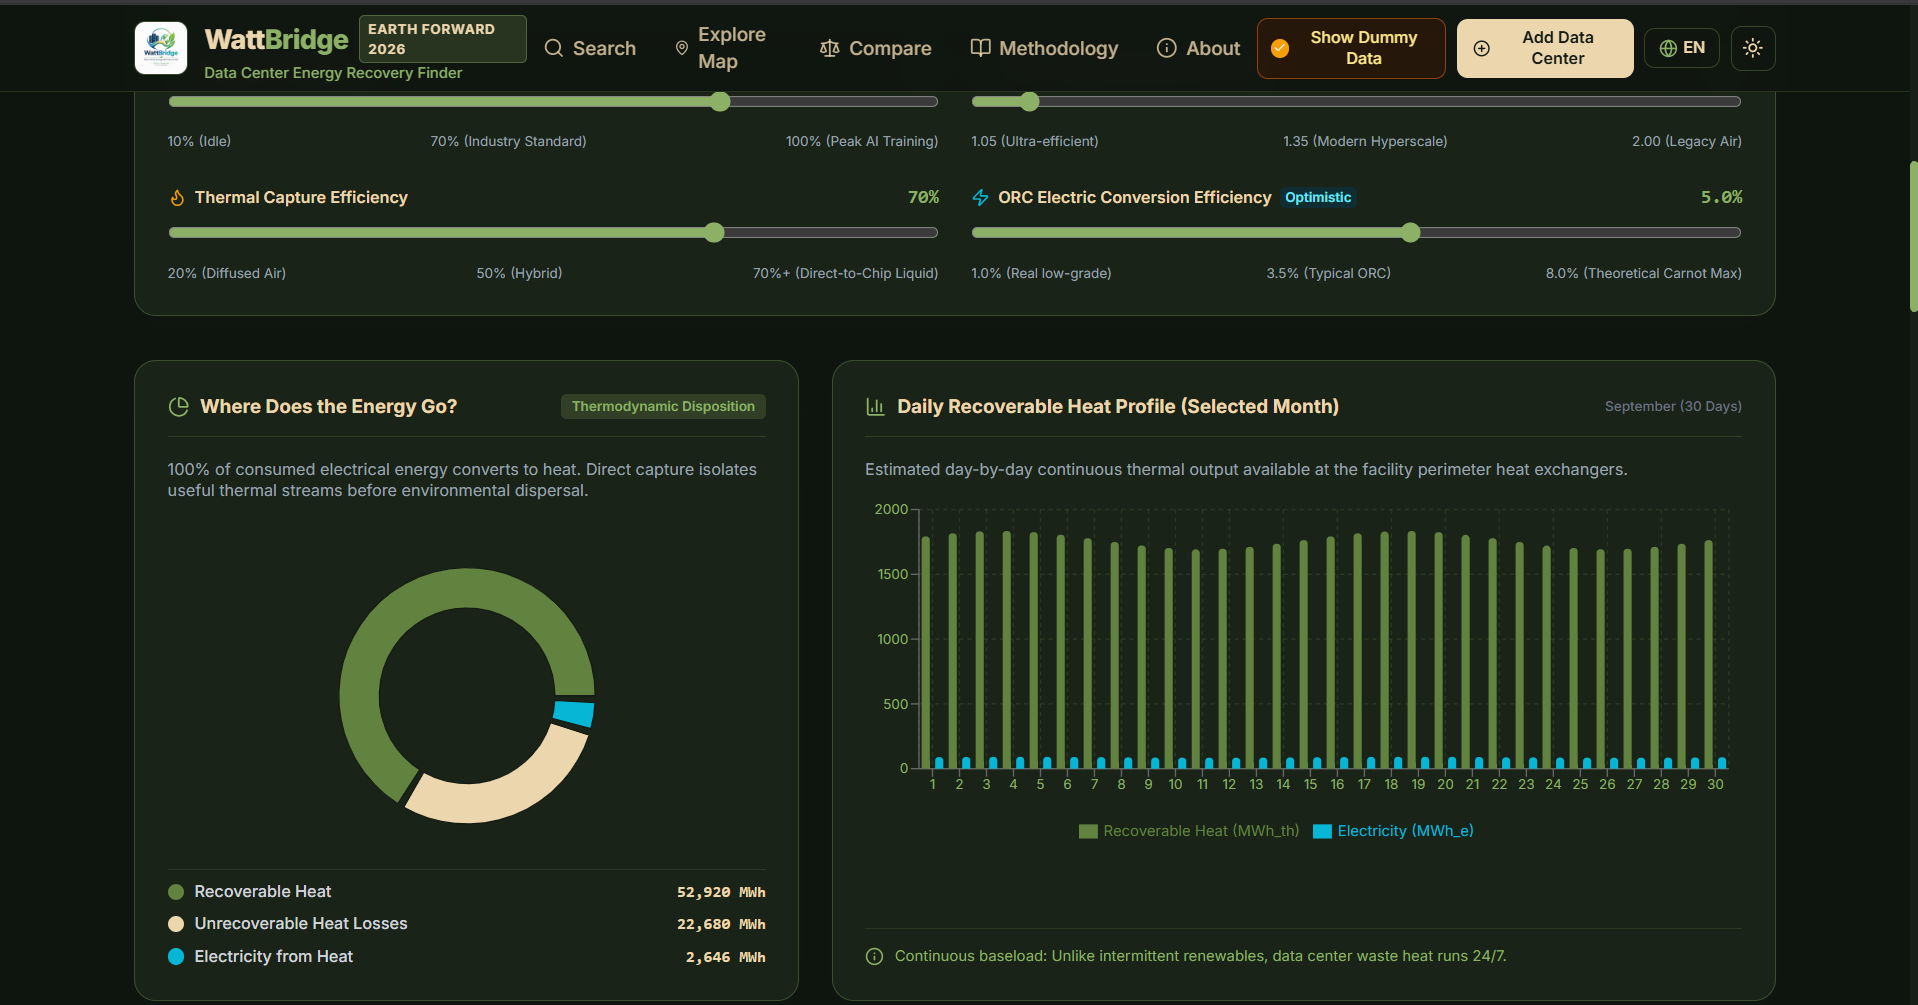
Simulation charts detailing thermodynamic energy disposition and daily recoverable heat profile for September.
-
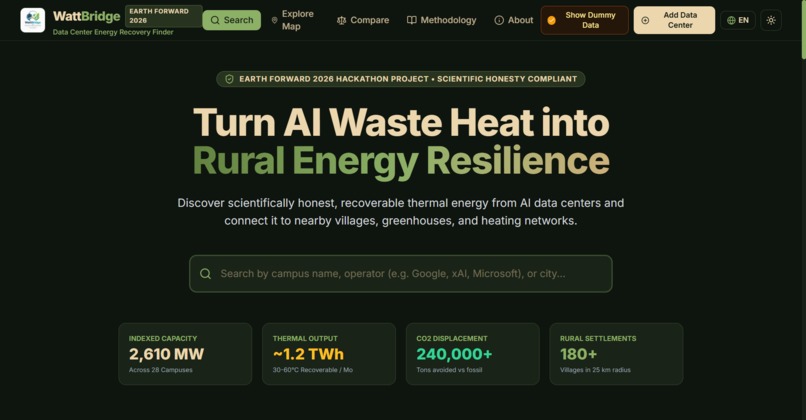
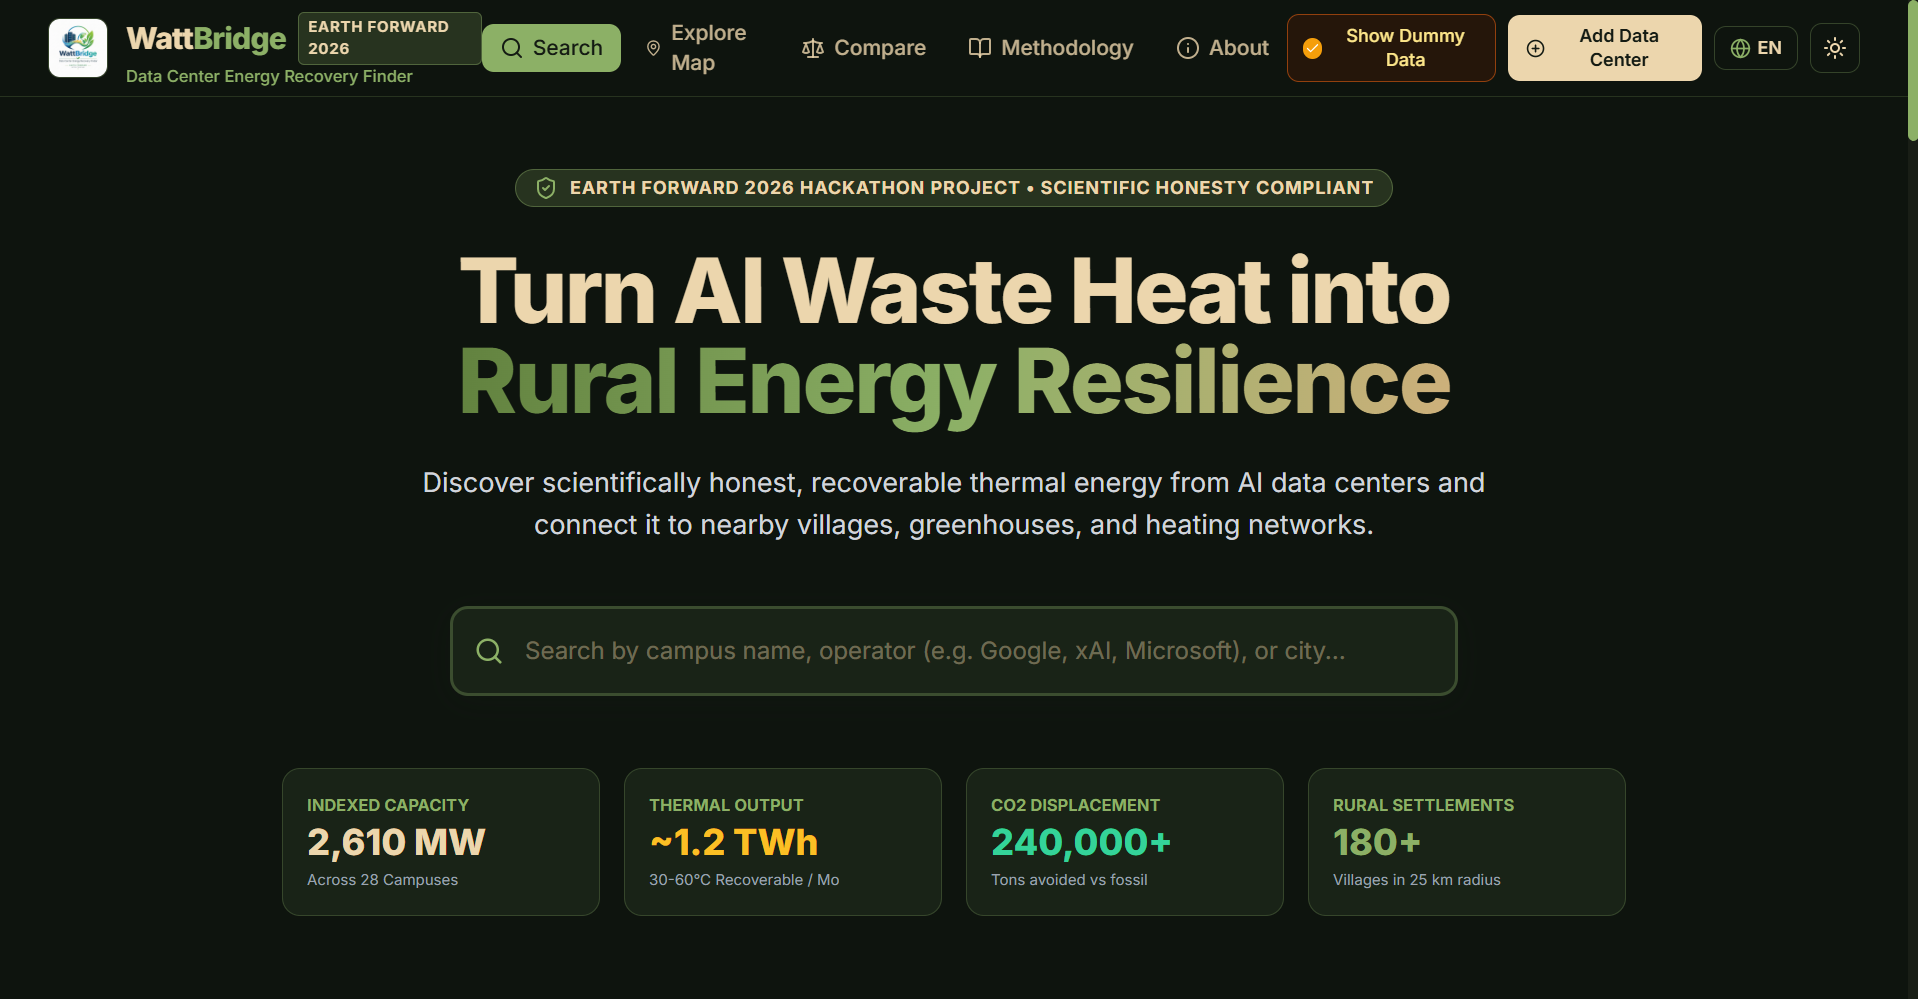
WattBridge homepage: Turn AI waste heat into rural energy resilience with data center thermal recovery.
-
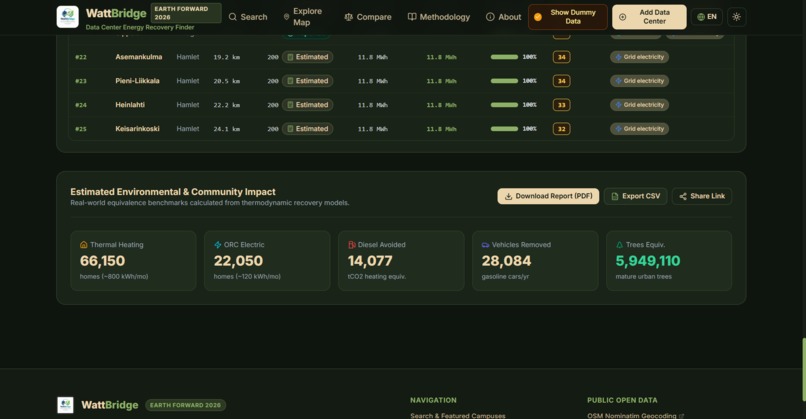
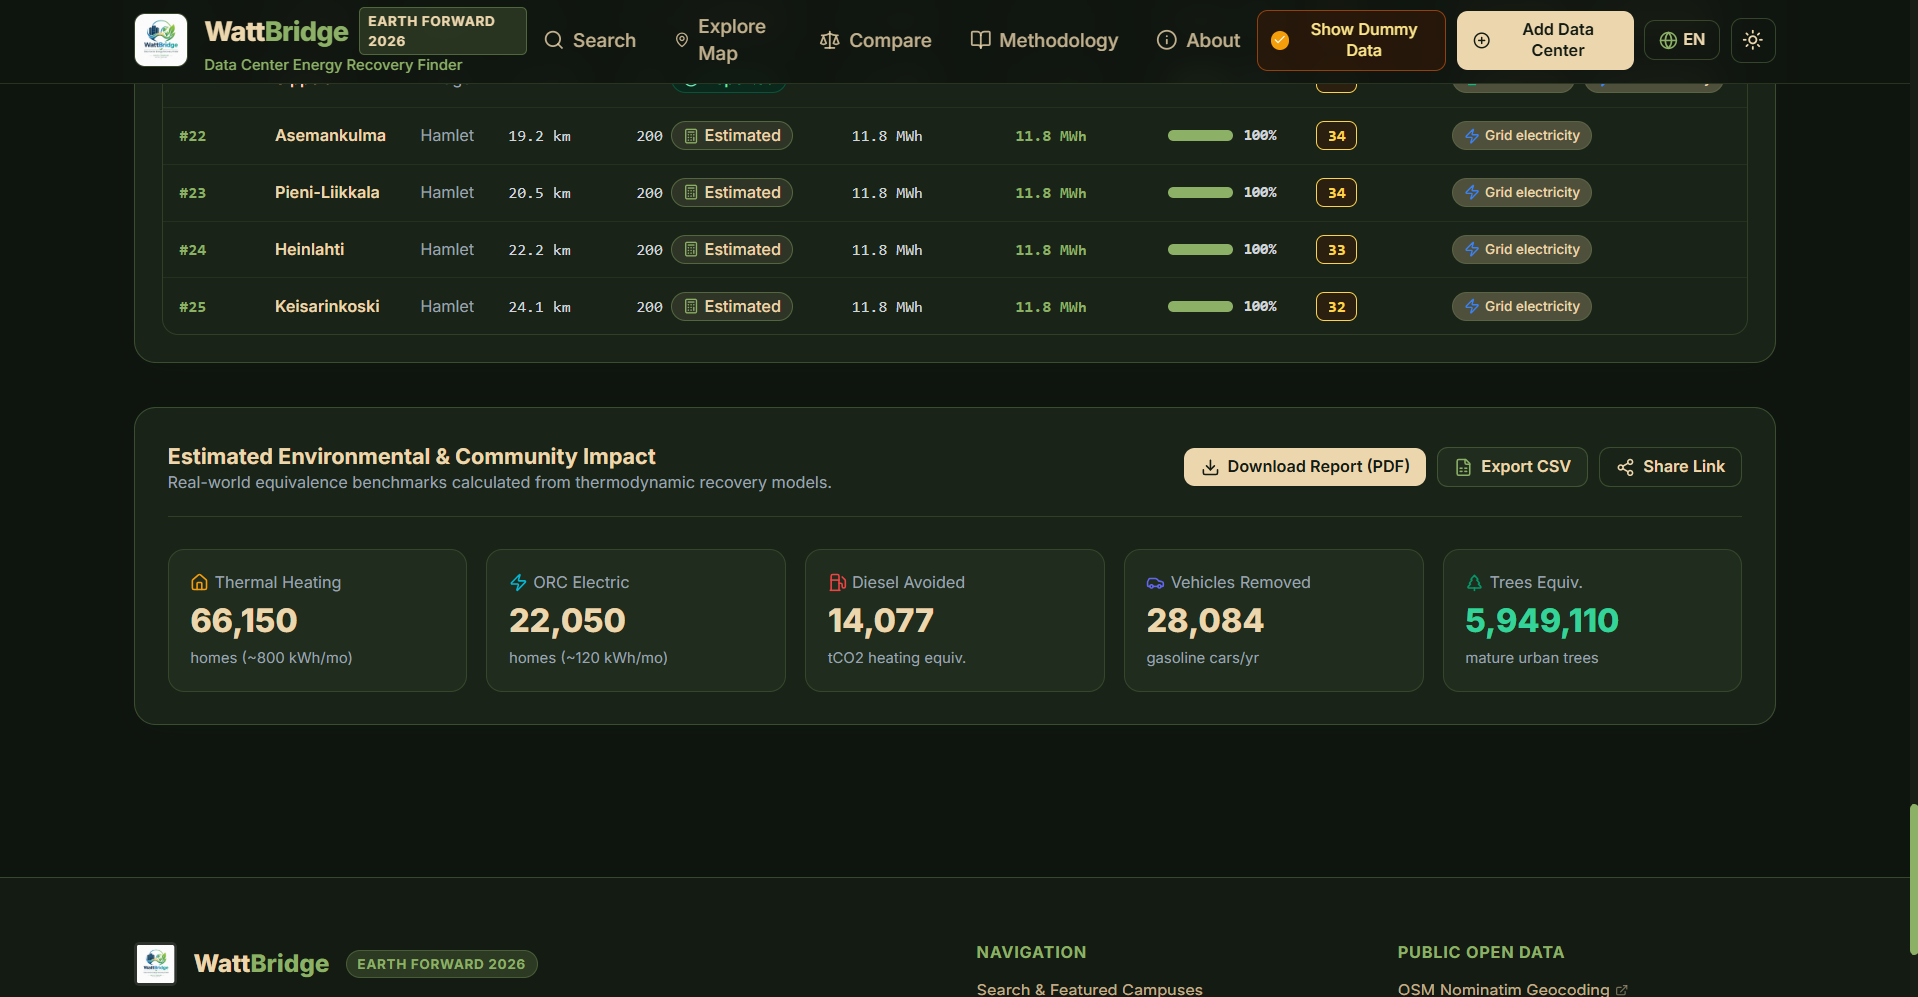
Estimated environmental and community impact dashboard with equivalent homes heated and trees saved metrics.
-
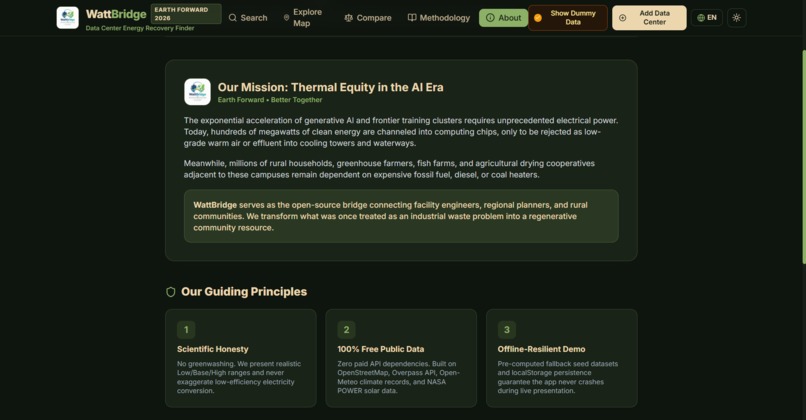
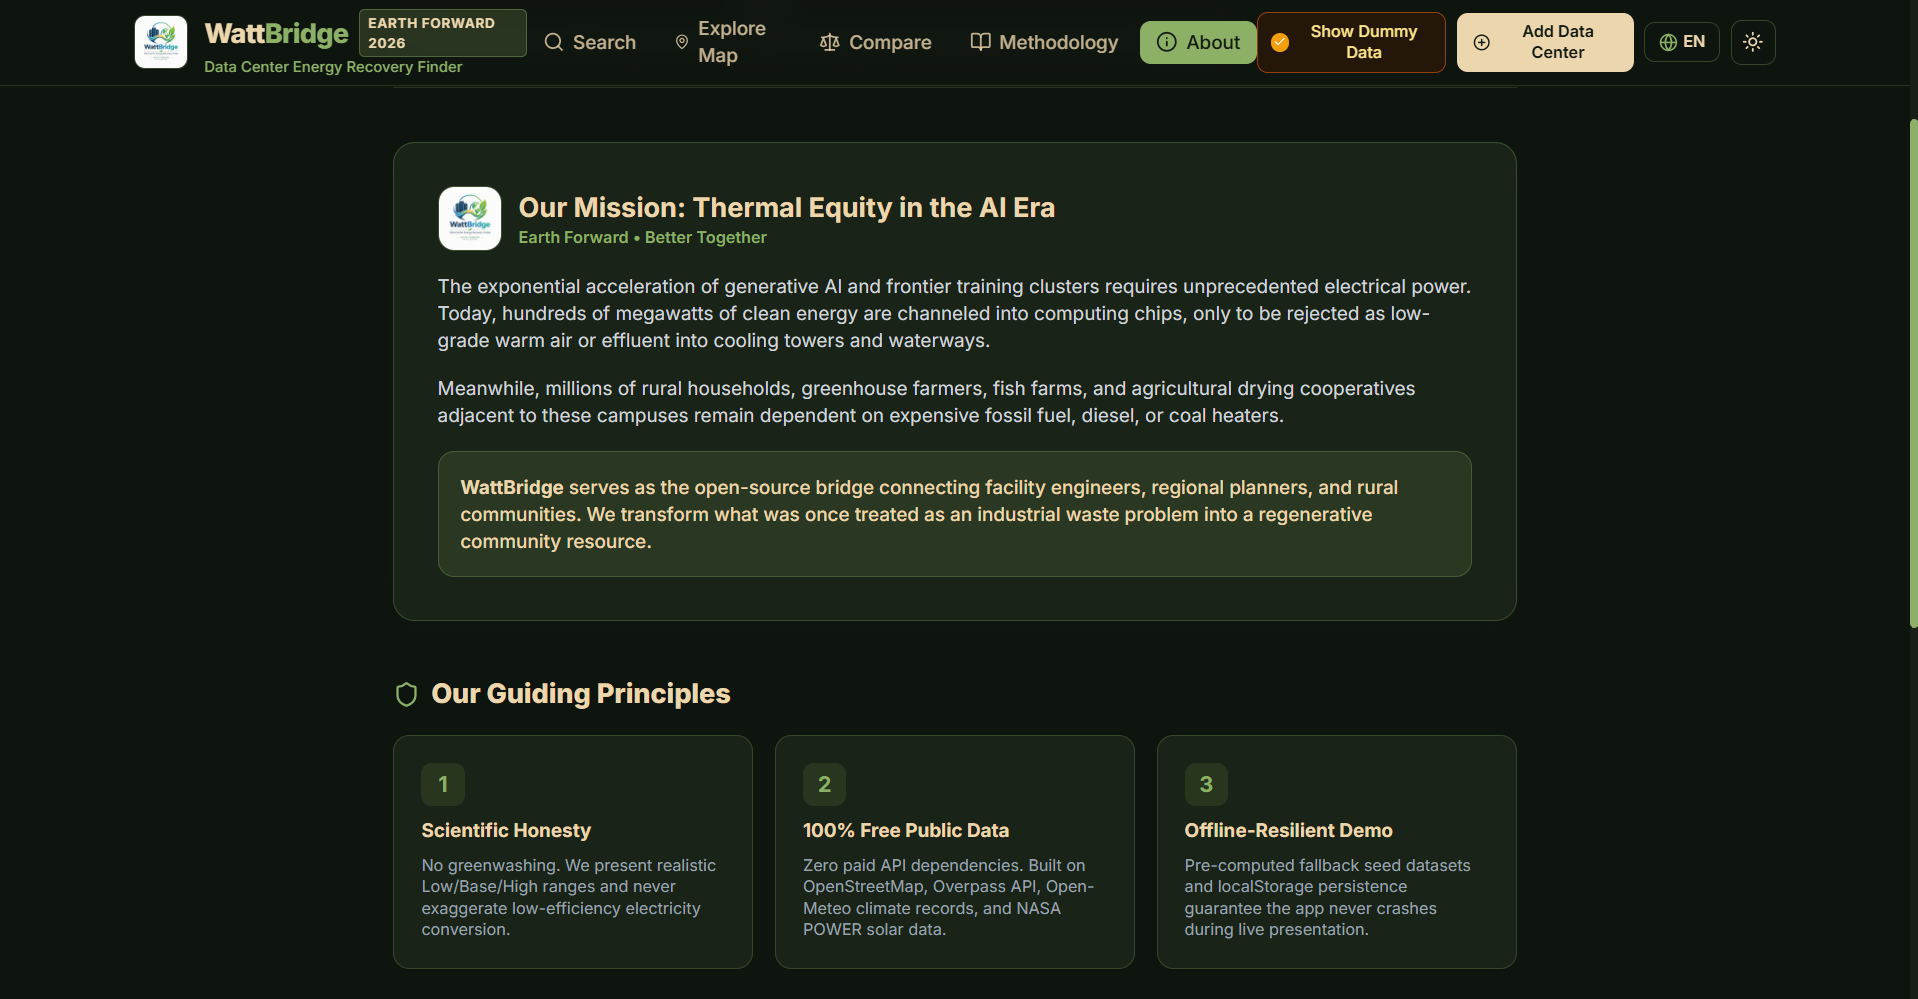
About page outlining WattBridge's mission for thermal equity in the AI era and core guiding principles.
-
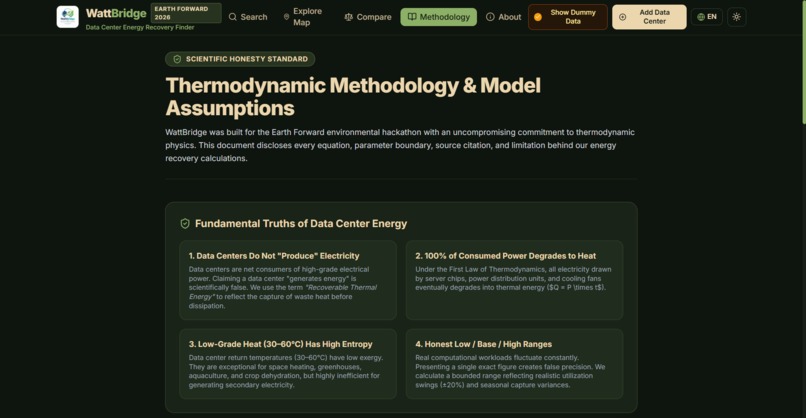
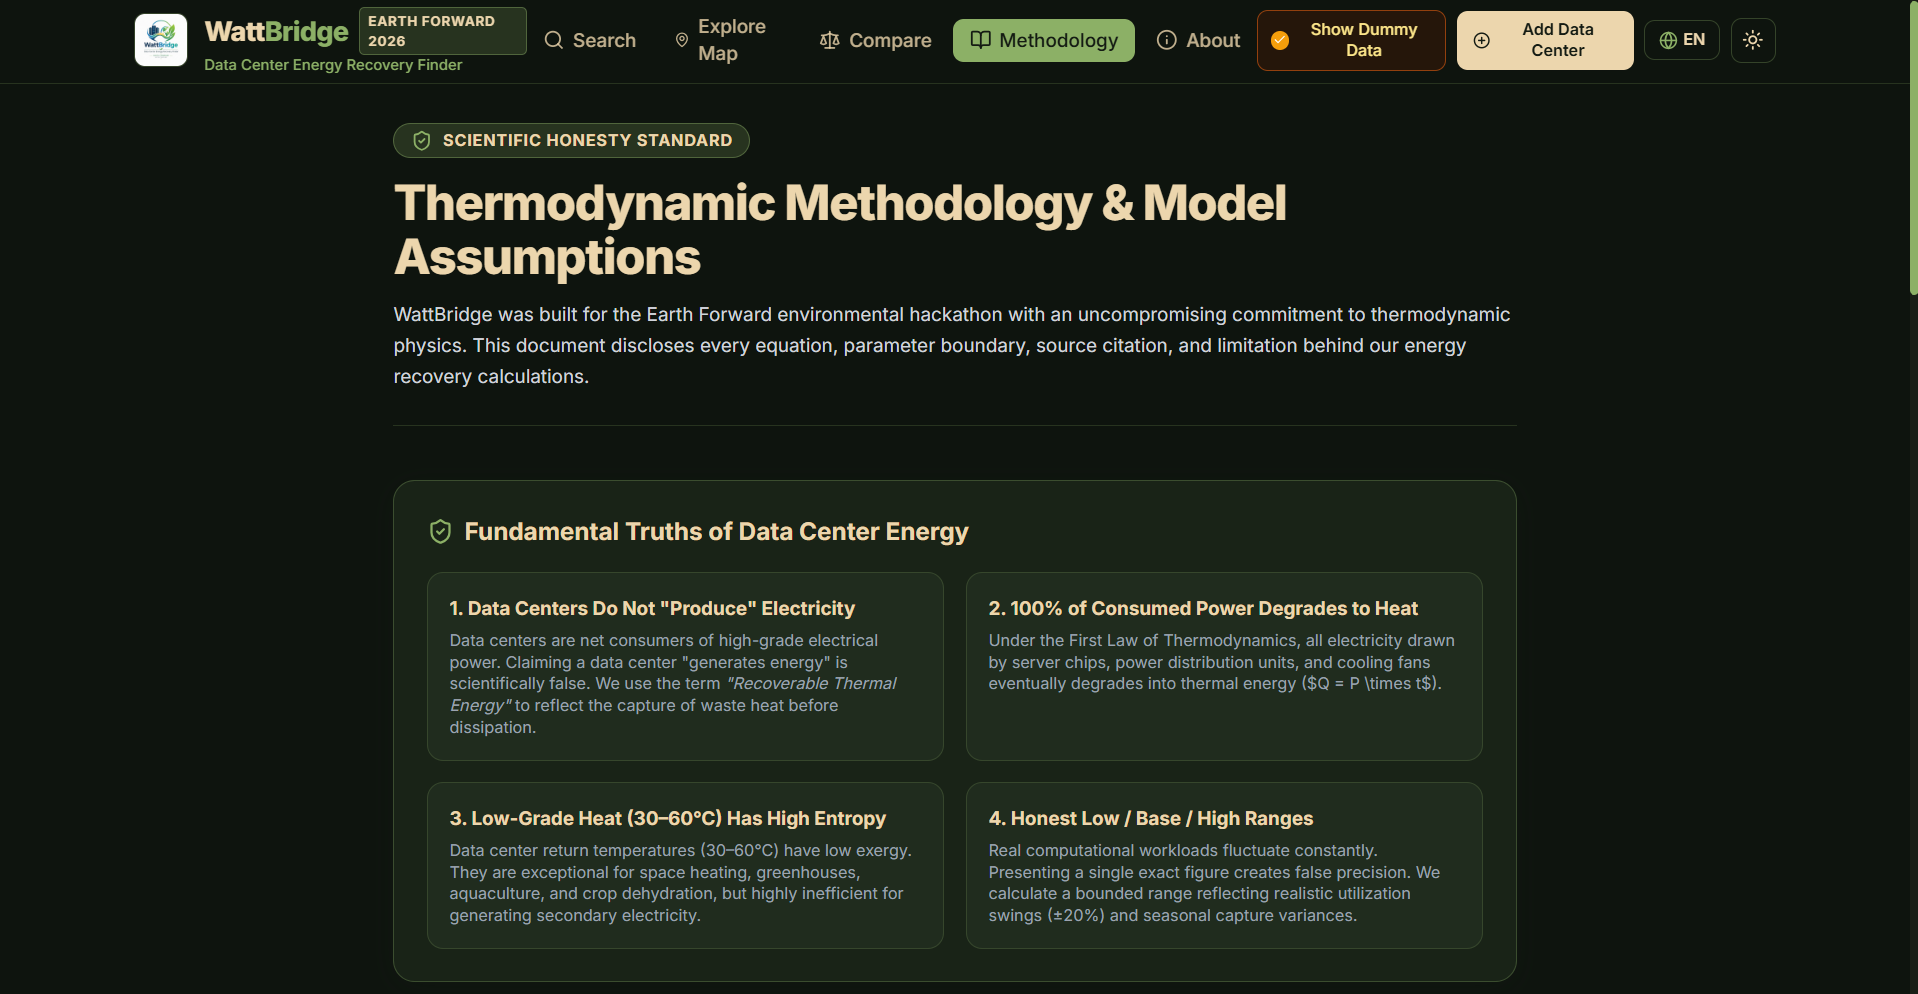
Thermodynamic methodology page detailing fundamental physics, low-grade heat entropy, and model assumptions.
-
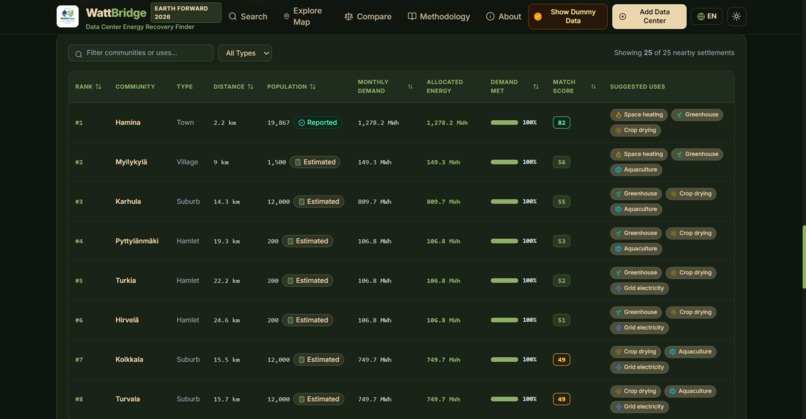
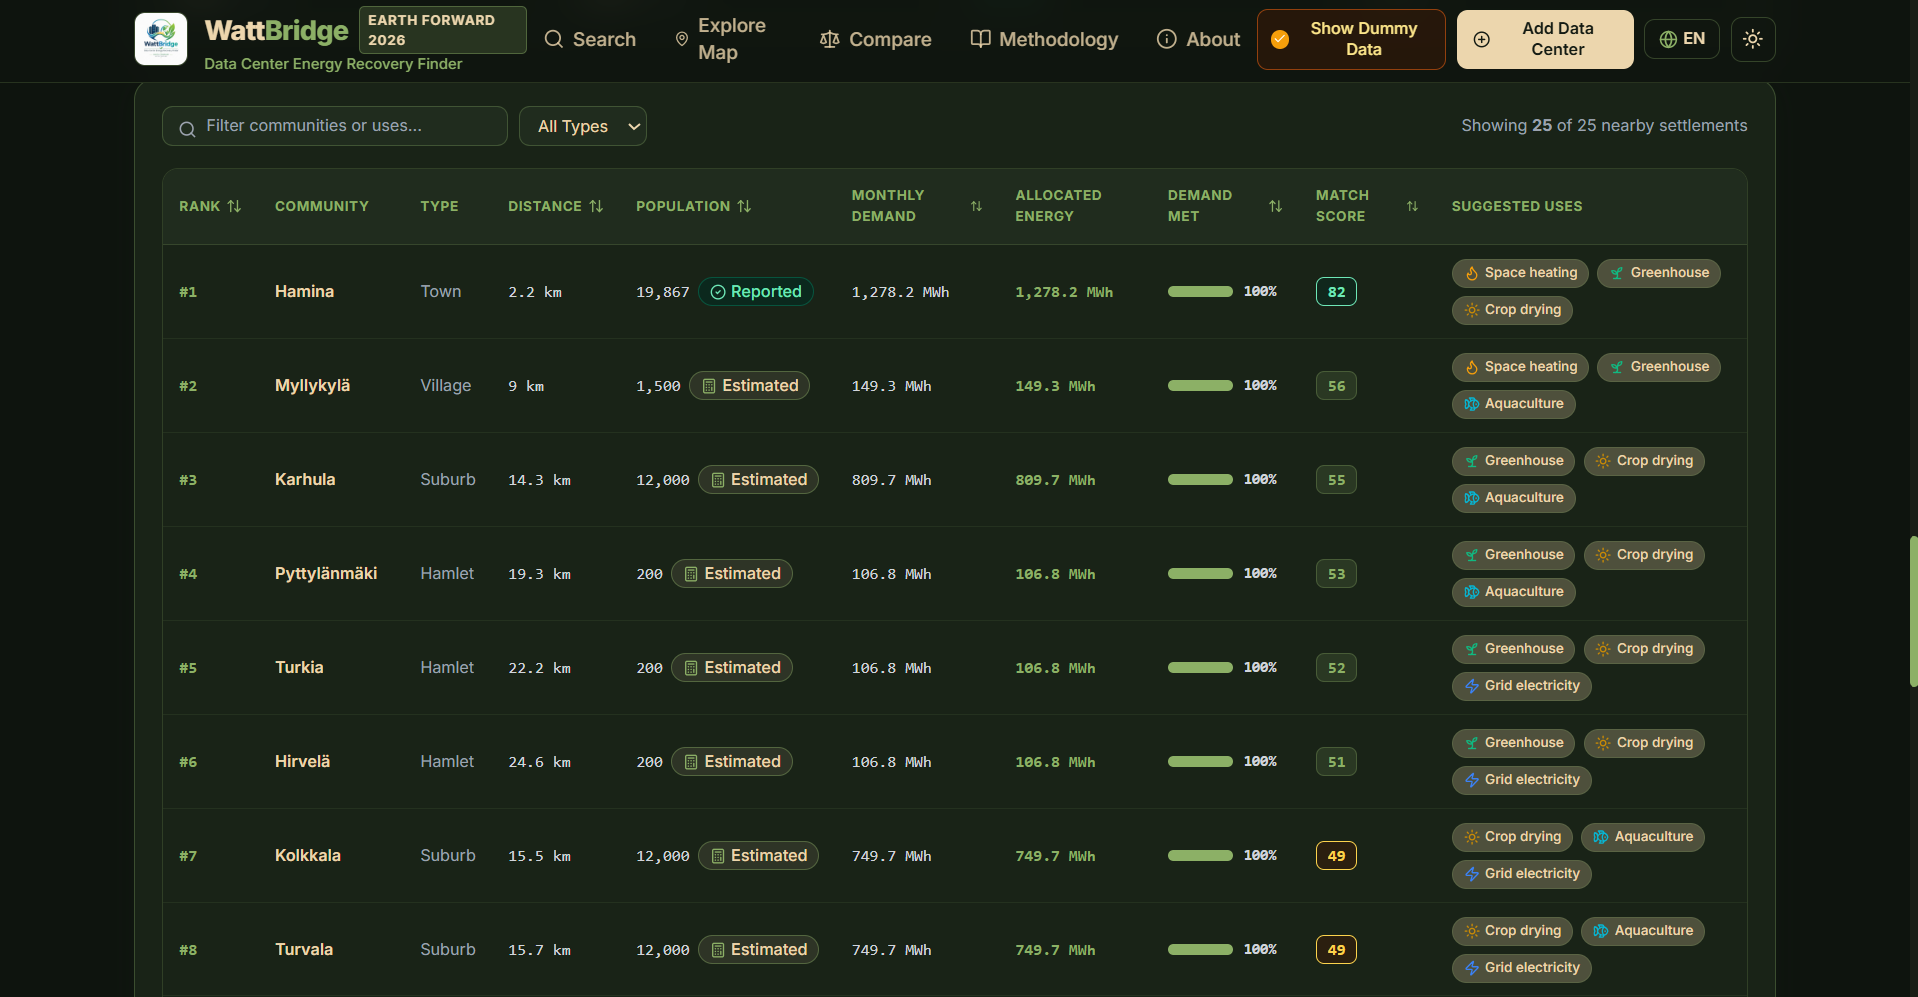
Detailed table of 25 nearby settlements ranked by distance, population, monthly demand, and match score.
-
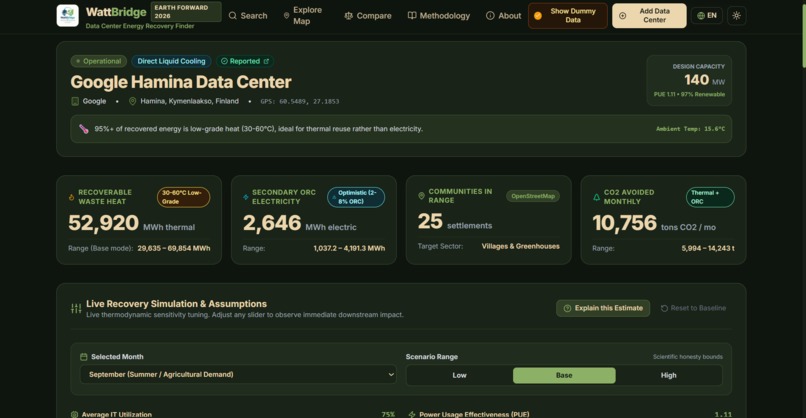
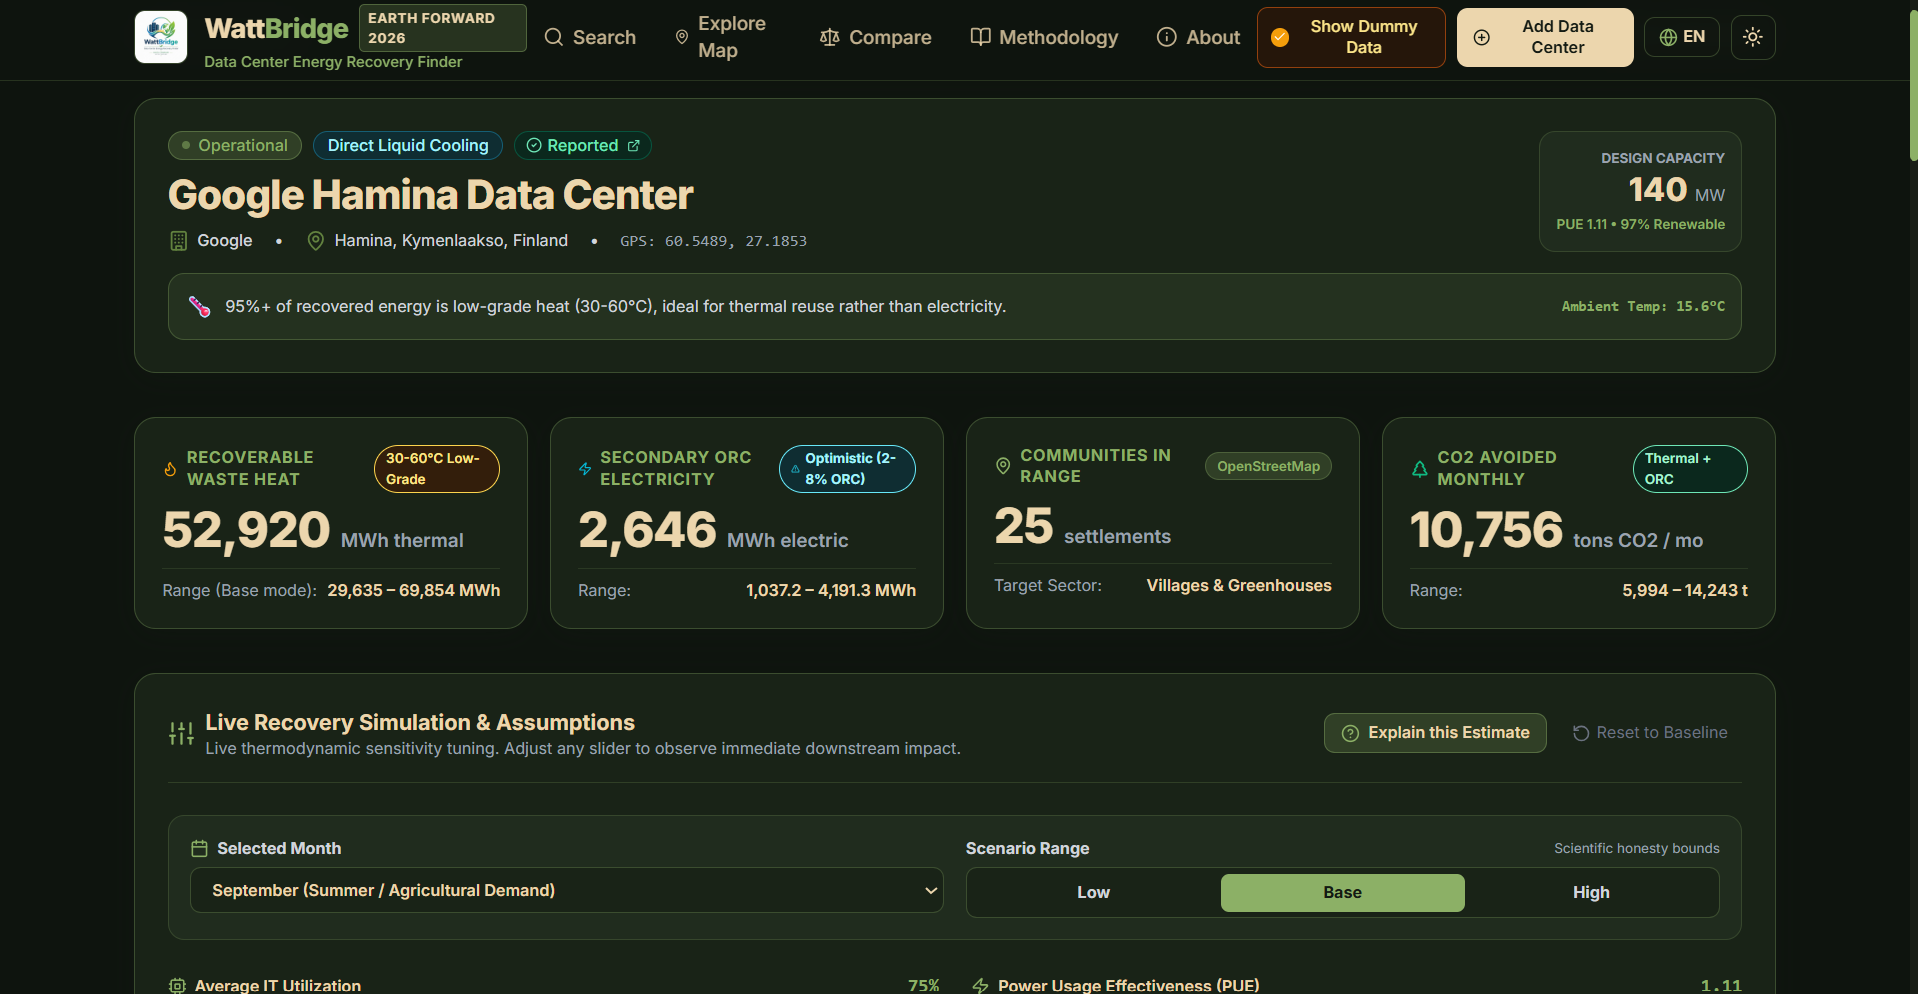
Google Hamina Data Center profile showing recoverable waste heat, monthly CO2 avoidance, and live simulation controls.
-
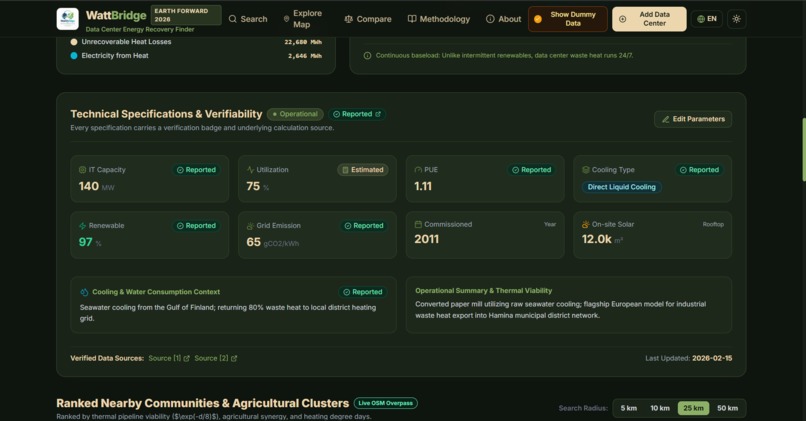
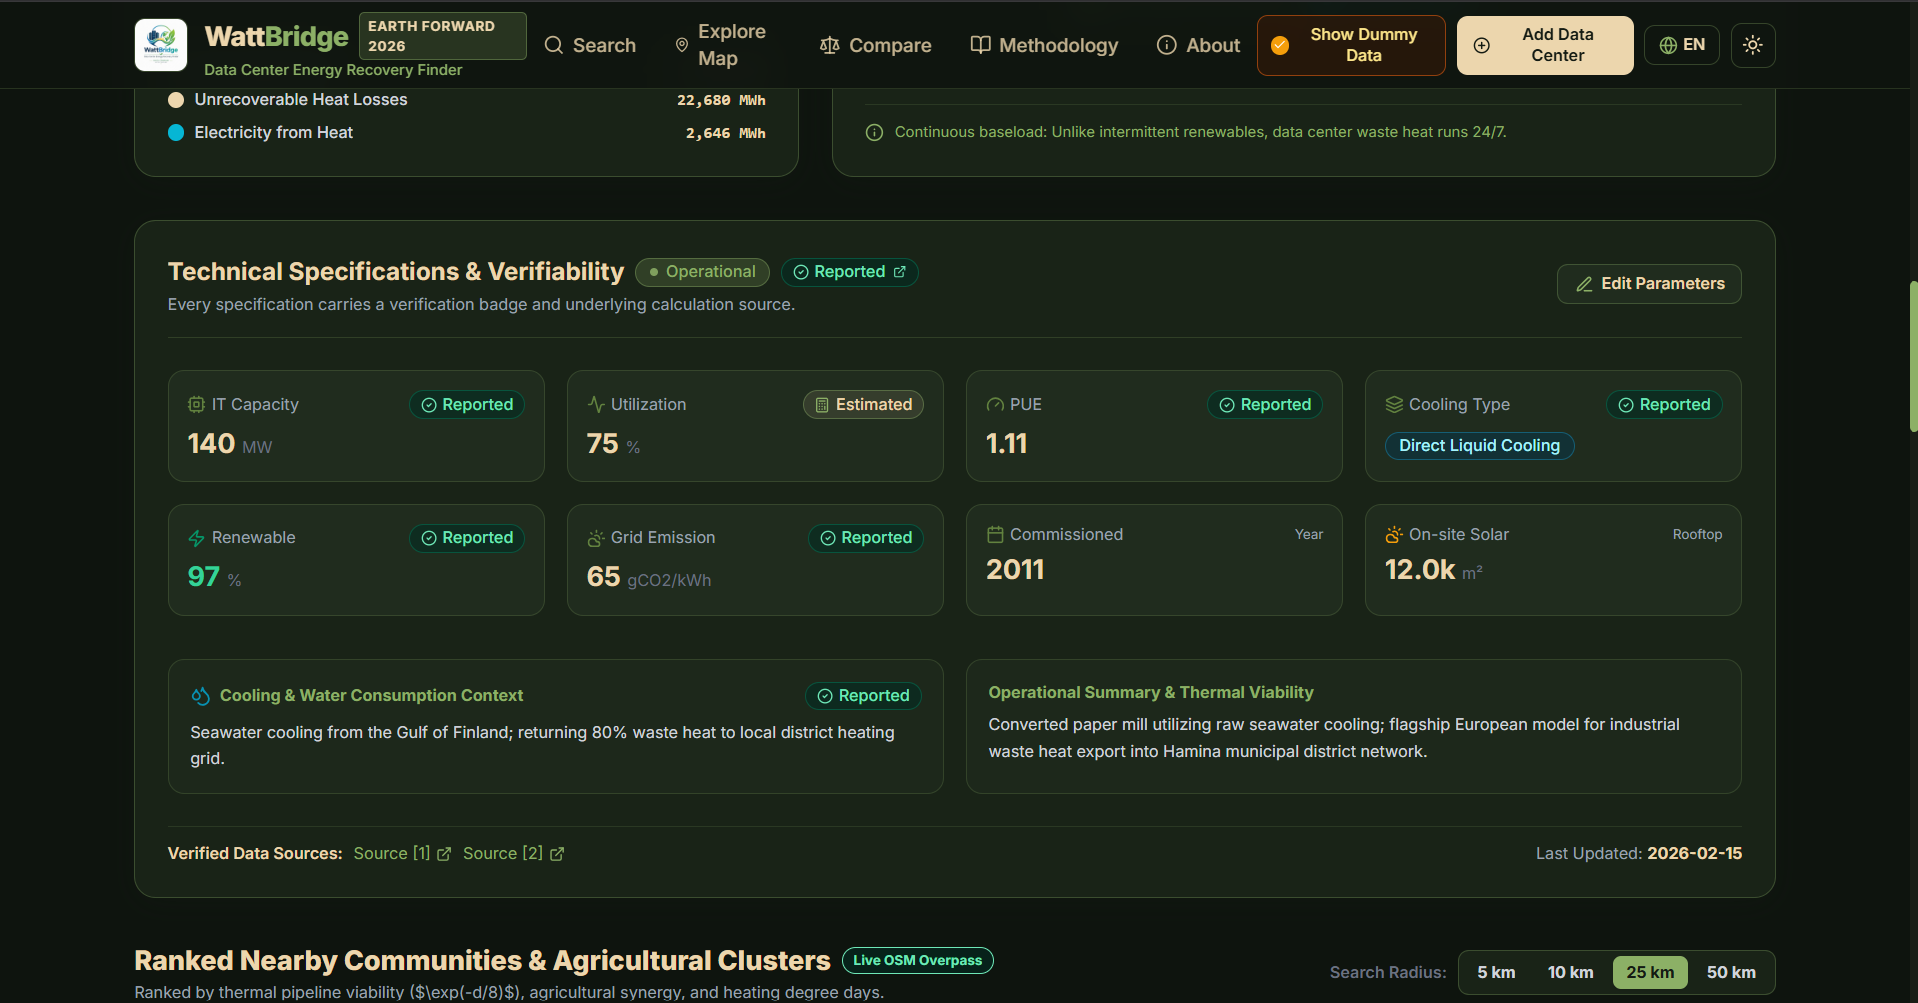
Verified technical specs for Google Hamina, including 140 MW IT capacity, PUE 1.11, and seawater cooling.
-
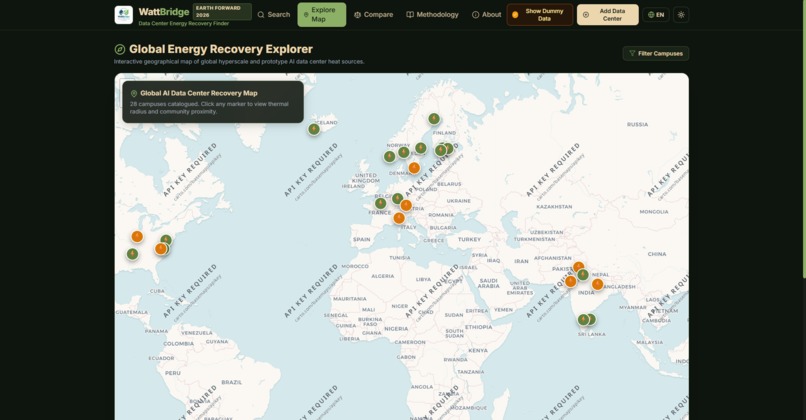
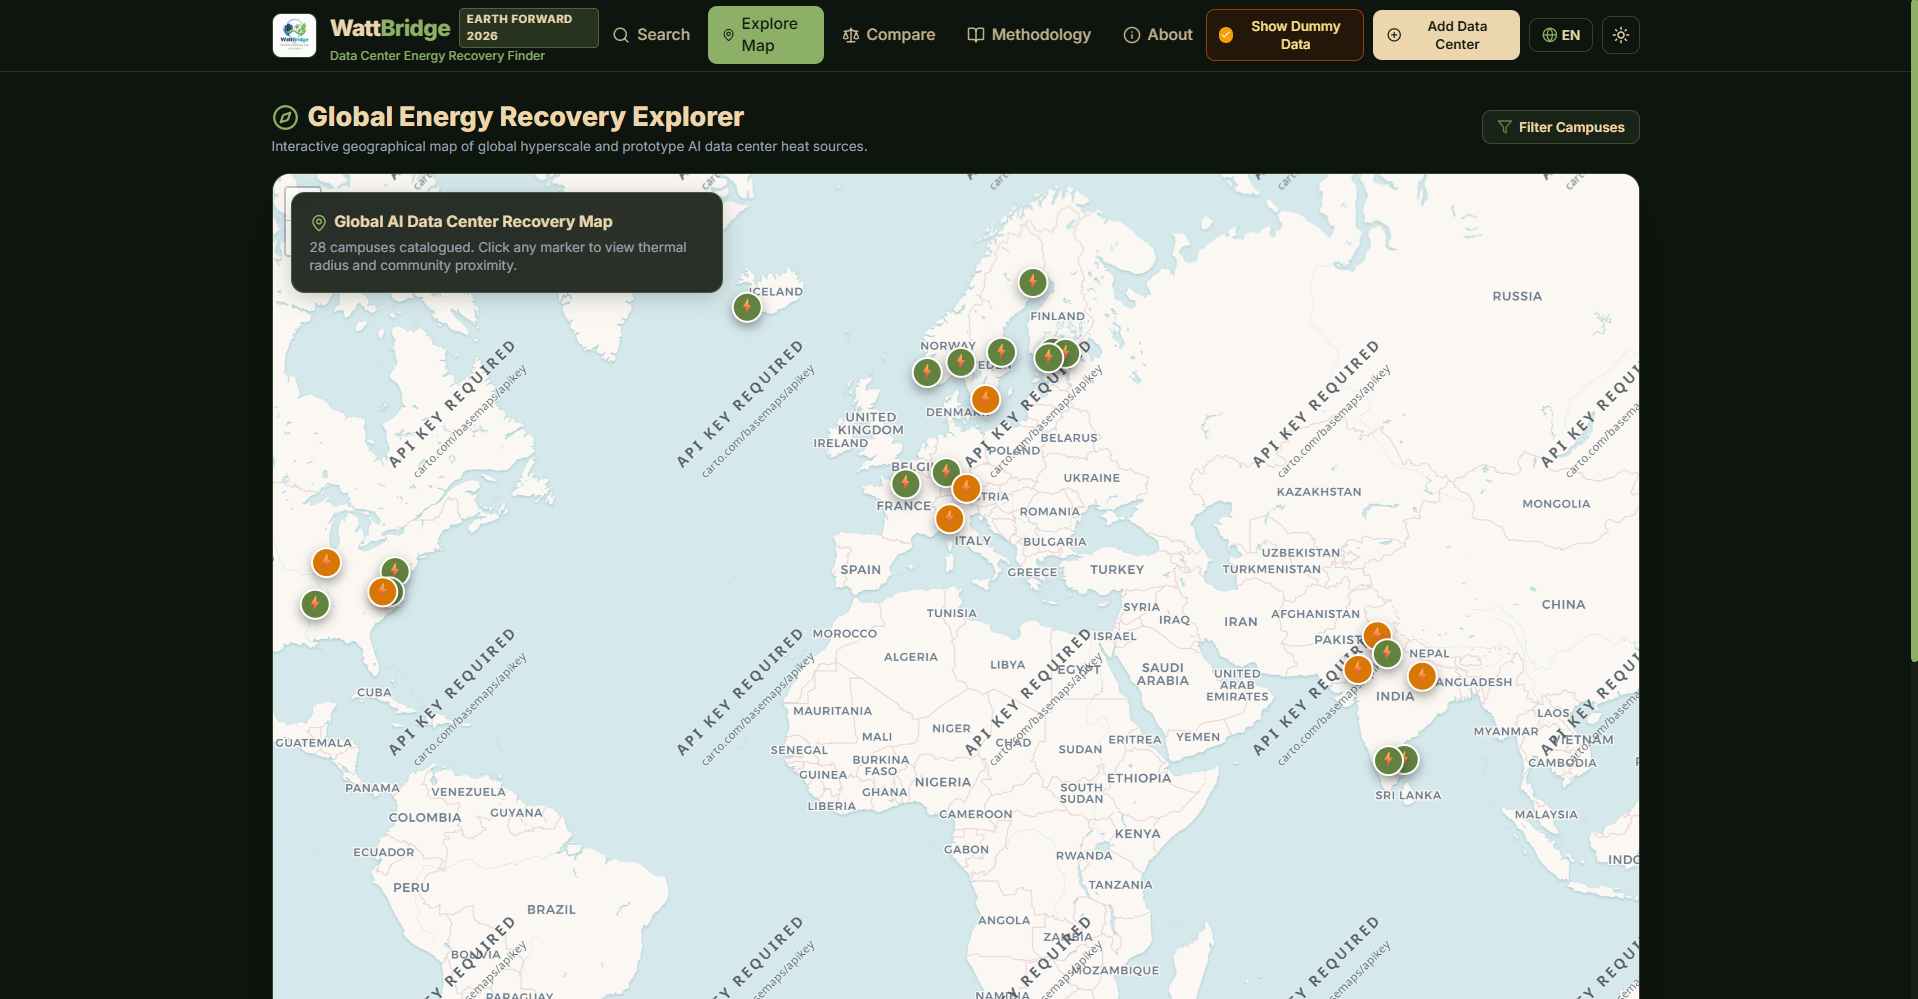
Global Energy Recovery Explorer interactive map displaying cataloged AI data center heat source markers.
-
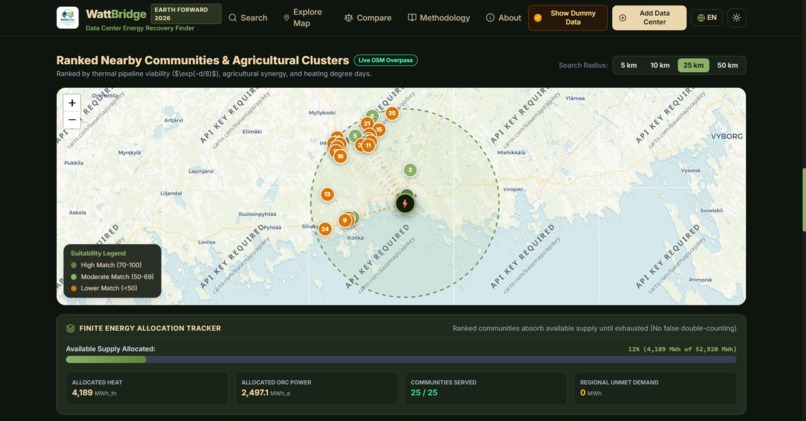
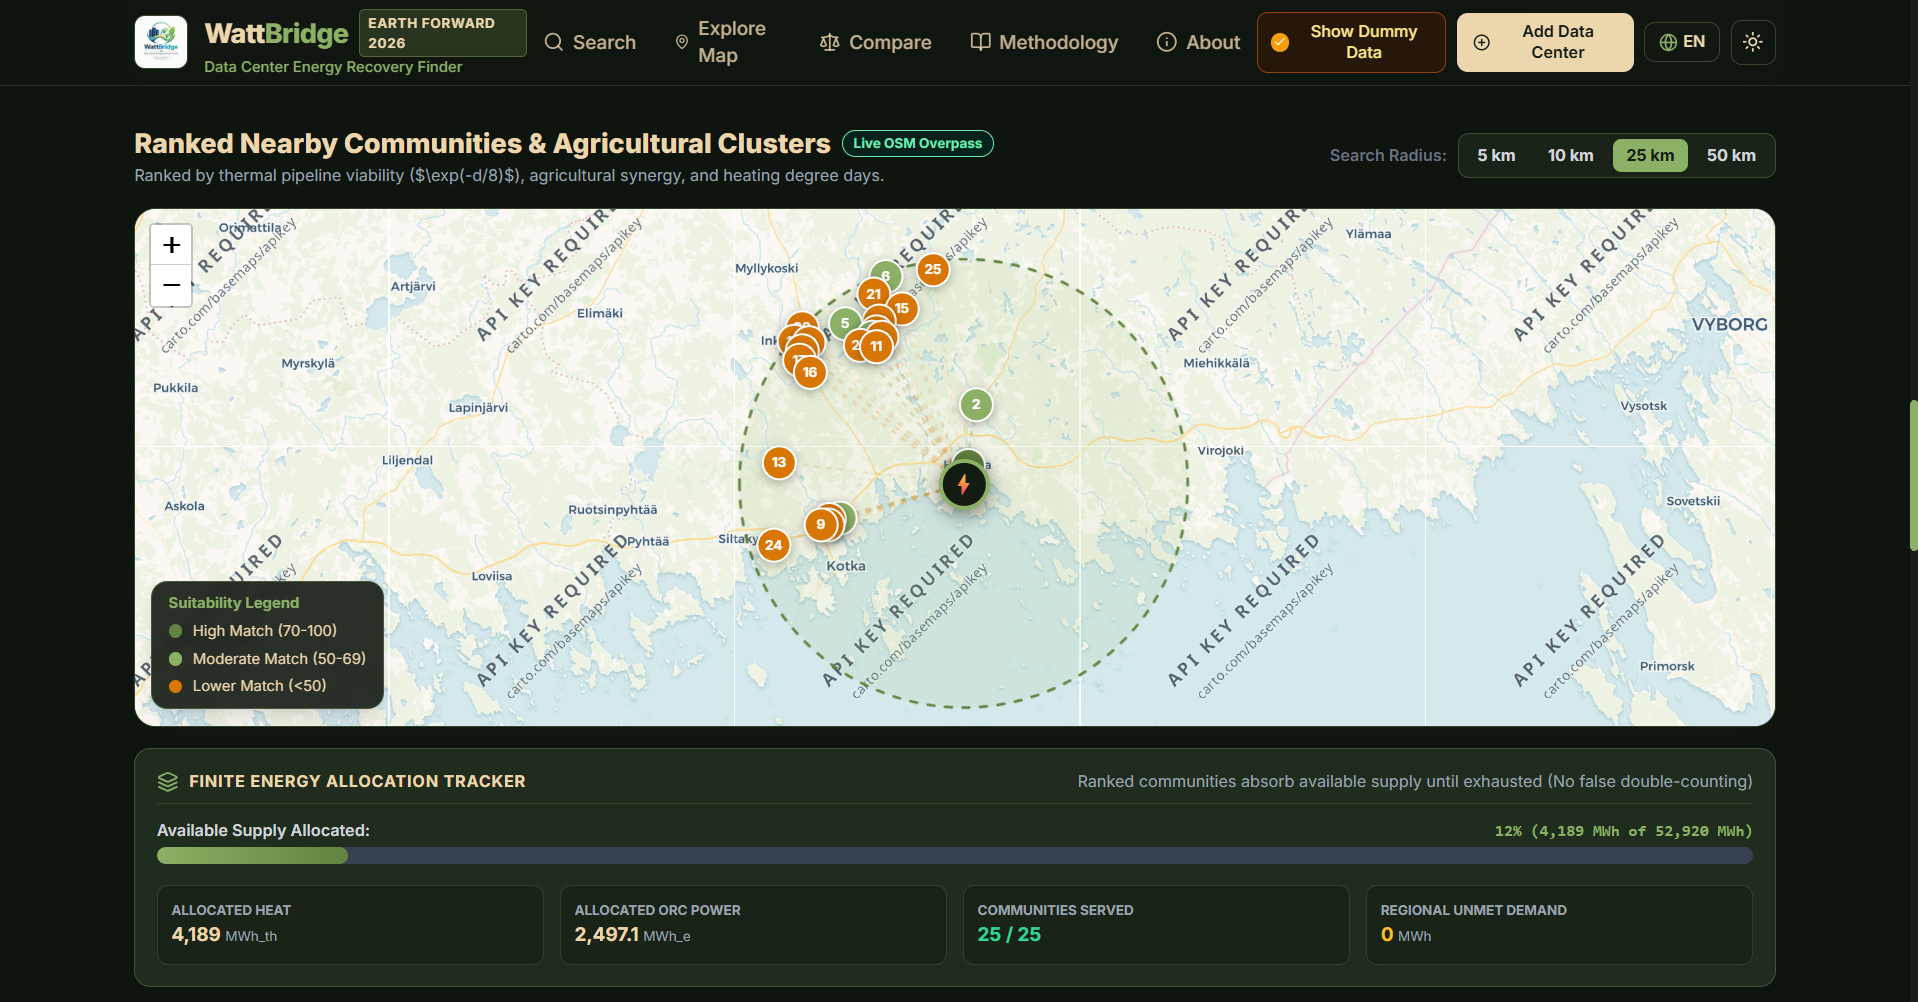
Map of ranked nearby communities and agricultural clusters within selected search radii of the facility.
Inspiration
AI data centers consume huge amounts of electricity, and nearly all of it ends up as waste heat vented into the air. Meanwhile, villages near these facilities often struggle with energy access and heating costs. We first asked whether a data center's noise could power a village. The physics said no, but it led us to the real resource: the heat. WattBridge bridges the energy AI wastes and the communities that could use it.
What it does
WattBridge lets you search for an AI data center and see its profile. It estimates the monthly recoverable energy (mostly usable heat, plus a small amount of electricity) as Low, Base, and High ranges. It then maps nearby villages and towns, ranks them with a transparent match score, and suggests uses like greenhouse heating or crop drying. Finally, it shows impact: households served and CO₂ avoided. We never claim data centers "produce" electricity, and every number is badged Reported, Estimated, or Dummy.
How we built it
We used React, Vite, TypeScript, and Tailwind, with Leaflet for maps and Recharts for charts. Data comes from Nominatim, Overpass (OpenStreetMap), Open-Meteo, and NASA POWER [future scope]. A tested calculation engine models heat capture by cooling type, and a community engine treats heat and electricity differently, since heat only travels a few kilometers. A seed dataset and cached API responses keep the app working when a network call fails.
Challenges we ran into
Our original noise-to-electricity idea failed the numbers, so we had to pivot to waste heat. Public data on data centers is patchy, so we used ranges and quality badges instead of false precision. Heat doesn't travel far, which forced separate matching logic. OpenStreetMap often lacks population data, so we built labeled fallback estimates.
Accomplishments that we're proud of
We turned a flawed first idea into a scientifically defensible one. Our match score is transparent, with no black-box ranking. Every figure shows a range and a data-quality label, and the full flow works end to end: search, estimate, map, impact.
What we learned
Quick physics checks save time, and honesty about uncertainty makes a project more credible. Open data can power a capable planning tool, and good sustainability tech starts with a specific user.
What's next for WattBridge
We plan to add real operator data, heat-pipeline cost and payback modeling, water-use impact, siting guidance for new data centers, one-click municipal reports, and a Hindi and multilingual interface
Built With
- antigravity
- claude
- express.js
- json
- leaflet.js
- node.js
- nominatim
- openstreetmap
- overpass
- react
- react-router
- recharts
- tailwindcss
- typescript
- vite


Log in or sign up for Devpost to join the conversation.