-
-
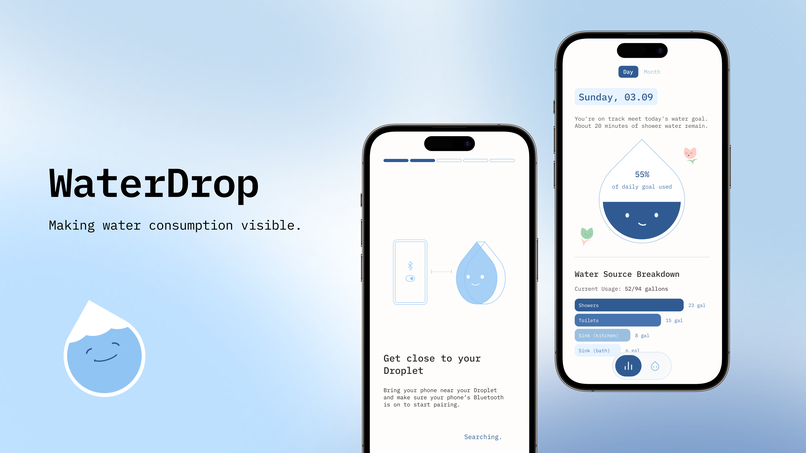
WaterDrop

Inspiration
Small everyday actions often feel insignificant in the moment, but slowly add up to something much larger over time. Buying coffee every day can turn into hundreds of dollars a year. Procrastinating small tasks can suddenly become a pile of overwhelming work. Daily pollution emissions eventually create long term environmental impacts.
With these ordinary yet habitual examples in mind, we focused on an overlooked human sensory gap: people have difficulty sensing the gradual accumulation and long-term impact of small everyday actions. While people are good at sensing immediate changes to their environment, they struggle to see consequences that build up over time.
For this project, we focused on a specific example that represents this sensory gap: water use. Keeping the sink on while brushing your teeth, taking an occasional longer shower, or doing a light load of laundry may not feel like an impactful decision at the moment, but people’s everyday water use builds habits and these small actions add up to significant water consumption. The sensory gap we aim to bridge is that accumulation is difficult for people to actually perceive while it’s happening.
What it does
We created WaterDrop, a physical and digital solution that uses sensors and provides users real-time visualizations of their water consumption. Users attach a small physical device called a Droplet to the wall in each bathroom where it displays live visualizations of water being used in that bathroom. Sensors within the pipes of nearby water sources such as sinks, a shower, and a toilet track water flow and send that data to the Droplet. By displaying real-time water use, the Droplet provides users a “sense” of their water consumption and in context to their long term water usage goals, bridging the sensory gap between everyday habits and its accumulated impact. The Droplet connects to our WaterDrop mobile application via Bluetooth, where users can set goals, track daily and monthly consumption, visualize their environmental impact, and get insights on their habits.
We designed our solution with the intention of being much more than just a water tracking application. Instead of only focusing on numbers or monthly water bills, our solution makes water use something people can actually notice as it builds up. The visualizations show water filling up over time, highlight which water sources contribute most to the user’s overall usage, and provide personal insights connecting the users’ routine habits to their larger environmental impact.
How we built it
Over the course of the past few days, here is how we approached our project:
Brainstorm subjects / pain points / sensory gaps. We honed in on one specific subject, always connecting our ideas back to what the prompt is asking.
Create user personas. We defined context, behaviors, characters, pain points, and needs for each persona.
Conduct market research. We recorded strengths, weaknesses and opportunities for each product. We researched Amphiro and Flume Smart Water Monitor, two existing water tracking products.
Conduct user research. We prepared neutral and comprehensive questions to help provide insight on our problem space and sent them out through an anonymous survey.
Synthesize user research into key insights. From our 55 survey responses, we synthesized data into generalizations and guided our design process on solving the most telling insights.
Ideate initial flows and features. We brainstormed a wide range of features and possible mediums for the product, thinking speculatively beyond a typical web or mobile app. We then narrowed the ideas down based on scope and time constraints.
Design low to mid fidelity mock ups. We created initial mockups of our flows, considering different iterations from bigger features to smaller UI decisions.
Create a design system. Before moving on to high fidelity designs, we created a standardized design system of colors, typography, assets, spacing, and more.
Design high fidelity mockups and prototype. We refined our final interface designs and built an interactive prototype to demonstrate how the system and user flows would work in practice.
Challenges we ran into
This was our first time participating in a designathon, where we had a very short amount of time to come up with a fully fleshed-out idea, solution, and design. One challenge we faced was learning how to make thoughtful design decisions under time constraints of a few days. For example, we had to narrow our scope to only track water consumption in sinks, toilets, and showers, even though activities like using the dishwasher or doing laundry also contribute to household water use. As we considered our problem space, we realized things like laundry loads or dishwashing efficiency introduce many additional variables that were too large for us to realistically consider, such as how much is done in one load. This experience pushed us to prioritize the most impactful parts of the problem and design within realistic limits.
Another challenge we faced was making sure our designs and research always tied back to the prompt. At times it felt like we were just developing another water tracking app, since the goal was to help users track their water use. We had to always step back and ask ourselves how this design helped people feel something they normally wouldn’t notice. This became especially important when thinking about how to visualize water usage. Simply showing numbers or gallons used didn’t effectively communicate the gradual impact of everyday habits, so we explored more visual representations, like water levels dropping over time, to make usage feel more tangible and easier to interpret.
Accomplishments that we're proud of
Participating in FigBuild2026!!
We are proud of designing something more speculative and thinking beyond just a digital interface. In the past, most of our design experience has been creating realistic digital apps for existing systems, which often come with many limitations. This project pushed us to think more creatively by exploring how a physical and digital system could work together. We learned more about how water is measured and tracked, and designed not only the mobile experience but also what information would be displayed on the Droplet itself and how that physical device would live in a bathroom environment.
What we learned
Through this project, we learned how much design can shape the way people perceive everyday behaviors. Water consumption is something people interact with constantly, but rarely think about in terms of accumulation. This pushed us to think beyond simply tracking data and instead design ways for people to actually notice their habits as they happen. It also helped us realize how important it is to translate complex systems into experiences that feel intuitive and meaningful to users.
What's next for WaterDrop
If we had more time, we would have:
Conduct critiques and user testing. Although user testing is difficult for this concept since the product relies on a full physical system (water sources, sensors, and a wall-mounted Droplet), it would have been extremely helpful to gather feedback from users. This would allow us to see whether the product feels as intuitive as we intend and if it truly addresses users’ pain points and needs.
Consider a more accurate water consumption system. As mentioned in our challenges above, our product mainly tracks sinks, showers, and toilets, even though there are many other ways people consume water in their daily lives such as doing laundry, using the dishwasher, watering plants, and more. In the future, we would want to explore how to give users a “sense” of their efficiency in those activities as well. We left this out of scope for this project because measuring something like laundry efficiency isn’t only about the amount of water used, but also factors like whether the load was light or heavy and how efficiently the water was utilized.
Built With
- adobe-illustrator
- figjam
- figma


Log in or sign up for Devpost to join the conversation.