-
The Vision
-
Slide page 1
-
Slide page 2
-
Slide page 3
Inspiration
Most of us have walked up to a favourite hawker centre and found the shutters down for cleaning. It's a small annoyance for us. For an older resident who eats at the same centre every day, a three-month renovation is a bigger deal.
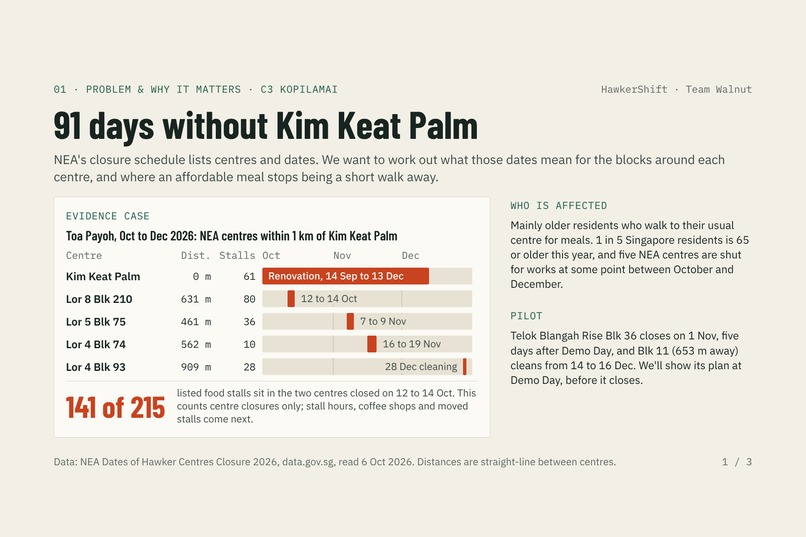
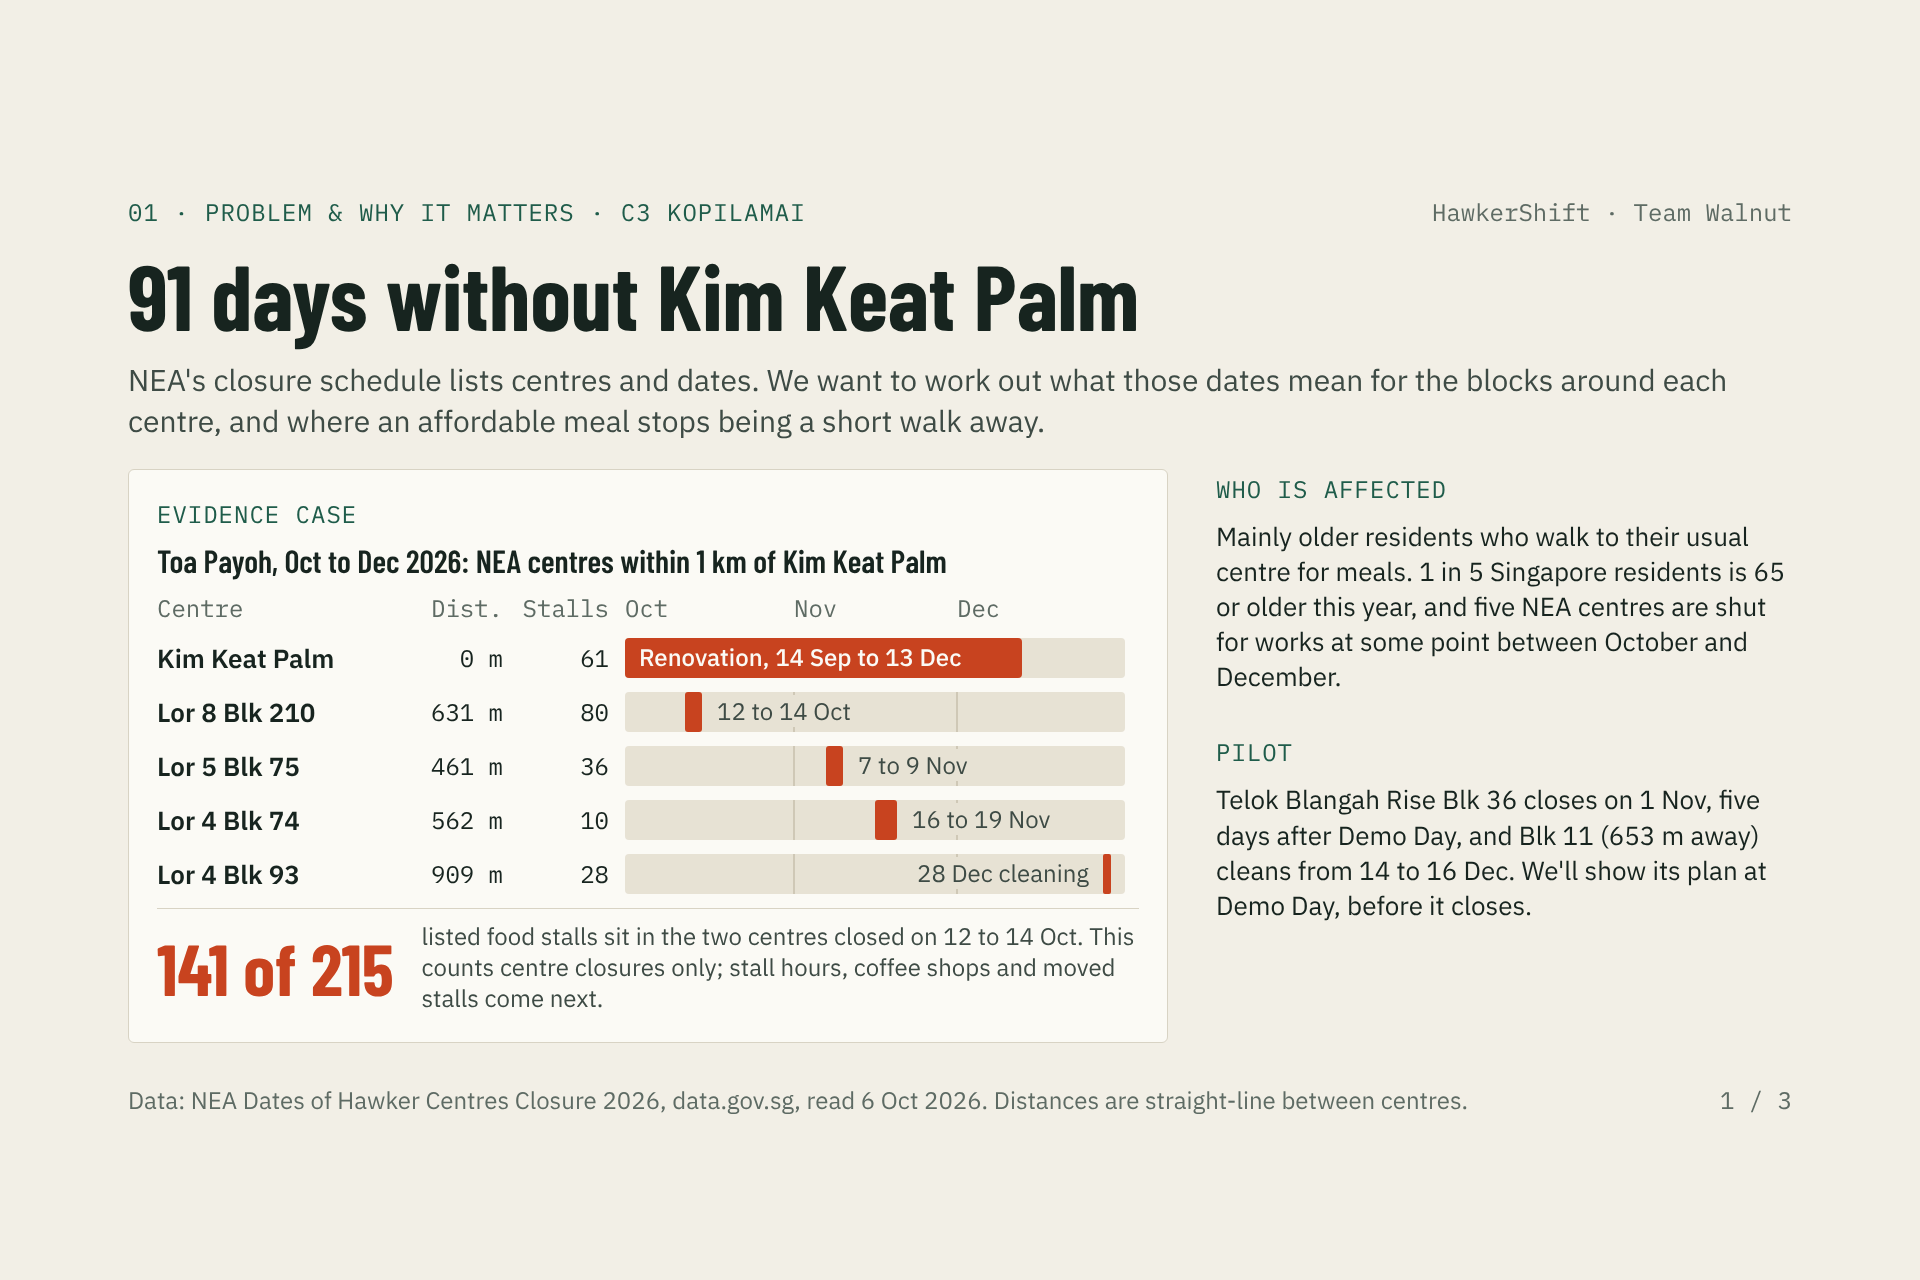
NEA publishes these closure dates on data.gov.sg, so I started reading through them. Kim Keat Palm in Toa Payoh, with 61 food stalls, is closed for renovation from 14 September to 13 December 2026. That is 91 days. During those months, three of the four other NEA centres within a kilometre also close for a few days of cleaning. On 12 to 14 October, 141 of the 215 food stalls in that area are in centres that are shut.
The schedule lists centres and dates, and nothing else. It doesn't say which blocks are affected, or whether the people living there still have somewhere affordable to eat within a short walk. I study architecture and sustainable design at SUTD, where we spend a lot of time thinking about how far people actually walk in a neighbourhood. That question is what got me started. NEA publishes these closure dates on data.gov.sg, so we started reading through them. Kim Keat Palm in Toa Payoh, with 61 food stalls, is closed for renovation from 14 September to 13 December 2026. That is 91 days. During those months, three of the four other NEA centres within a kilometre also close for a few days of cleaning. On 12 to 14 October, 141 of the 215 food stalls in that area are in centres that are shut.
The schedule lists centres and dates, and nothing else. It doesn't say which blocks are affected, or whether the people living there still have somewhere affordable to eat within a short walk. One of us studies architecture and sustainable design at SUTD, where we spend a lot of time thinking about how far people actually walk in a neighbourhood. That question is what got us started.
What it does
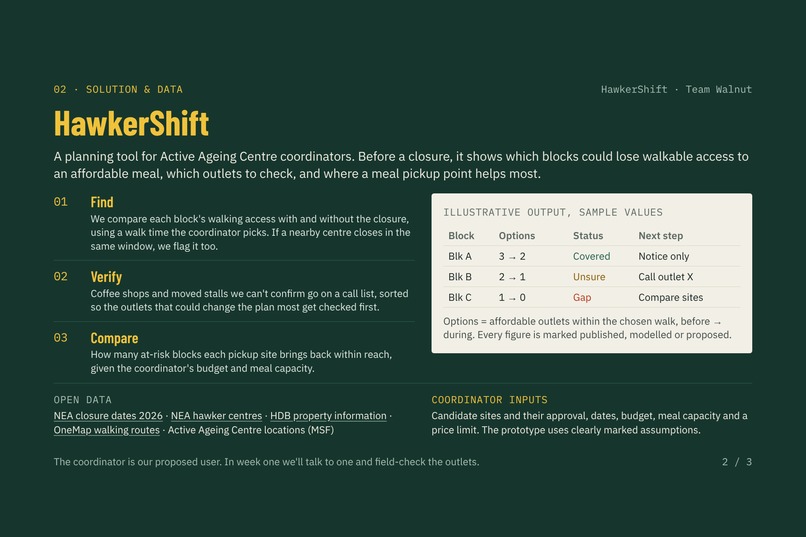
HawkerShift is a planning tool for Active Ageing Centre coordinators, the people who already look out for older residents in an estate.
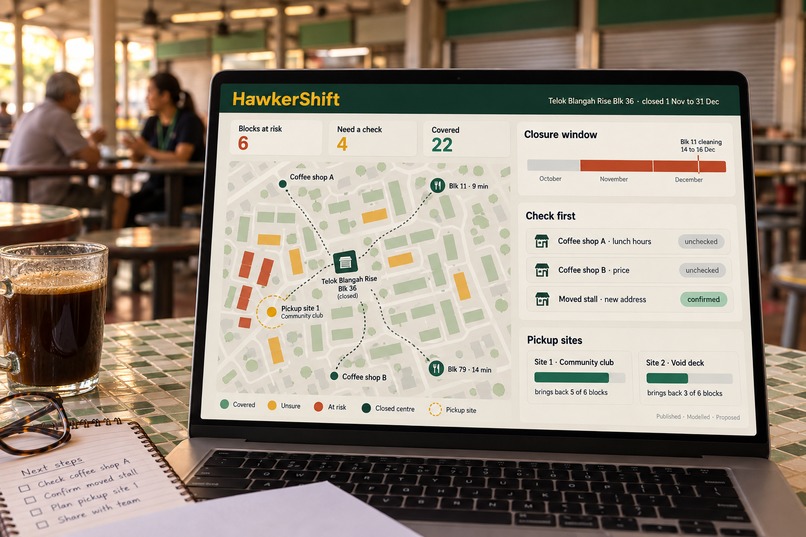
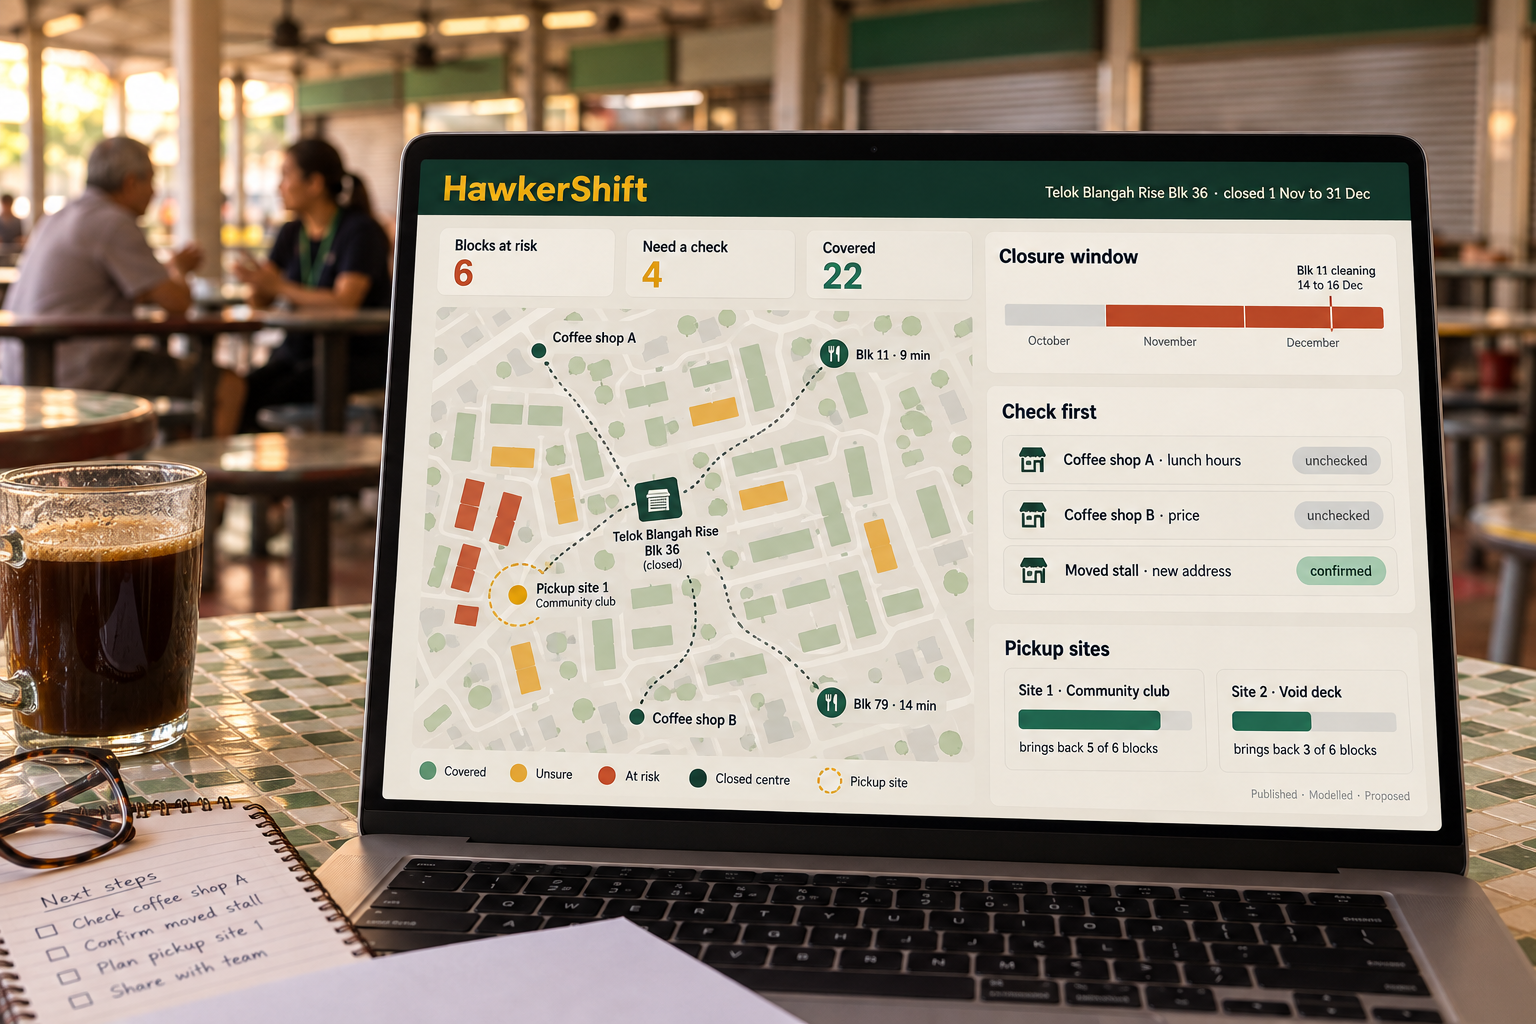
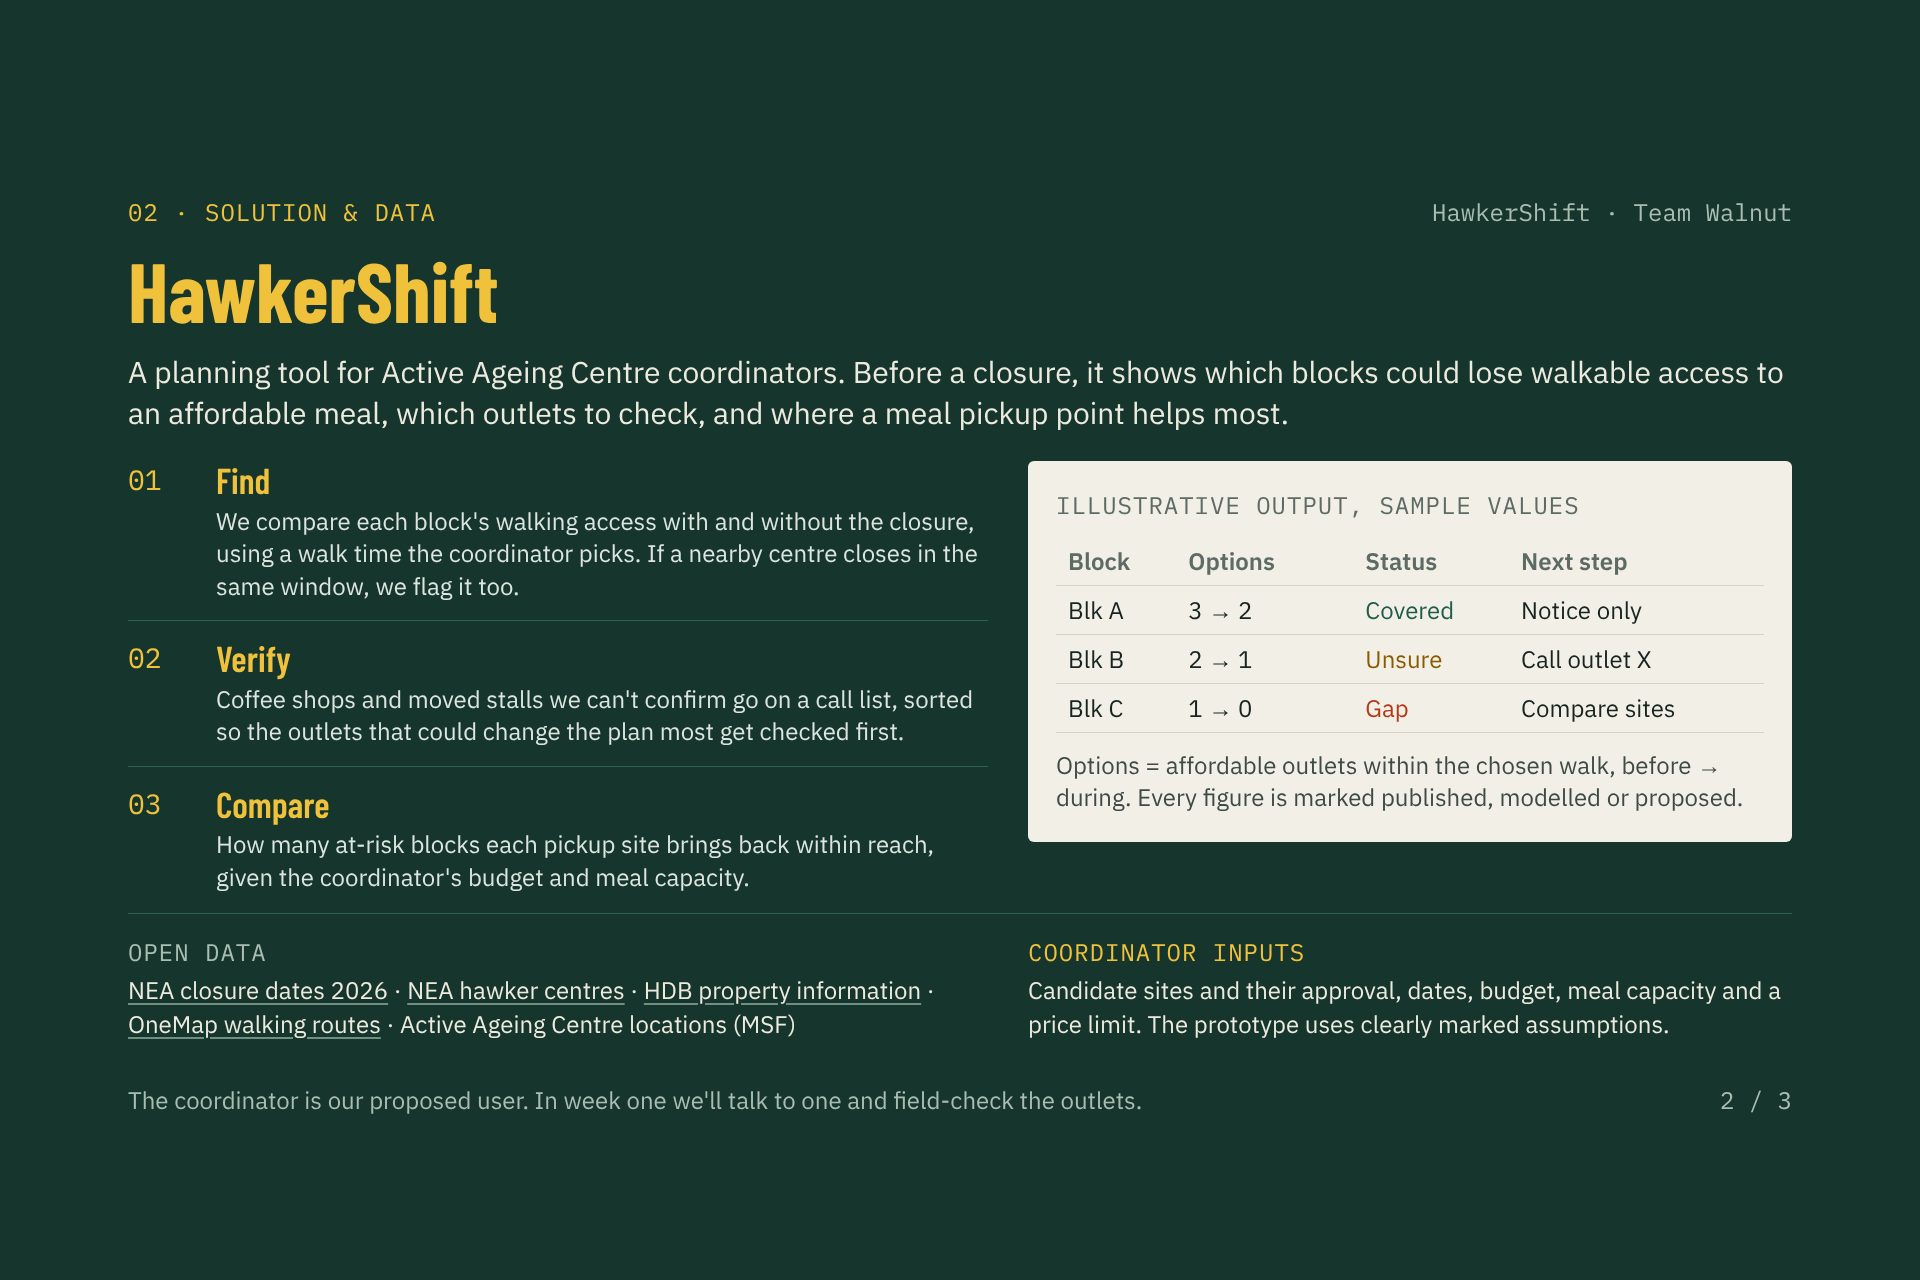
A few weeks before a closure, the coordinator opens HawkerShift and picks the centre. The tool looks at every HDB block nearby and works out how many affordable places to eat are within walking distance, first with the centre open and then with it closed. The coordinator sets what counts as walking distance, ten minutes by default. Some blocks just end up walking a little further. Others are left with nothing close by, and those are the ones the coordinator should look at first. If another centre nearby closes during the same weeks, HawkerShift points that out too.
A lot of food options are missing from public data: coffee shops, stalls that moved somewhere temporarily, interim centres. So HawkerShift gives the coordinator a short list of places to call or visit. It's ordered so the checks that could change the plan the most come first. Sometimes one phone call to a coffee shop shows that a block is fine after all.
Where a gap is real, the coordinator can try out a few possible meal pickup points, such as a community club or a void deck. HawkerShift shows how many affected blocks each one would bring back within reach, based on the budget and meal capacity the coordinator enters.
Every number in the tool is labelled as published, modelled or proposed. A closure date comes from NEA, walking access is our estimate, and a pickup point is only a suggestion until someone approves it.
How we built it
So far this is an idea backed by real data. We downloaded all 123 records in NEA's hawker closure dataset, checked the dates, stall counts and locations for our two case areas by hand, and screened for nearby centres that close at the same time. That screen is how we found the Toa Payoh case.
For the pilot we chose Telok Blangah Rise Blk 36, which closes on 1 November. That is five days after Demo Day, so we can show a plan before the closure actually begins.
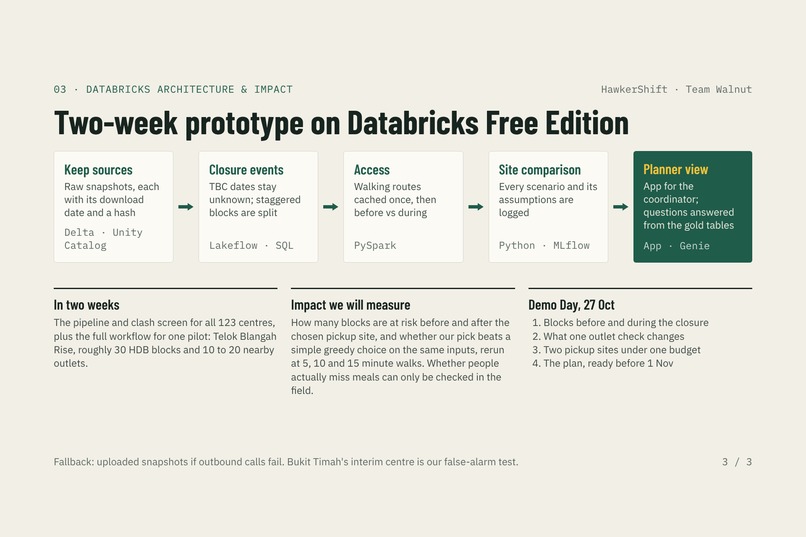
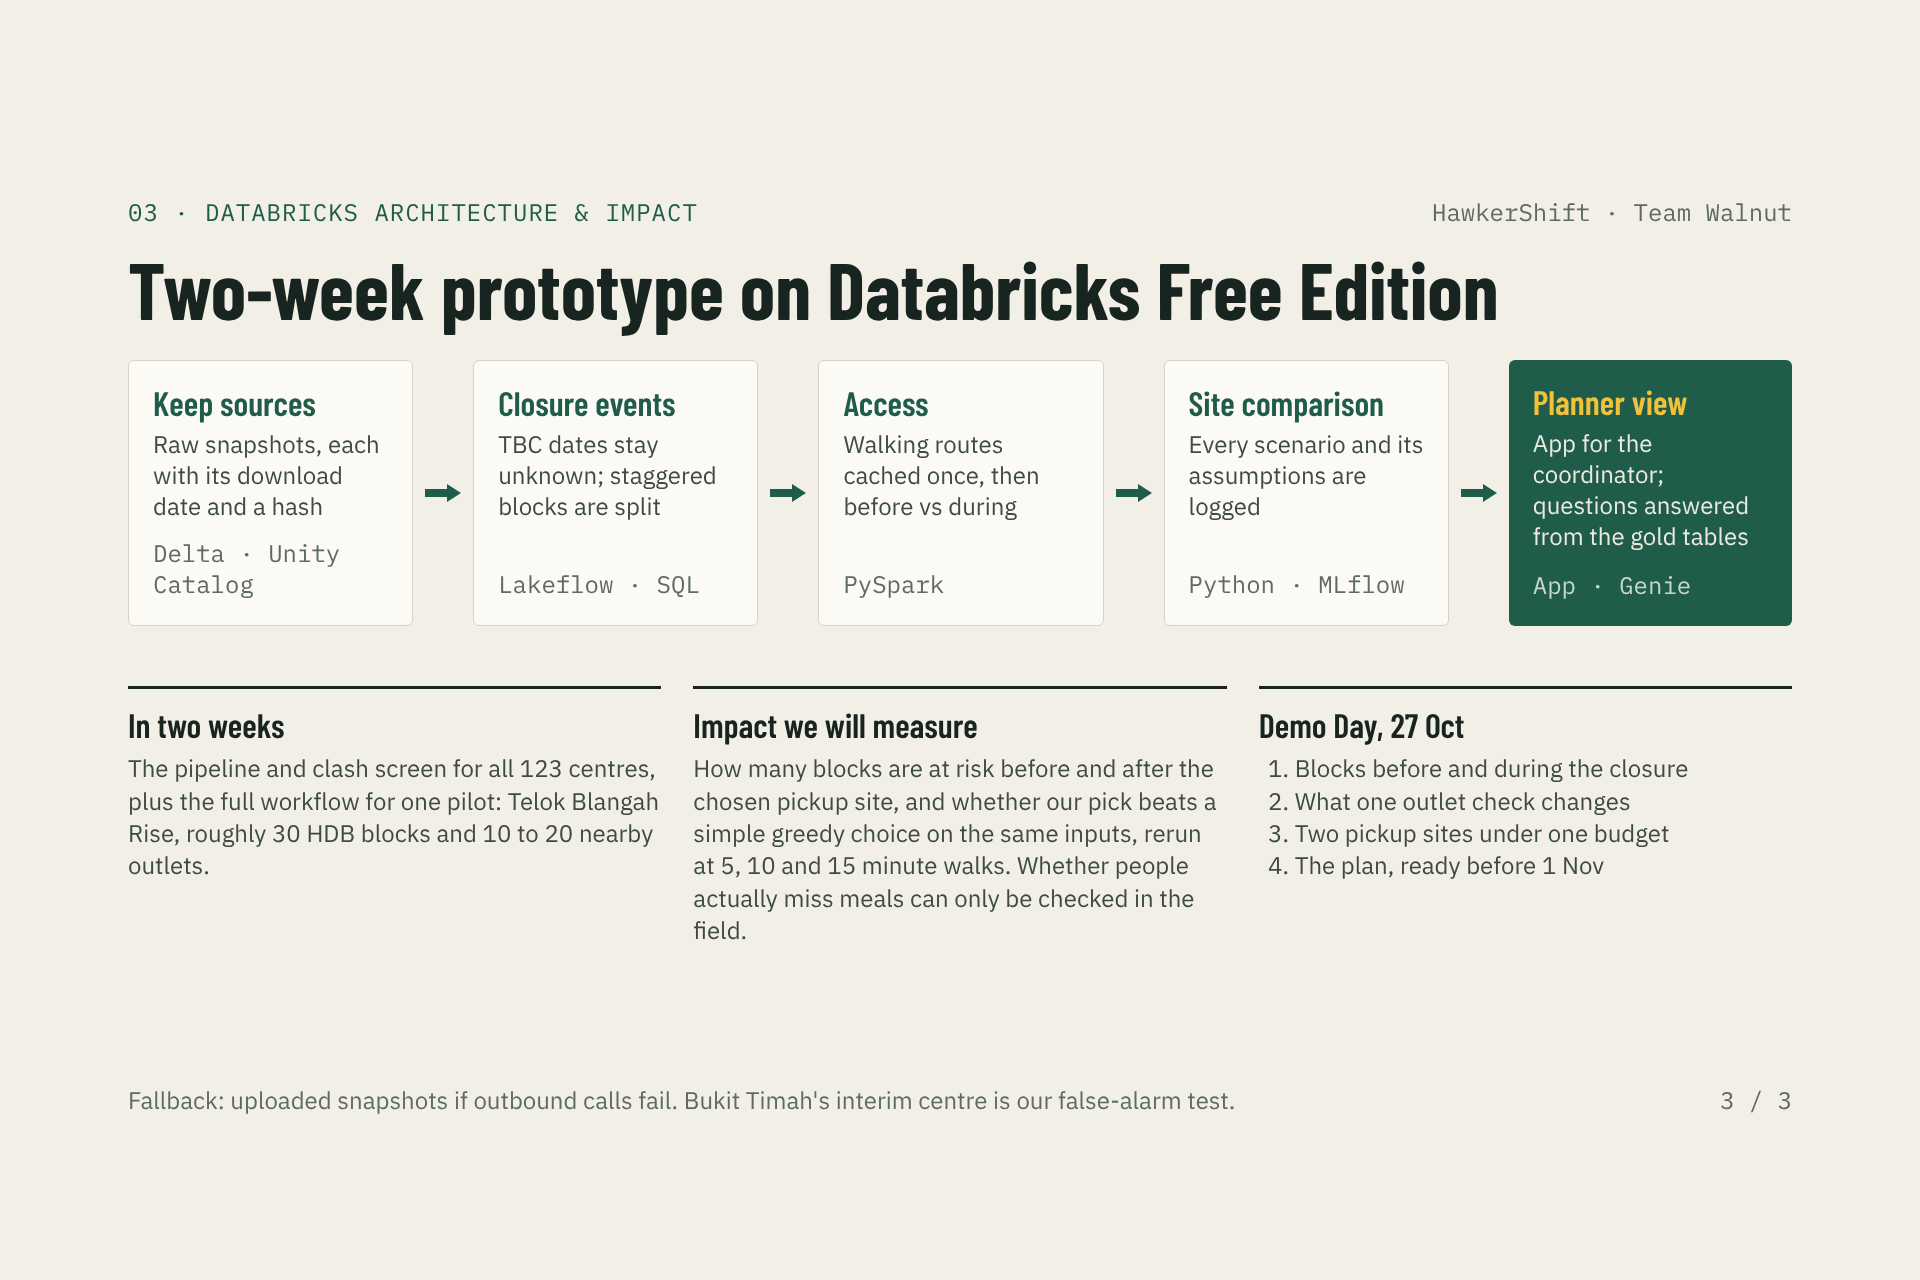
During the two-week sprint we will build it on Databricks Free Edition. Raw data from data.gov.sg and OneMap goes into Delta tables governed by Unity Catalog, with each download dated and hashed so we always know which version we used. A Lakeflow pipeline turns the closure records into clean events. Walking routes from OneMap are fetched once and cached, then used in PySpark to compare access before and during a closure. Each scenario we test is logged in MLflow along with its assumptions. The coordinator sees all of this through a Databricks App, and can ask questions in plain English through Genie, which answers only from our final tables.
The main measure is simple. A block counts as losing access when it had at least one affordable option within the walk before the closure and has none during it. Blocks that had no option to begin with are counted separately, so the closure is only blamed for what it actually changes.
Challenges we ran into
The closure data looks tidy but needs care. Some dates are still listed as TBC. Some centres cover two blocks that close on different days. The file also keeps old renovation dates from past years. If we had read it carelessly, we would have counted closures that aren't happening.
We also couldn't find a count of older residents for each HDB block. Population figures only go down to subzone level, so we count blocks and flats and use the subzone age profile as background. We didn't want to make up numbers of seniors per block.
Hawker centres are only part of where people eat. Coffee shops and temporary stalls aren't in the NEA list. Bukit Timah Market, for example, is closed until 2029, but an interim centre now serves the area and doesn't show up in the closure data. That's why checking alternatives became one of the three main steps.
Small choices can change results. In one area, the nearest other centre was about 9 m outside our 1 km circle. Since then we rerun everything at several walking times before we trust a result.
The hardest part was being honest about what we can claim. Our first draft promised to count "stranded seniors" and to reschedule NEA's cleaning calendar. The public data can't support either, so we dropped both.
Accomplishments that we're proud of
We found a real case in current government data: three cleaning closures falling inside Kim Keat Palm's 91-day renovation, all within a kilometre of each other.
Our pilot is timed so we can plan for a closure before it happens and avoid explaining one afterwards.
We also caught and fixed our own mistakes along the way. One was a closure we had labelled wrongly, and another was a statistic that said more than the data could back up.
What we learned
A closure schedule tells you about buildings. To plan for people you also need walking routes, opening hours and prices.
Often the most helpful thing a tool can tell you is which fact to check next.
Simple methods deserve a fair chance. We'll compare our choice of pickup site with a plain greedy pick on the same inputs, and if the simple one does just as well, we'll use it.
Being upfront about what's known and what's estimated makes people more likely to trust the result.
What's next for Walnut
During the sprint we want to sit down with at least one AAC coordinator and learn how they handle closures today. We also plan to check 10 to 20 food outlets around Telok Blangah Rise in person, and build the full workflow for about 30 HDB blocks.
At Demo Day we'll show the Telok Blangah plan ahead of the 1 November closure, including one outlet check that changes or confirms a gap.
If a partner is willing, we'd like to go back after the closure and see how the plan compared with what actually happened.
Later on, we'd like HawkerShift to run automatically whenever NEA releases a new schedule. The same idea could also help with other planned disruptions to daily life in an estate, like lift upgrading or market closures.
Built With
- data.gov.sg
- databricks
- databricks-apps
- delta-lake
- genie
- geojson
- lakeflow
- mlflow
- onemap
- pyspark
- python
- sql
- unity-catalog

Log in or sign up for Devpost to join the conversation.