Inspiration
A vendor's logs started flowing into a fresh index on a Tuesday. By the time anyone had eyeballed the
raw text, guessed the fields, written the rex, built a panel and named a metric, it was a Tuesday
three weeks later; the data sat dark and unmonitored that entire time, precisely when a
brand-new source is riskiest. That gap between "data is arriving" and "someone can actually use it" is
a tax every Splunk shop pays, every week, on every new source.
I kept seeing teams reach for the obvious shortcut: ask a model "what are the fields in this log?" and
paste whatever it says into a dashboard. A plausible rex on an unfamiliar format silently parses
nothing, so you get a dashboard full of empty panels that looks done. A confident wrong
extraction ships and lands worse than no extraction at all.
So I built around the opposite assumption. If an AI is going to propose a field extraction, shouldn't you be able to make it prove that field exists, on your own events, before it ever ships?
What it does
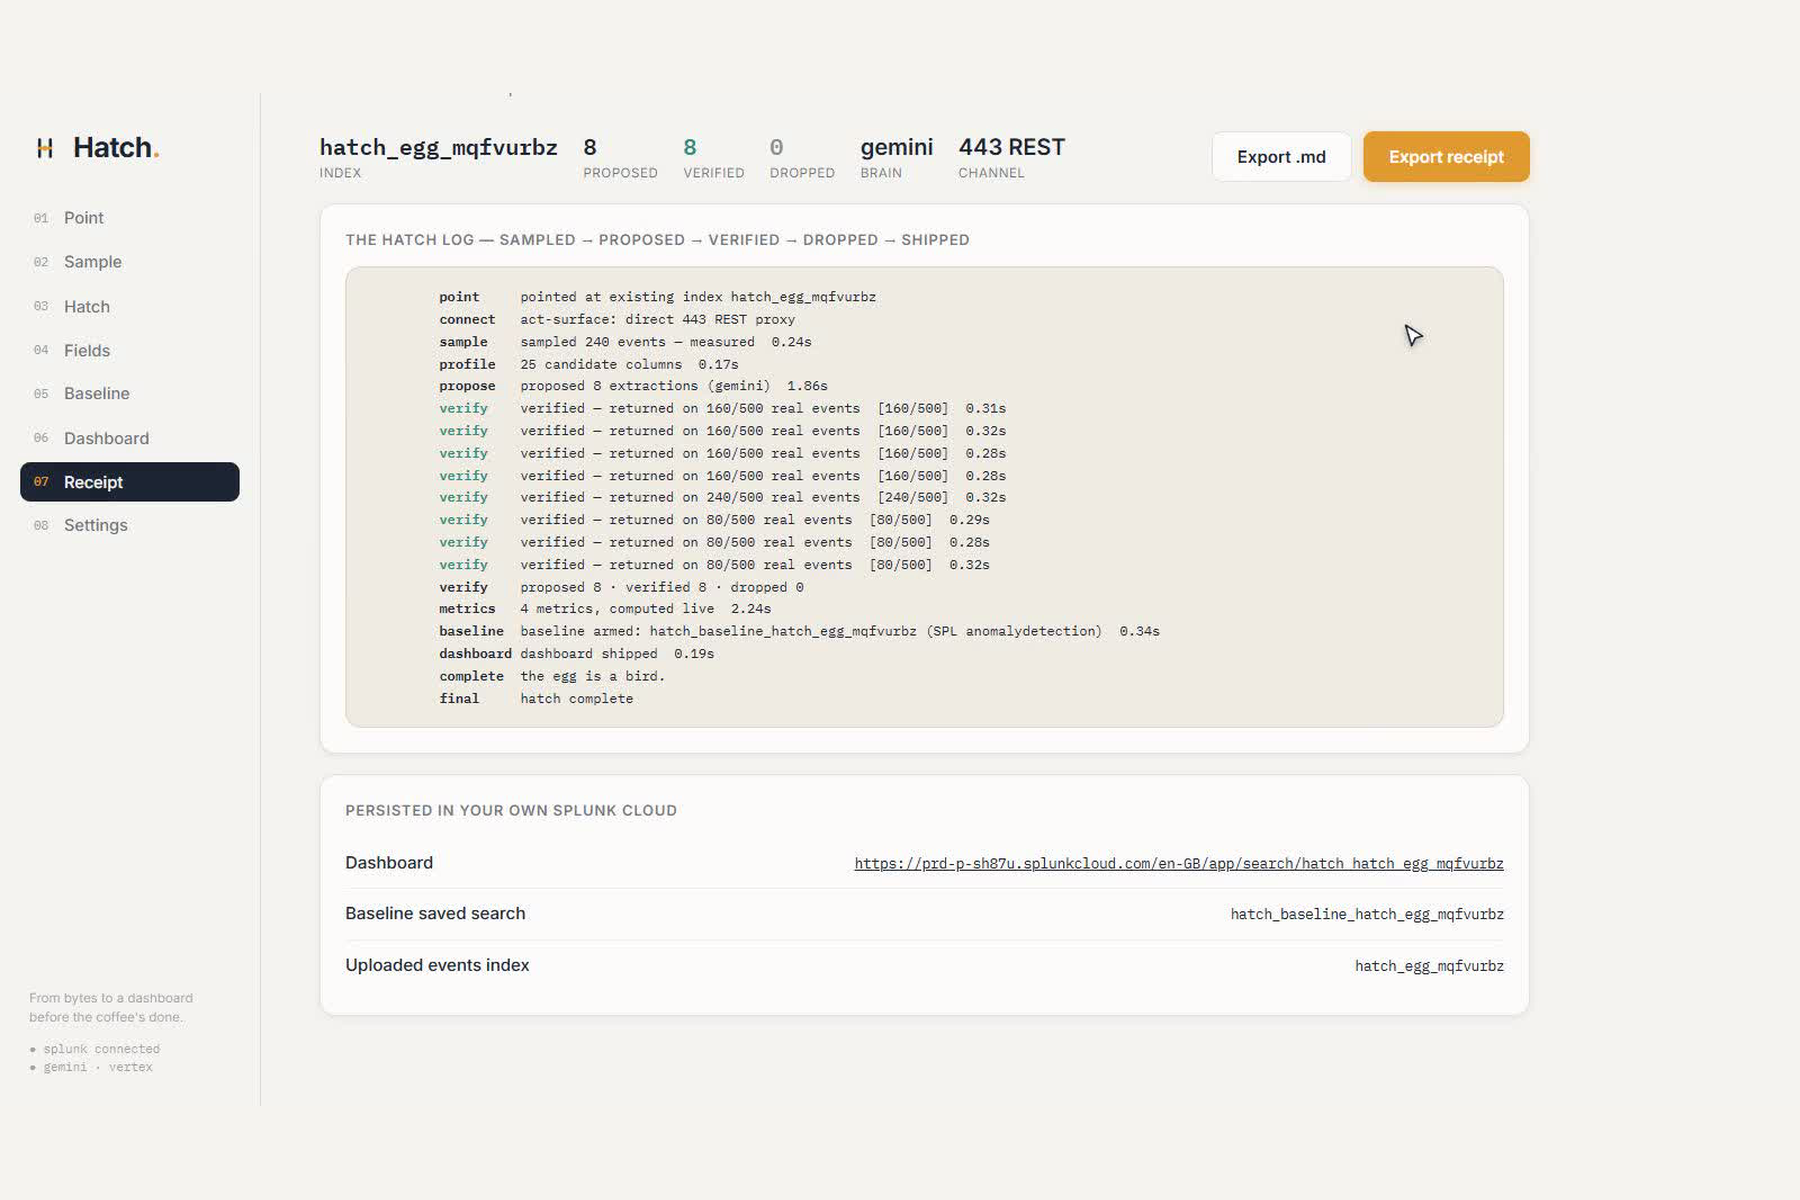
Hatch cold-starts a brand-new Splunk index into a working, monitored app in about two minutes, and every field it keeps is proven by running it against your real events.
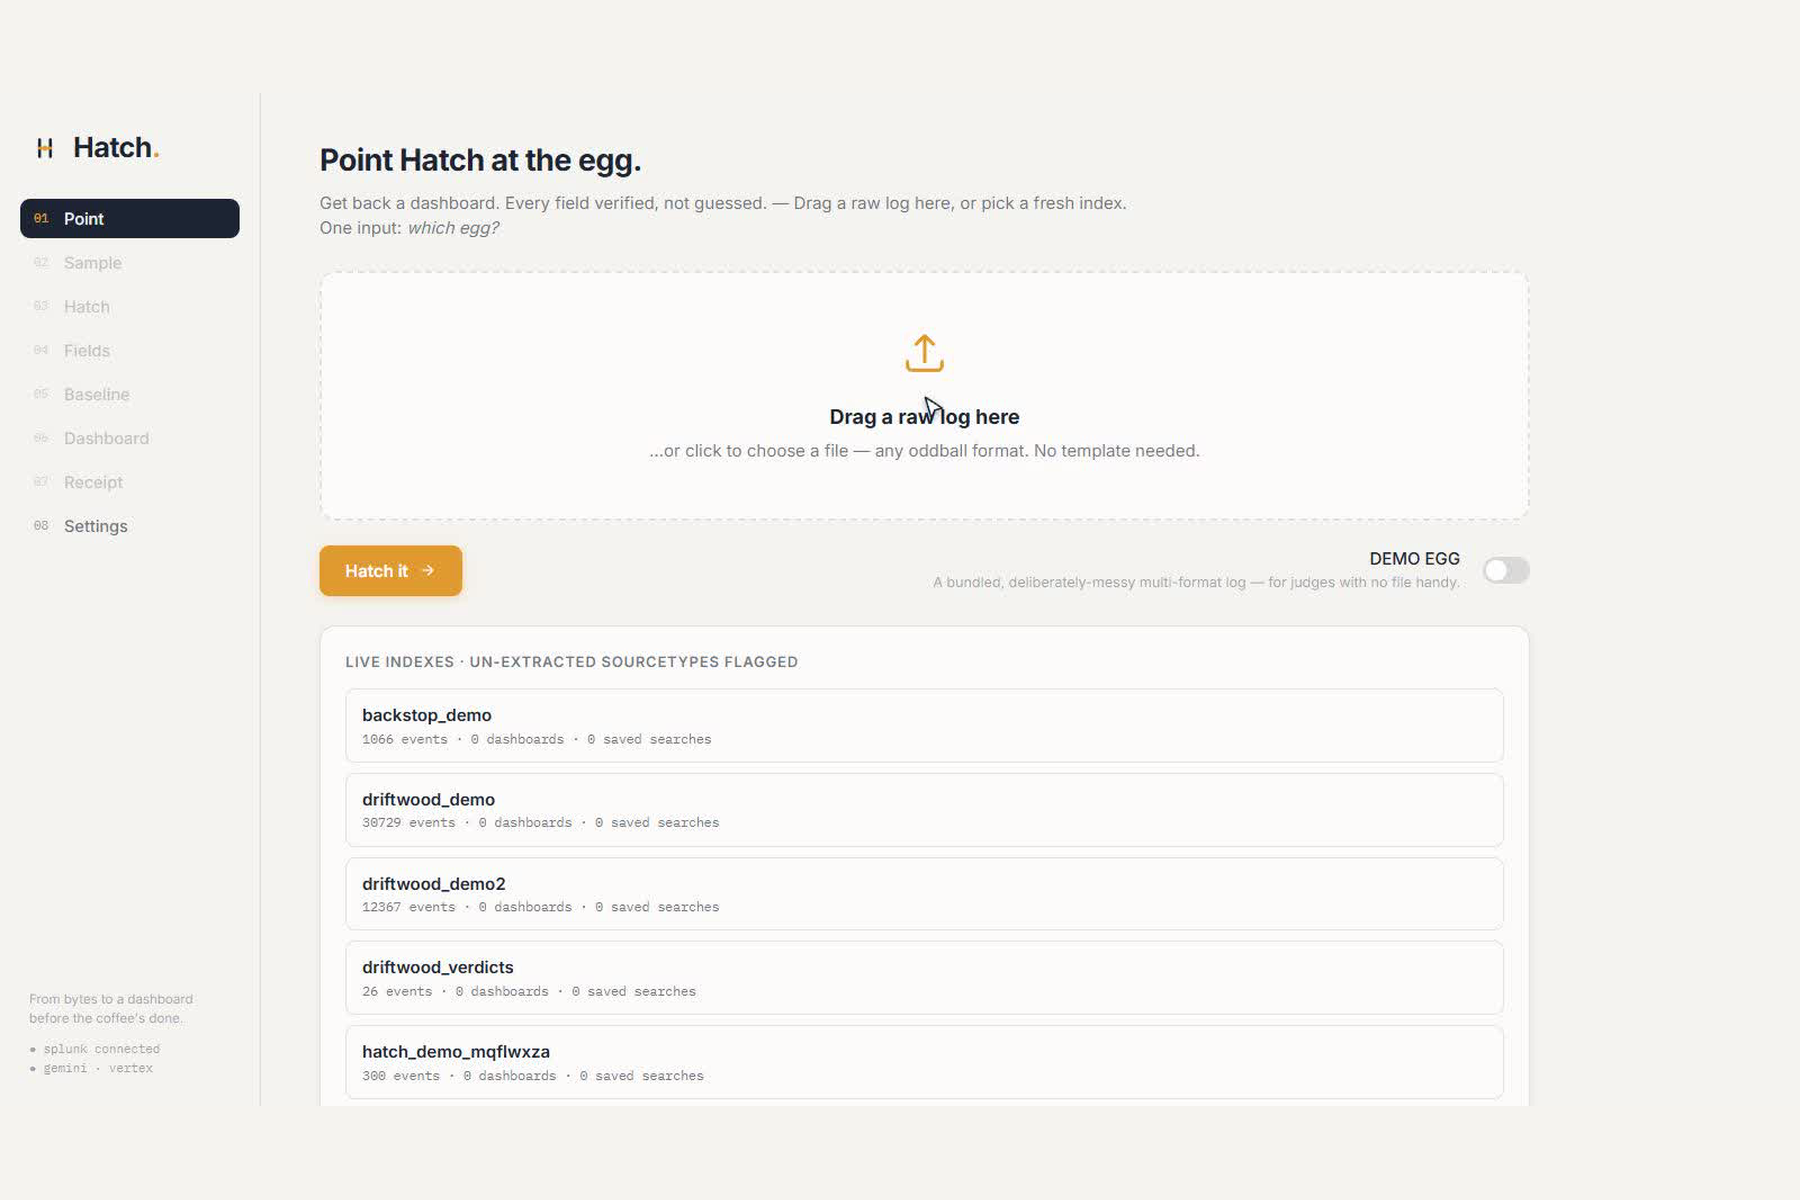
- Point it at the egg : drag any raw log file onto Hatch (or pick a fresh index, or flip the labelled DEMO EGG). It ingests the file into a fresh per-run index over Splunk's 443 web-REST proxy and polls until it's searchable.
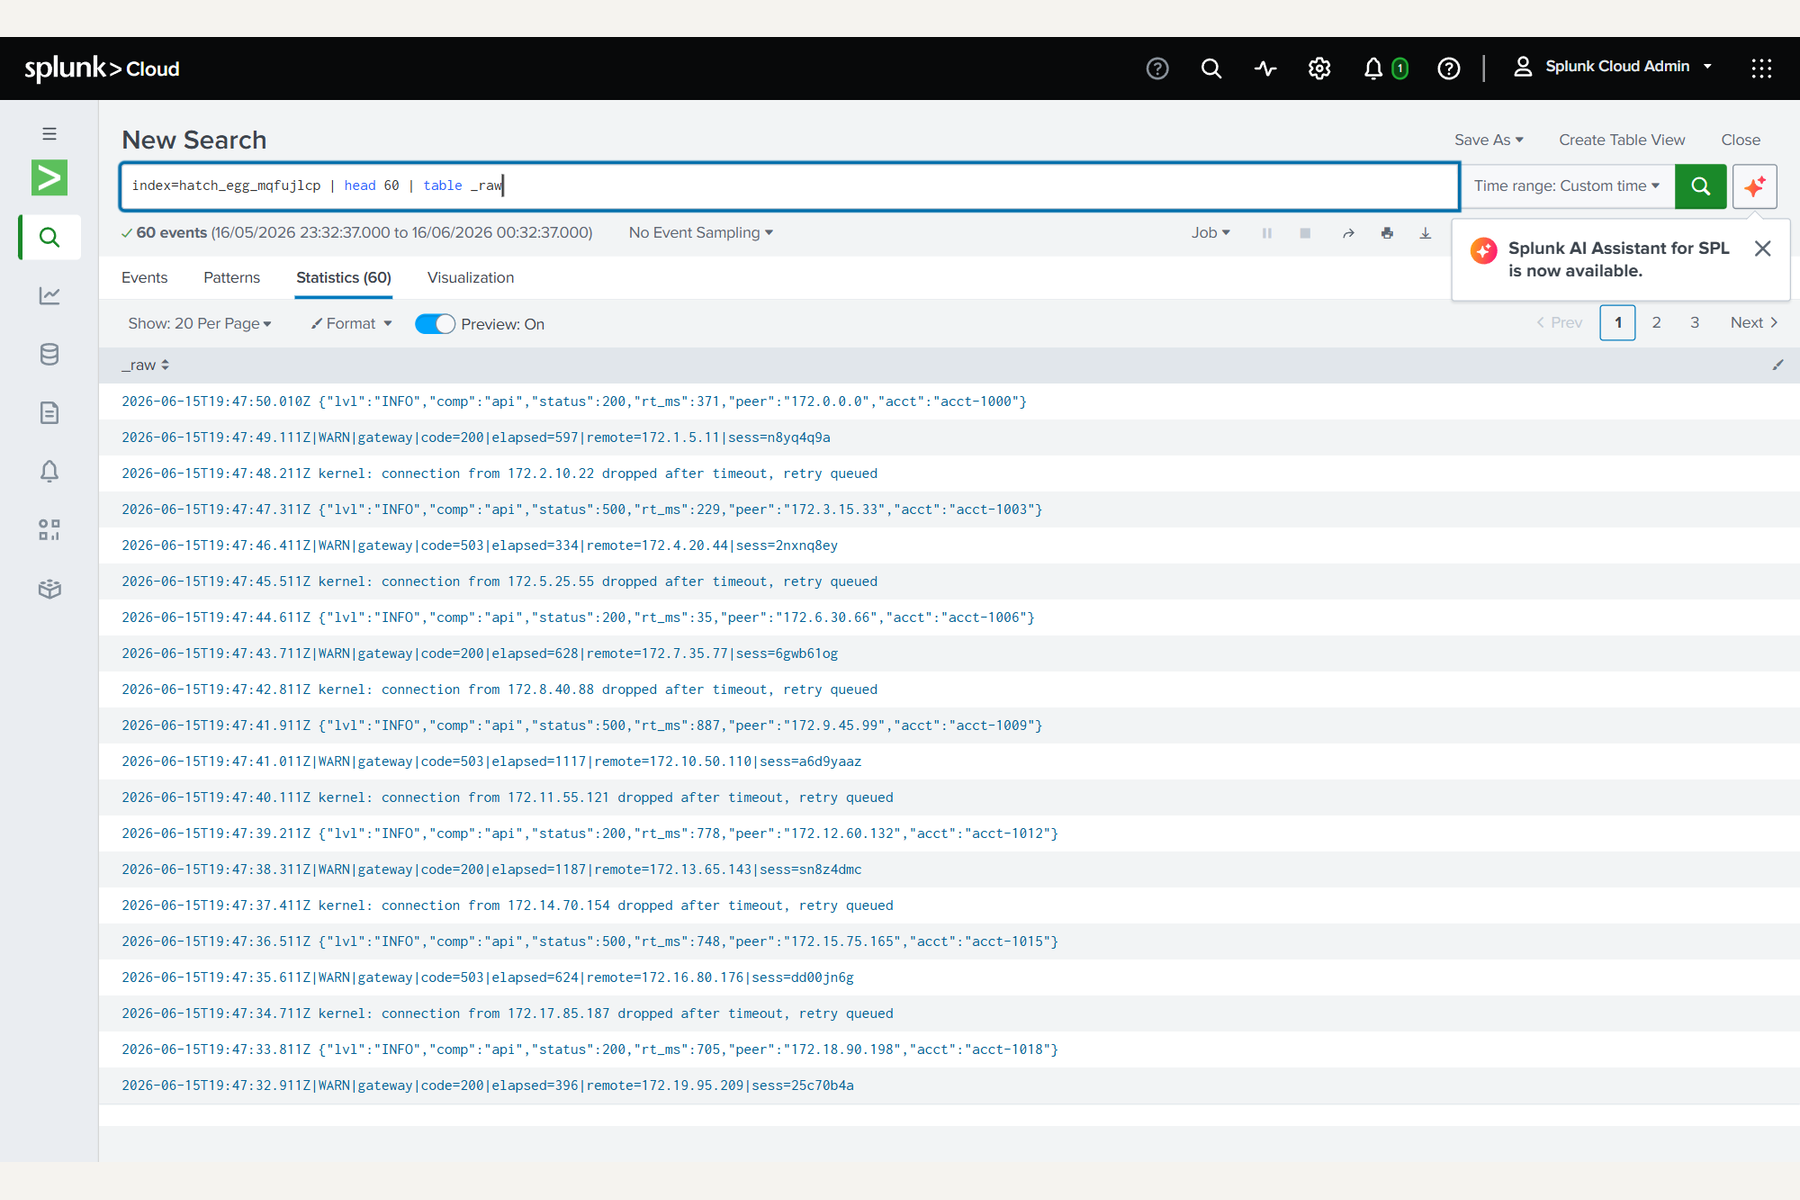
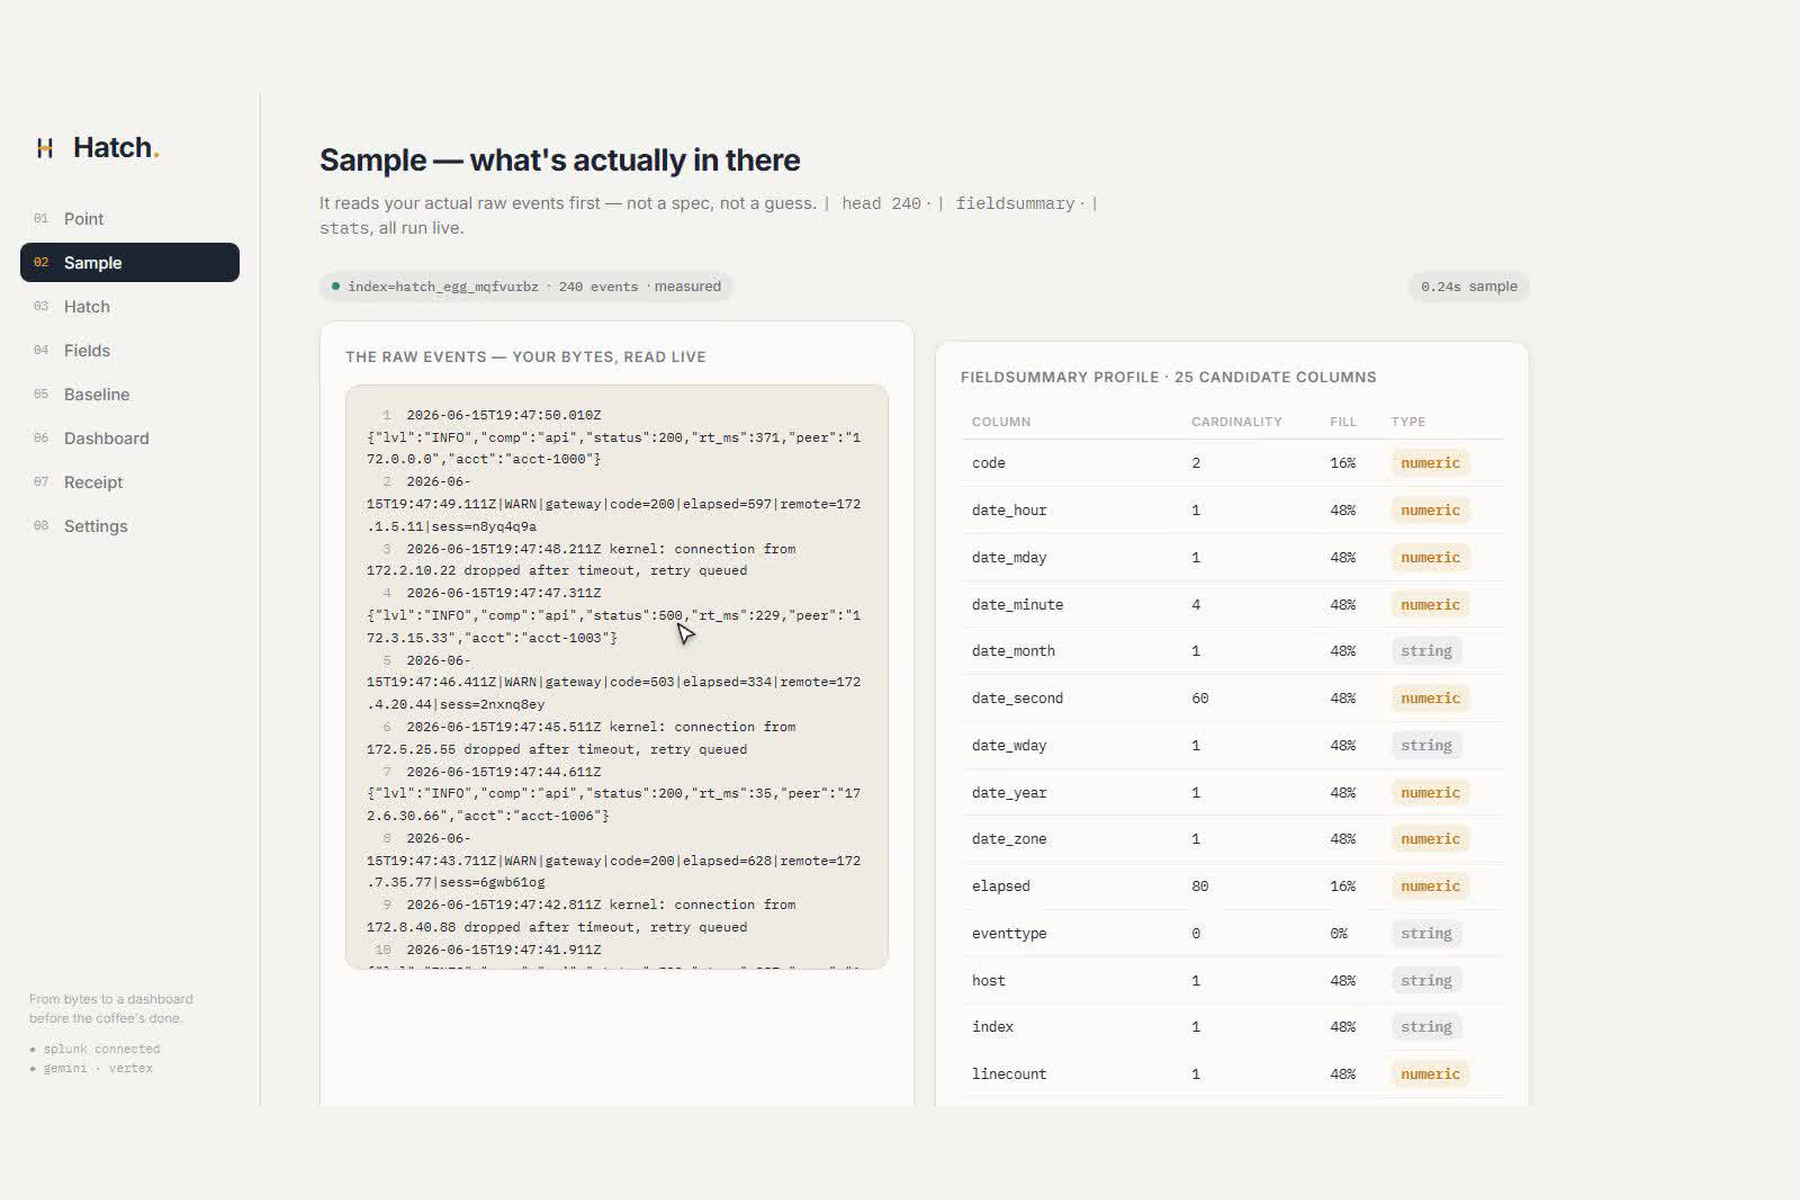
- Sample the real bytes :
search index=<new> | head 500 | table _rawreads the actual raw text;| fieldsummary+| statsprofile the candidate columns, per-field cardinality, fill rate and type. Every number on screen ismeasuredfrom the live events. - Propose the extractions a human would hand-write : the real sample lines go to Gemini on
Vertex AI (drafted the way the Splunk AI Assistant for SPL would), which returns the
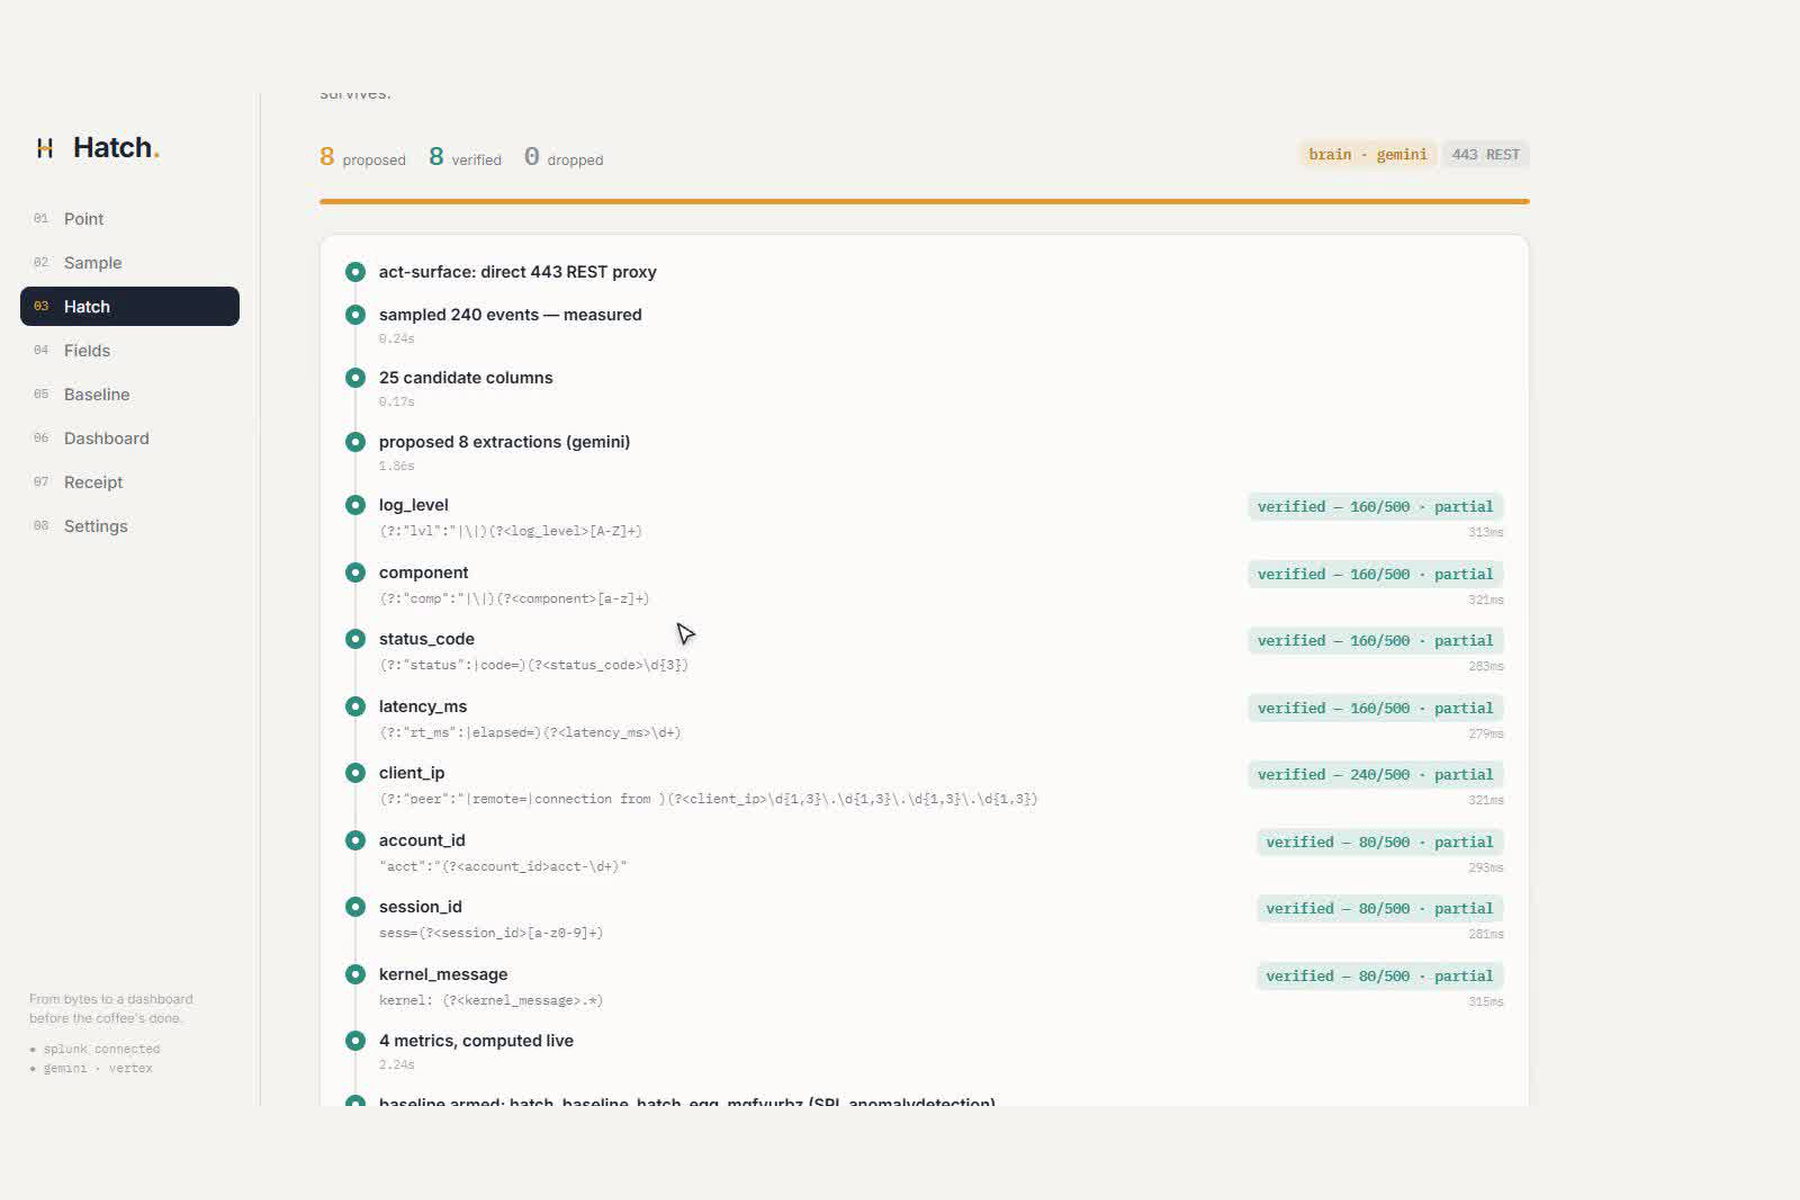
rexfield extractions (status_code,latency_ms,client_ip,tenant_id) that turn the wall of text into named fields. - Verify by execution, the mechanic and the anti-fake : before Hatch keeps a single field, it
wraps the proposal as
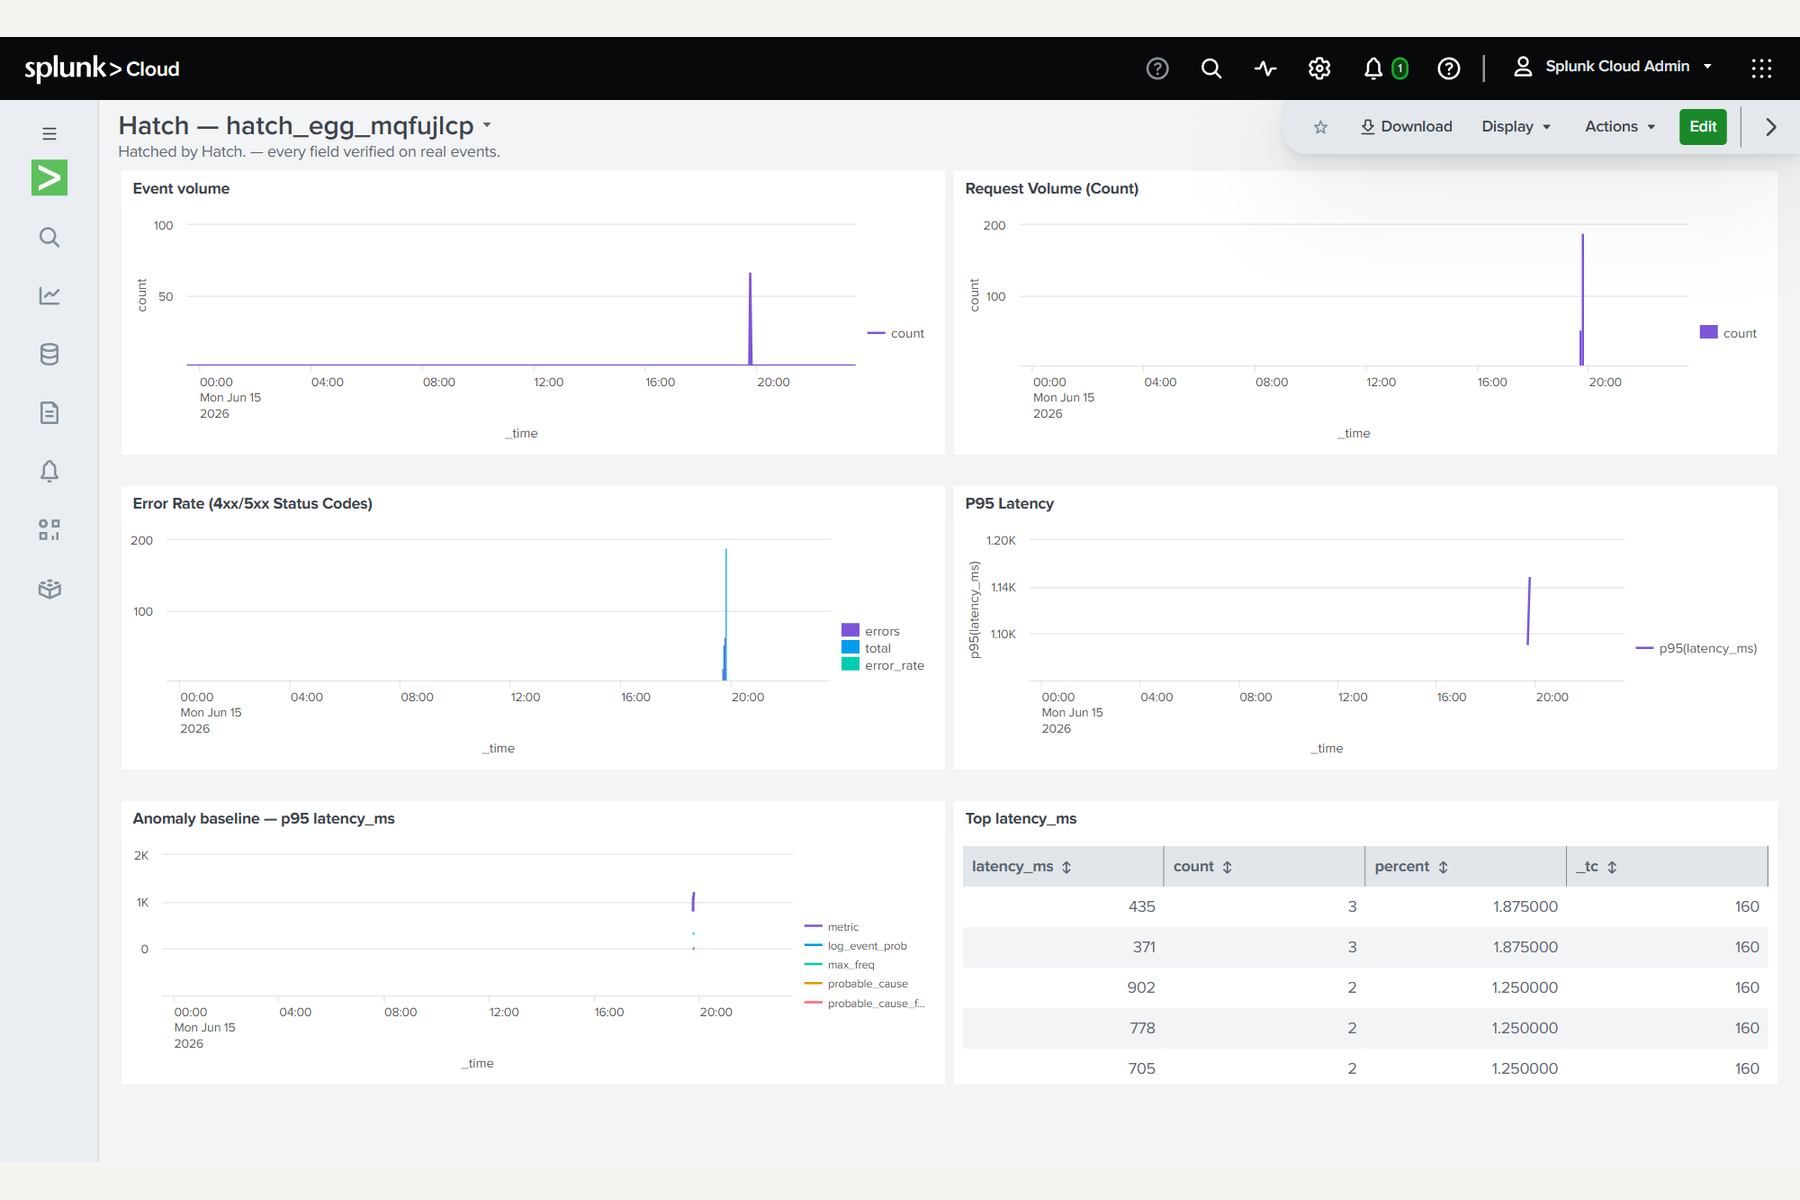
… | rex "<proposed>" | where isnotnull(<field>) | stats countand runs it against the live events. >0 keeps it (with a preview of the real extracted values); 0 is a hard drop, shown calmly in grey. Gemini never wins on its own; a field only ships if it parsed real bytes. - Pick the few metrics worth watching : from the verified fields and their cardinalities, Hatch proposes the handful that matter for this source (error rate, p95 latency, top talkers), each run as real SPL so the panels ship with real measured numbers.
- Arm a live baseline from minute one : a real
anomalydetectionscheduled saved search is created on the key metric, so the brand-new source is monitored the moment it hatches, never dark. - Ship a real Dashboard Studio app : valid Dashboard Studio v2 JSON is POSTed as a real saved
view (
data/ui/views) over the proxy, returning a clickable URL that did not exist two minutes ago. AI Canvas narrates the whole sequence as an auditable trace, and a one-click receipt exports every search that ran with its real hit count.
How I built it
The architecture. A single-origin Vite + React frontend served by a Node + Express backend
(ESM, no framework magic). Every Splunk and Gemini call happens server-side, so no secret ever reaches
the browser, and the client only ever talks to its own relative /api/* routes (same origin in prod,
Vite-proxied in dev). It's containerized with a small Dockerfile and deployed to Google Cloud
Run.
The senses are core Splunk REST + SPL over the 443 proxy. A from-scratch Splunk client authenticates
with a web session login (/splunkd/__raw/services/...). The 8089 mgmt port and ACS are never
touched, which is exactly why the same code works against a locked-down Cloud trial and from the
deployed backend (443 is public). On top sit the act-surface methods Hatch needs: sampleRaw,
fieldSummary, verifyExtraction (the gate), saveSearch (the baseline), and postDashboard
(Dashboard Studio JSON to a real saved view). When the official Splunk MCP Server (app 7931,
/services/mcp) is installed it becomes the act-surface; when it isn't, the identical steps run over the
REST proxy and a badge shows which channel is live.
Gemini is the reasoning brain, and it's bounded. The agent reasons with Gemini
(gemini-flash-latest) on Vertex AI. Locally it authenticates with a self-signed service-account
JWT (zero npm deps) against the :generateContent endpoint; on Cloud Run it uses the bound service
account via Application Default Credentials, with no key file shipped anywhere. I set thinkingBudget=0
so the model returns clean extraction JSON instead of burning the output budget on reasoning, and wrote
a tolerant parser that repairs the single-backslash regex LLMs emit inside JSON strings. Gemini's only
job is propose; it never decides what ships.
The clever bit is a regex normalizer. Splunk's PCRE rejects a rex with two capture groups of the
same name (which is exactly what Gemini emits for a field that appears in several line formats:
status":(?<x>\d+)|code=(?<x>\d+)). normalizeRex rewrites that into one named group with
non-capturing prefix alternation, a faithful equivalent that's still executed and still only kept if
it returns rows.
Measured, off the live deployed run (real REST + SPL + Vertex, never estimated):
- ingest a ~240–300-line upload + poll until searchable, then sample 500 events: ~1–2 s for the sample once indexed · Gemini propose: ~3–5 s · verify-by-execution per field: ~0.3–0.6 s · dashboard POST: ~2 s.
- on a clean single-format vendor log: 9 proposed · 9 verified · 0 dropped, every field
300/300. - on a deliberately messy three-format log: 8–9 proposed · 7–8 verified · partial hits that tell the
truth (
client_ip 239/239,status_code 160/239because it only appears in two of the three formats,log_level 80/239) · 1 dropped at0/239. The counts differ on every file because there is no template, and that variance is the proof.
Challenges I ran into
- Problem: a model will happily propose a field that parses nothing. → Solution: I forbade the
model from ever deciding what ships. Every proposed
rexis re-run against the real 500-event sample and kept only ifstats count > 0. That single constraint makes "verified on your real events" structurally true; strip Gemini out entirely (the heuristic fallback) and the verify gate is unchanged. - Problem: Splunk's PCRE silently returns zero on a duplicate-named capture group, so a
perfectly reasonable multi-format extraction would get dropped for the wrong reason. → Solution:
normalizeRexrewrites same-name alternations into one named group with a non-capturing prefix alternation, so a single field can capture across formats and still face the same execution gate. - Problem: a 443-only Cloud trial with 8089 firewalled and ACS dead, and a Cloud Run service with no key file. → Solution: a web-session REST client over 443 for Splunk, and a Vertex client that reads its credentials either from a key file (local) or from the bound service account's metadata server (Cloud Run), so the exact same code path is genuinely live both locally and on the deployed URL.
- Problem: a freshly-uploaded log's own timestamps can land anywhere (a vendor export is hours or
days old; some events are clock-skewed into the near future), and a narrow search window would miss
them and report a misleading zero. → Solution: sample, verify and chart over a wide
-30d … +1hwindow, and fit each dashboard's default time range to the data's real span so the panels actually fill.
Accomplishments that I'm proud of
- No fake field survives the gate. A
verified: N/500stamp is never constructed without a real returned count behind it. A dropped field shows as a calm greyreturned on 0/500 · no template to fall back on, because the honest empty state is the feature. - A real, clickable dashboard that didn't exist two minutes ago. It's a
Dashboard Studio v2 view POSTed into your own Splunk Cloud, with your own extracted fields and real
panel numbers and an
anomalydetectionbaseline already drawn, all live in the product. - The proof changes with your data. Hand Hatch a single-format log and you get
9/9 · 300/300; hand it a three-format mess and you get honest partials and a drop. A faked engine has no template for a format it's never seen, so the per-file count variance is the unfakeable proof. - Calm, instrument-grade design. Cream, one deep ink, one warm amber, one teal for verified, no red, no alarm, mono numerals for every measured truth. It reads like a tool a data engineer would actually trust at 9am.
What I learned
- Execution beats plausibility. The valuable use of an LLM here is to draft an extractor fast, then get out of the way while real SPL decides. Making the model say less and the search say more is the whole trick.
- The hard part was making every verdict re-derivable, more than proposing fields. Counting hits is trivial; making each count reproducible on a stranger's own oddball file, live, is the engineering, and it's where the trust lives.
- The cold-start gap is under-served because it's unglamorous. Nobody builds the "turn bytes into a usable view" agent because it reads as plumbing work, which is exactly why it's the gap worth building.
What's next for Hatch
Depth of extraction:
- Extend from single-field
rexto multi-field joins,lookupenrichment, and CIM-style field normalization, so the dashboard speaks the same field names as the rest of your estate.
Trust signals:
- A confidence band per field (parse-rate + value-sanity + type-conformance), beyond just a hit count,
because
verified: 500/500proves a field parsed, not that it means its name.
Reach:
- A "re-hatch on drift" mode: re-sample on a schedule and re-verify the extractions when a vendor changes their log format, so the dashboard never silently rots.
Bonus stretch (each honest seam → a roadmap bullet):
- Wire the Cisco Deep Time-Series Hosted Model into the baseline (upgrading
anomalydetectionto a real forecast band) and Foundation-sec into a per-field security-relevance flag the moment those Hosted Models are enabled on the stack. - Route the act-surface through the official Splunk MCP Server the moment app 7931 is installed (the code already probes for it and falls back to 443 today).
The Bigger Picture
Every Splunk shop measures whether their dashboards are useful. Almost none measure how long their new data sits unusable (dark, unparsed, unmonitored) in the weeks between ingest and insight. The reflex is to throw a model at the problem and trust whatever it says. Hatch takes the inverse bet: let the model propose at machine speed, then prove every field by executing it on your real events, and ship a real dashboard you can click. The principle is simple. Trust the count it can't fake. From bytes to a dashboard before the coffee's done.
Built With
- ai-agents-for-splunk-apps
- anomalydetection
- app-inspect
- application-default-credentials
- cloud-run
- dashboard-studio
- docker
- esm
- express.js
- fieldsummary
- gemini
- gemini-flash-latest
- google-cloud
- javascript
- node.js
- react
- receivers-simple
- rex
- saved-searches
- server-sent-events
- service-account-jwt
- spl
- splunk
- splunk-ai-assistant-for-spl
- splunk-ai-canvas
- splunk-cloud
- splunk-mcp-server
- splunk-rest-api
- timechart
- verify-by-execution
- vertex-ai
- vite

Log in or sign up for Devpost to join the conversation.