-
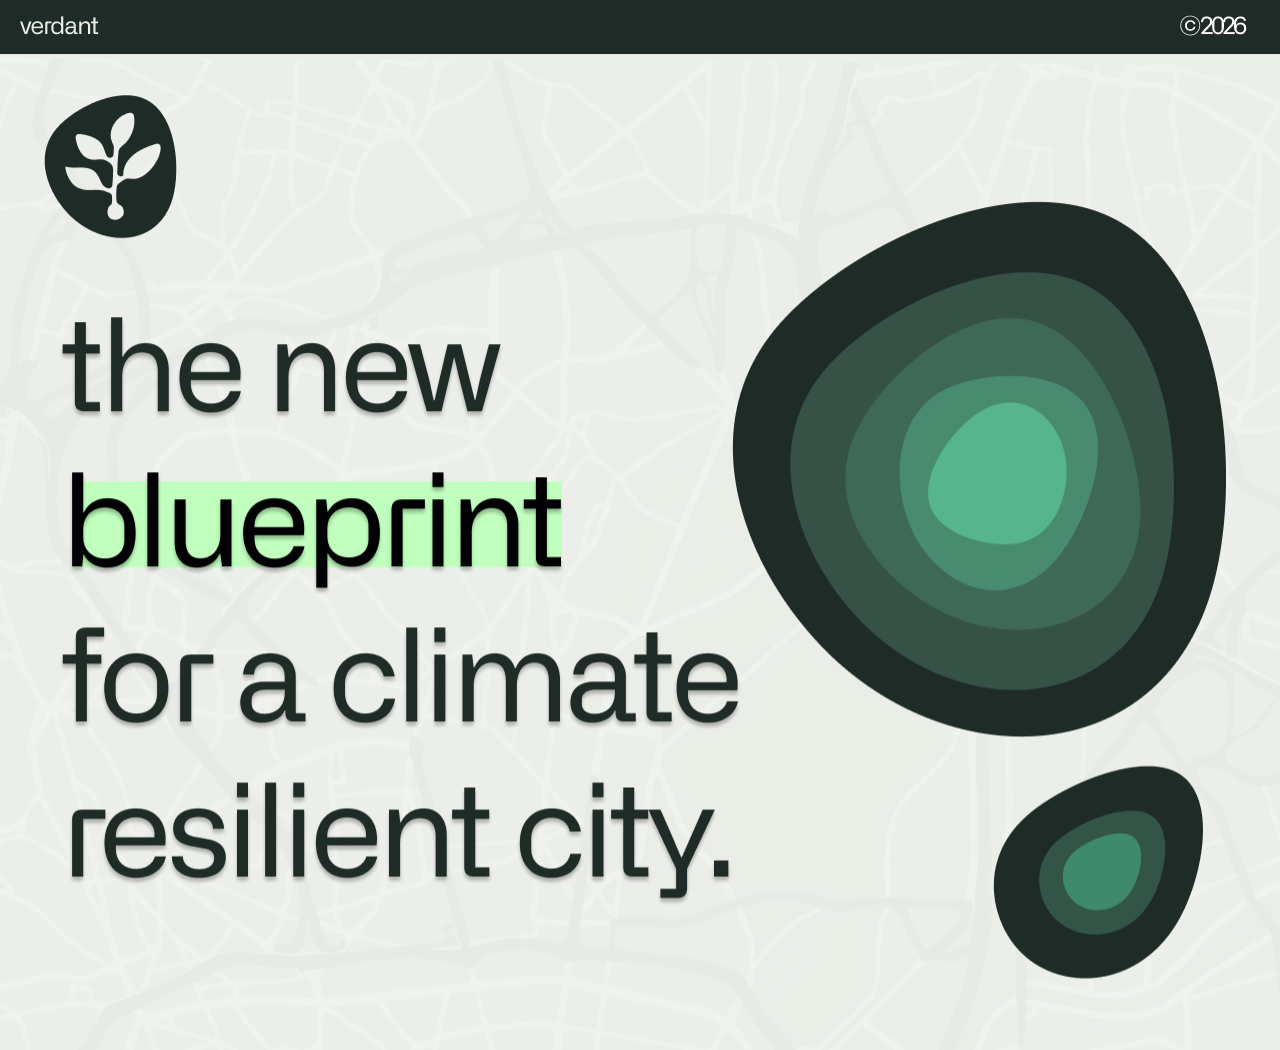
Landing Page / blueprint
-
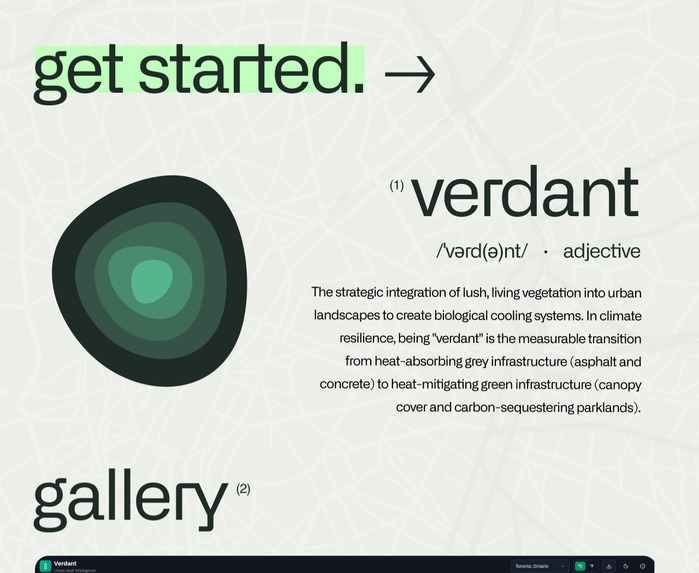
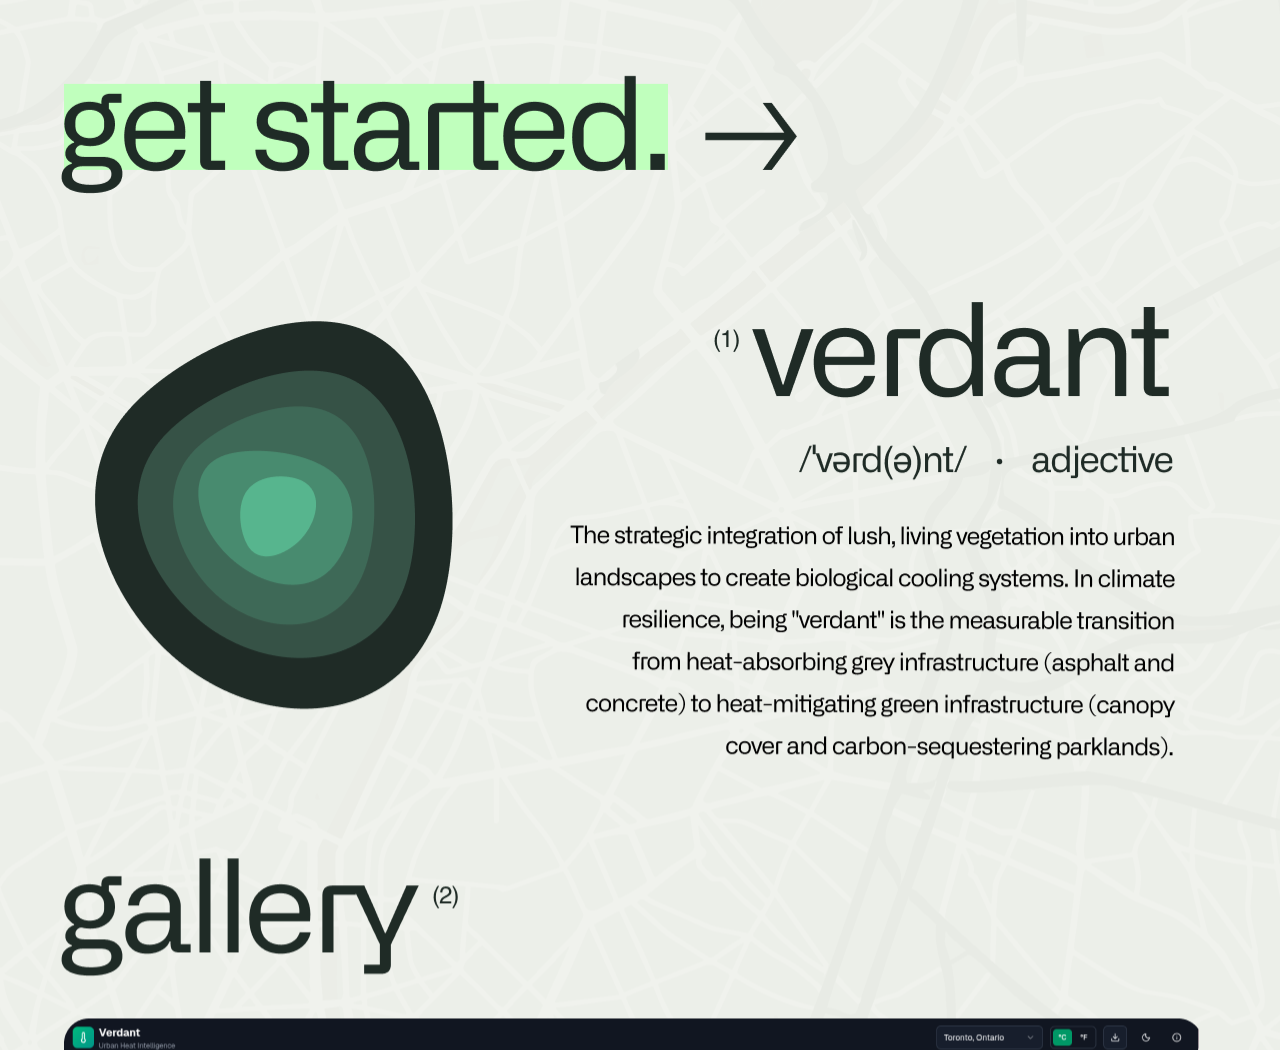
Landing Page / 'verdant'
-
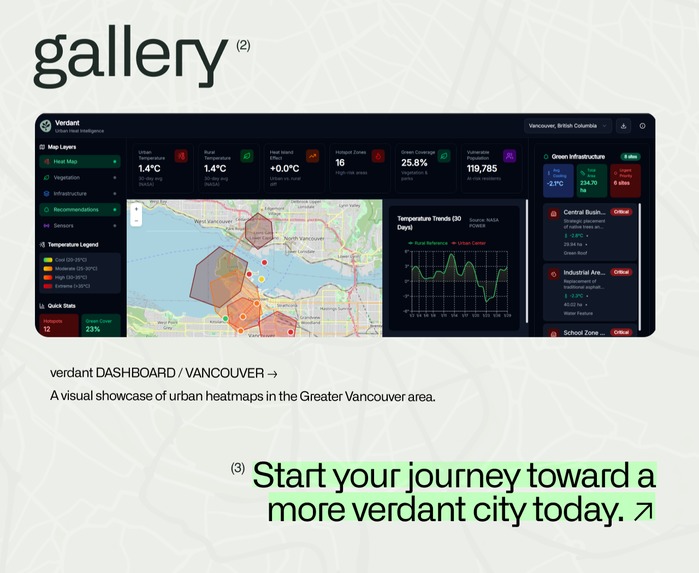
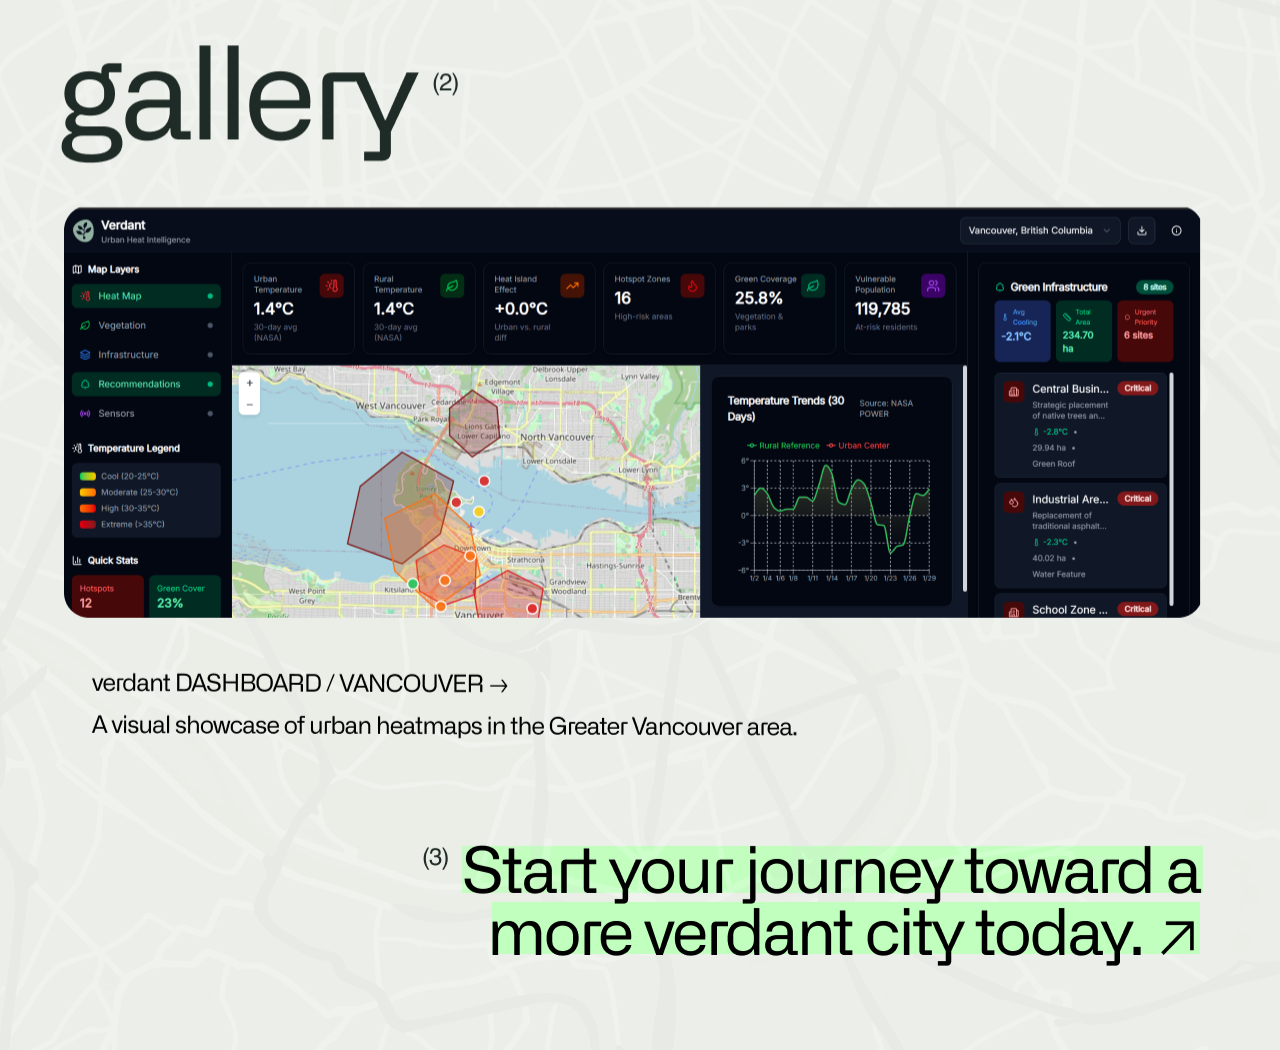
Landing Page / gallery
-
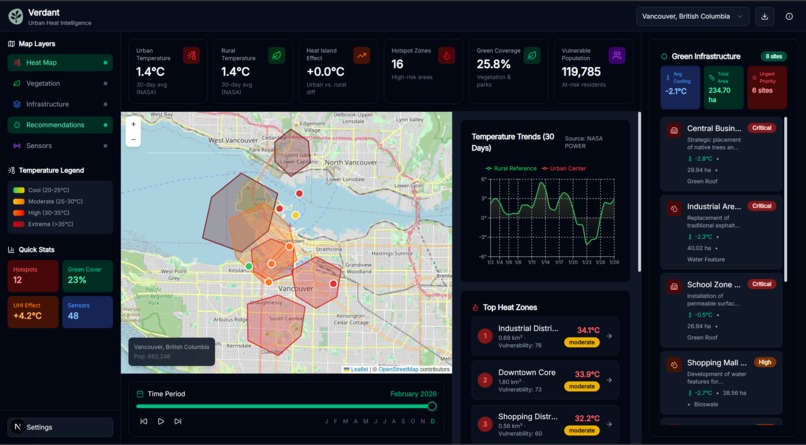
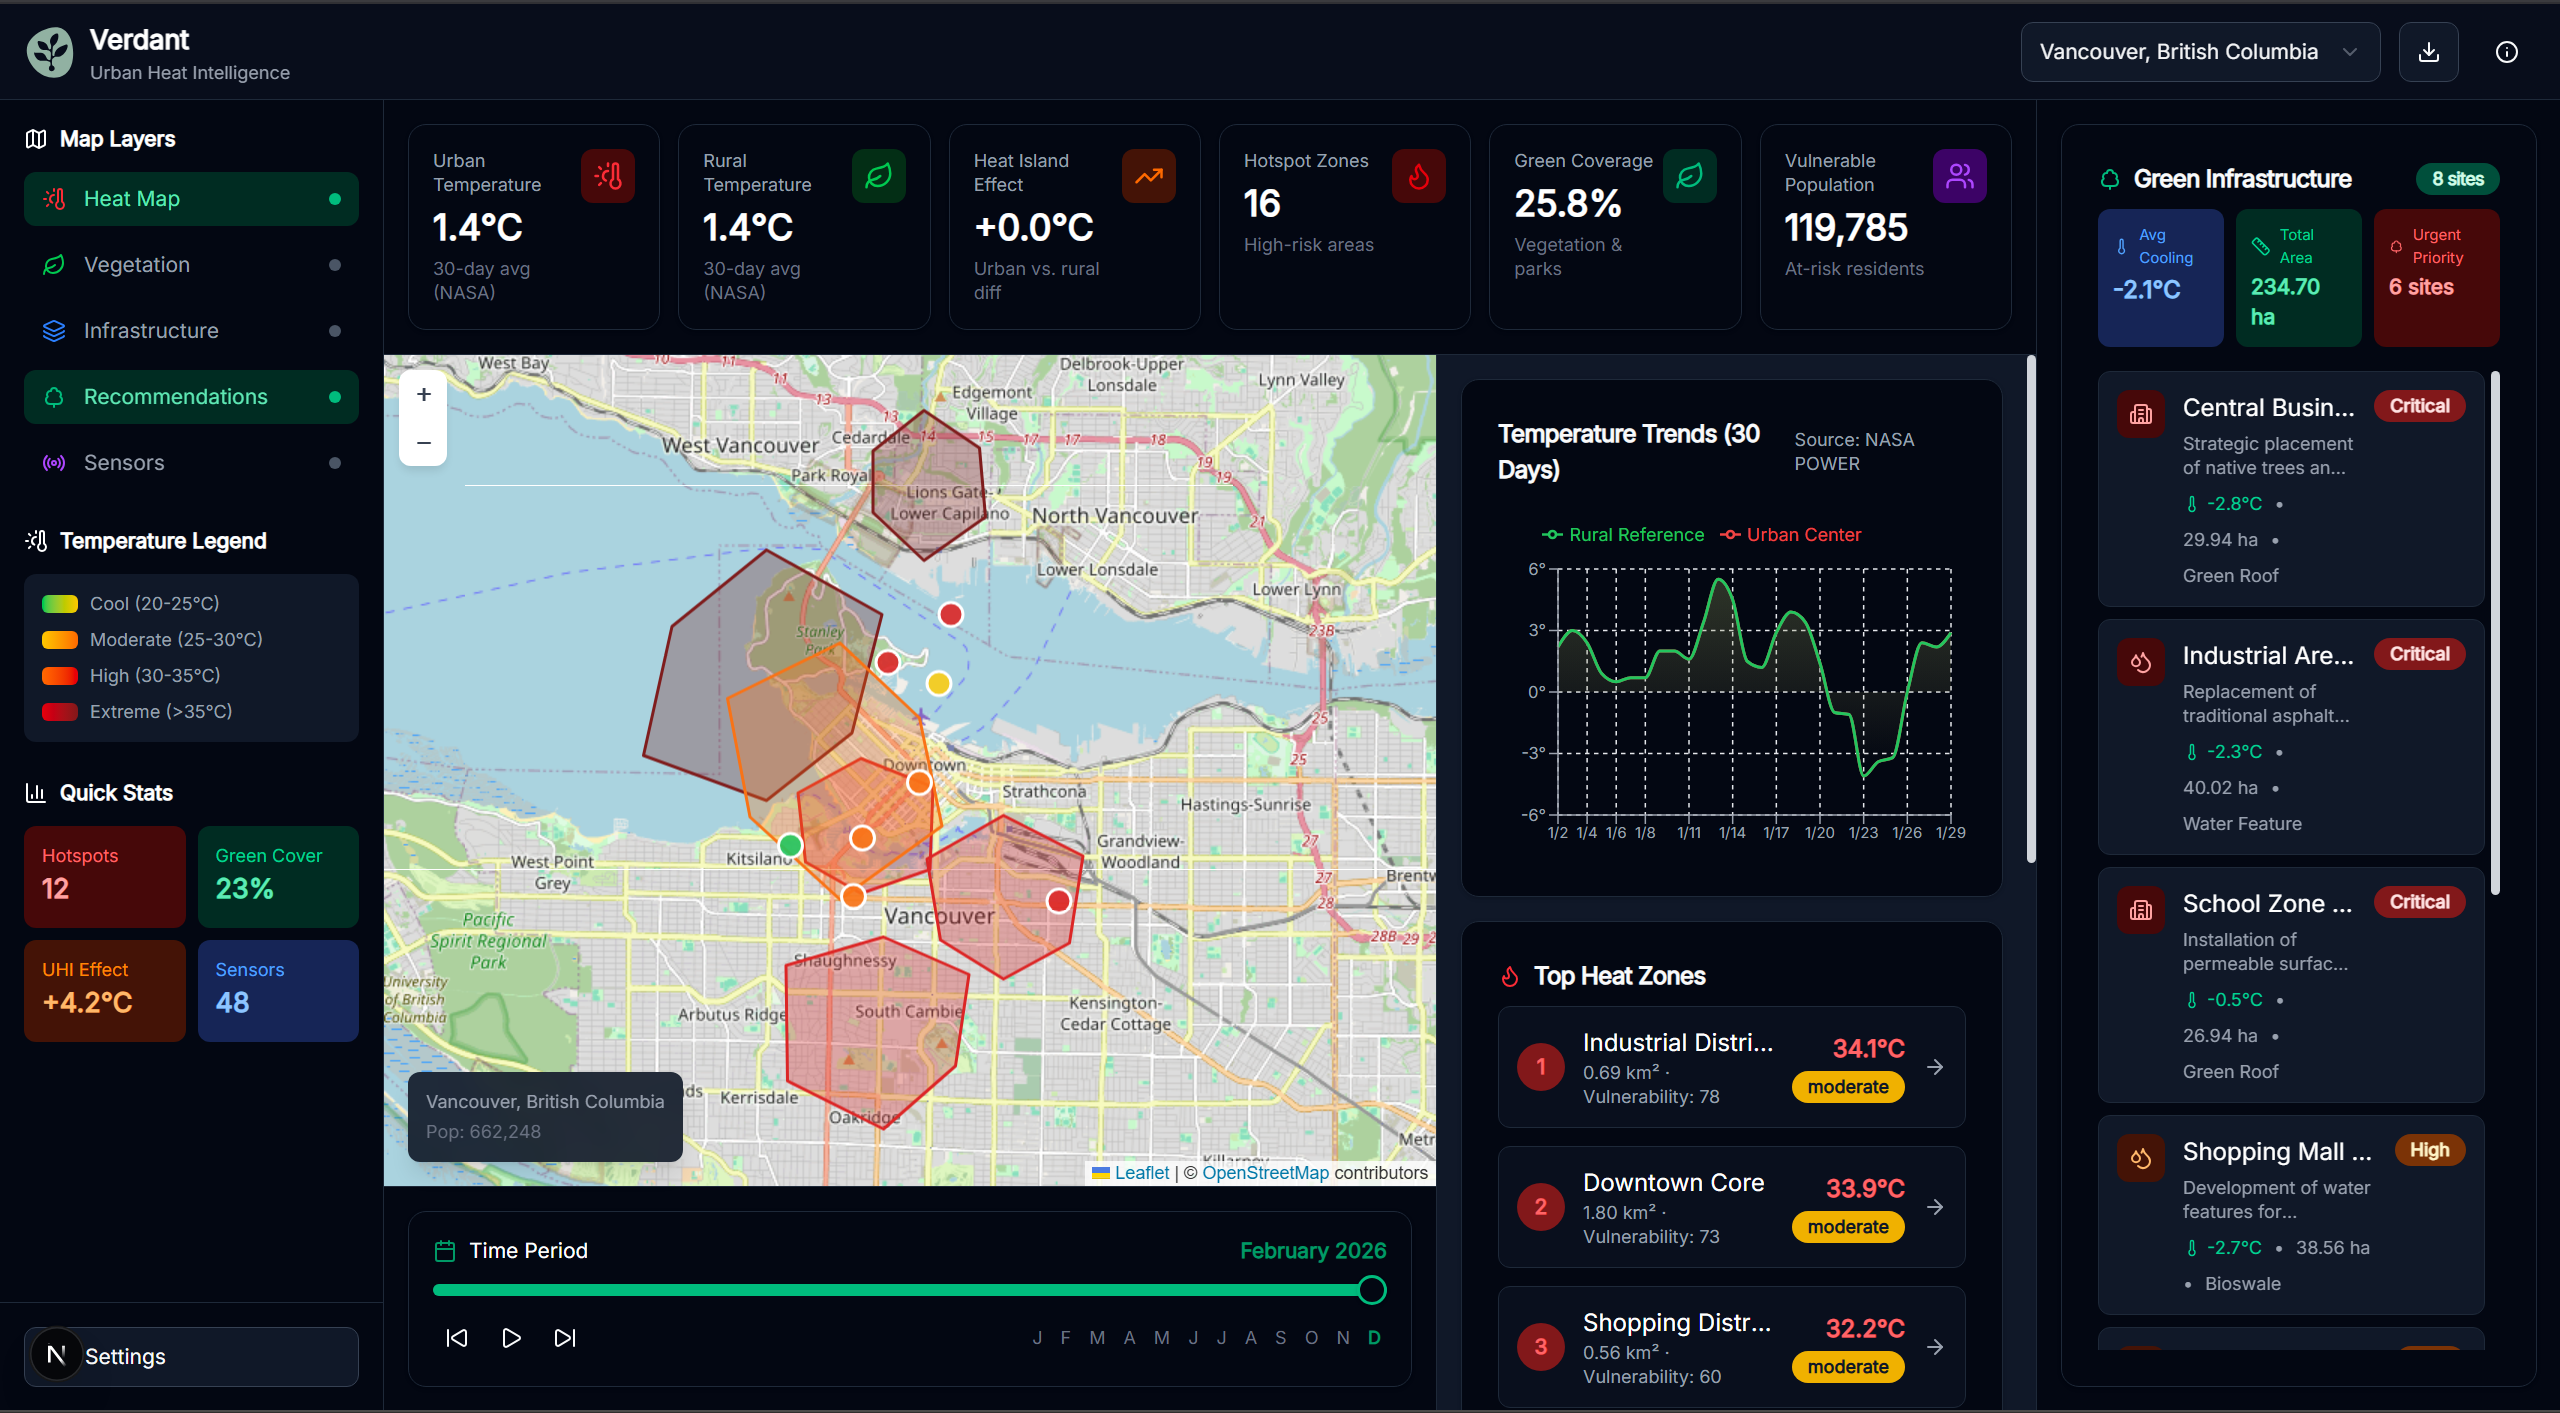
VANCOUVER, BC
-
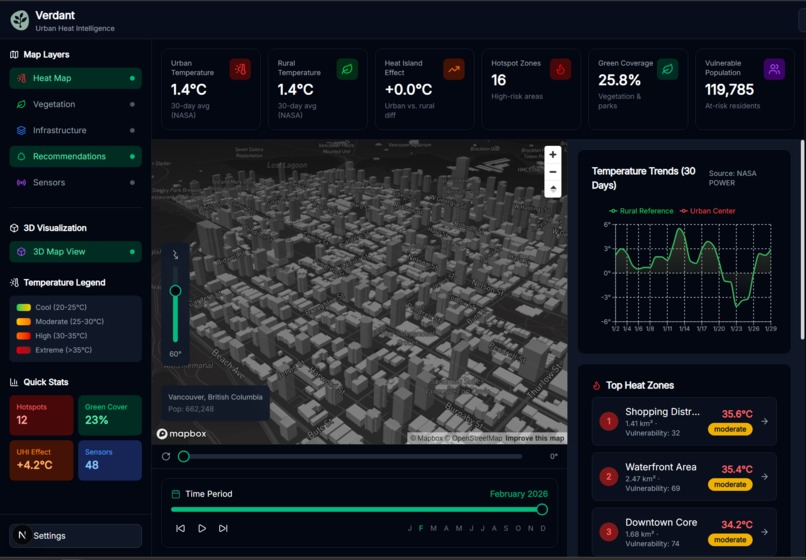
VANCOUVER / 3D (Mapbox)
-
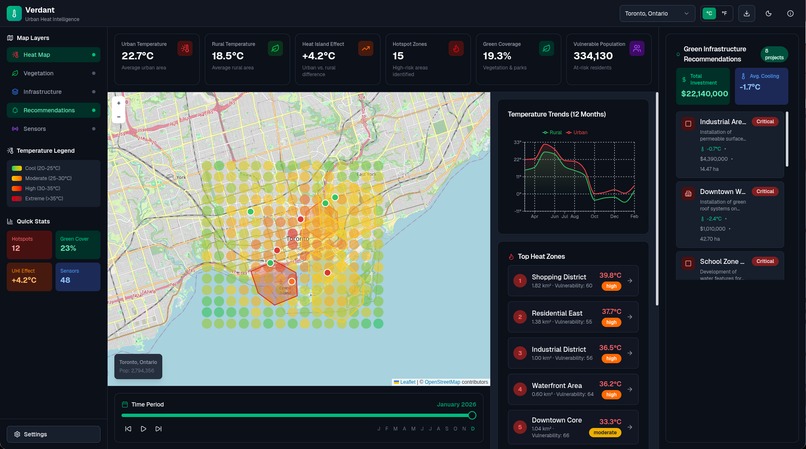
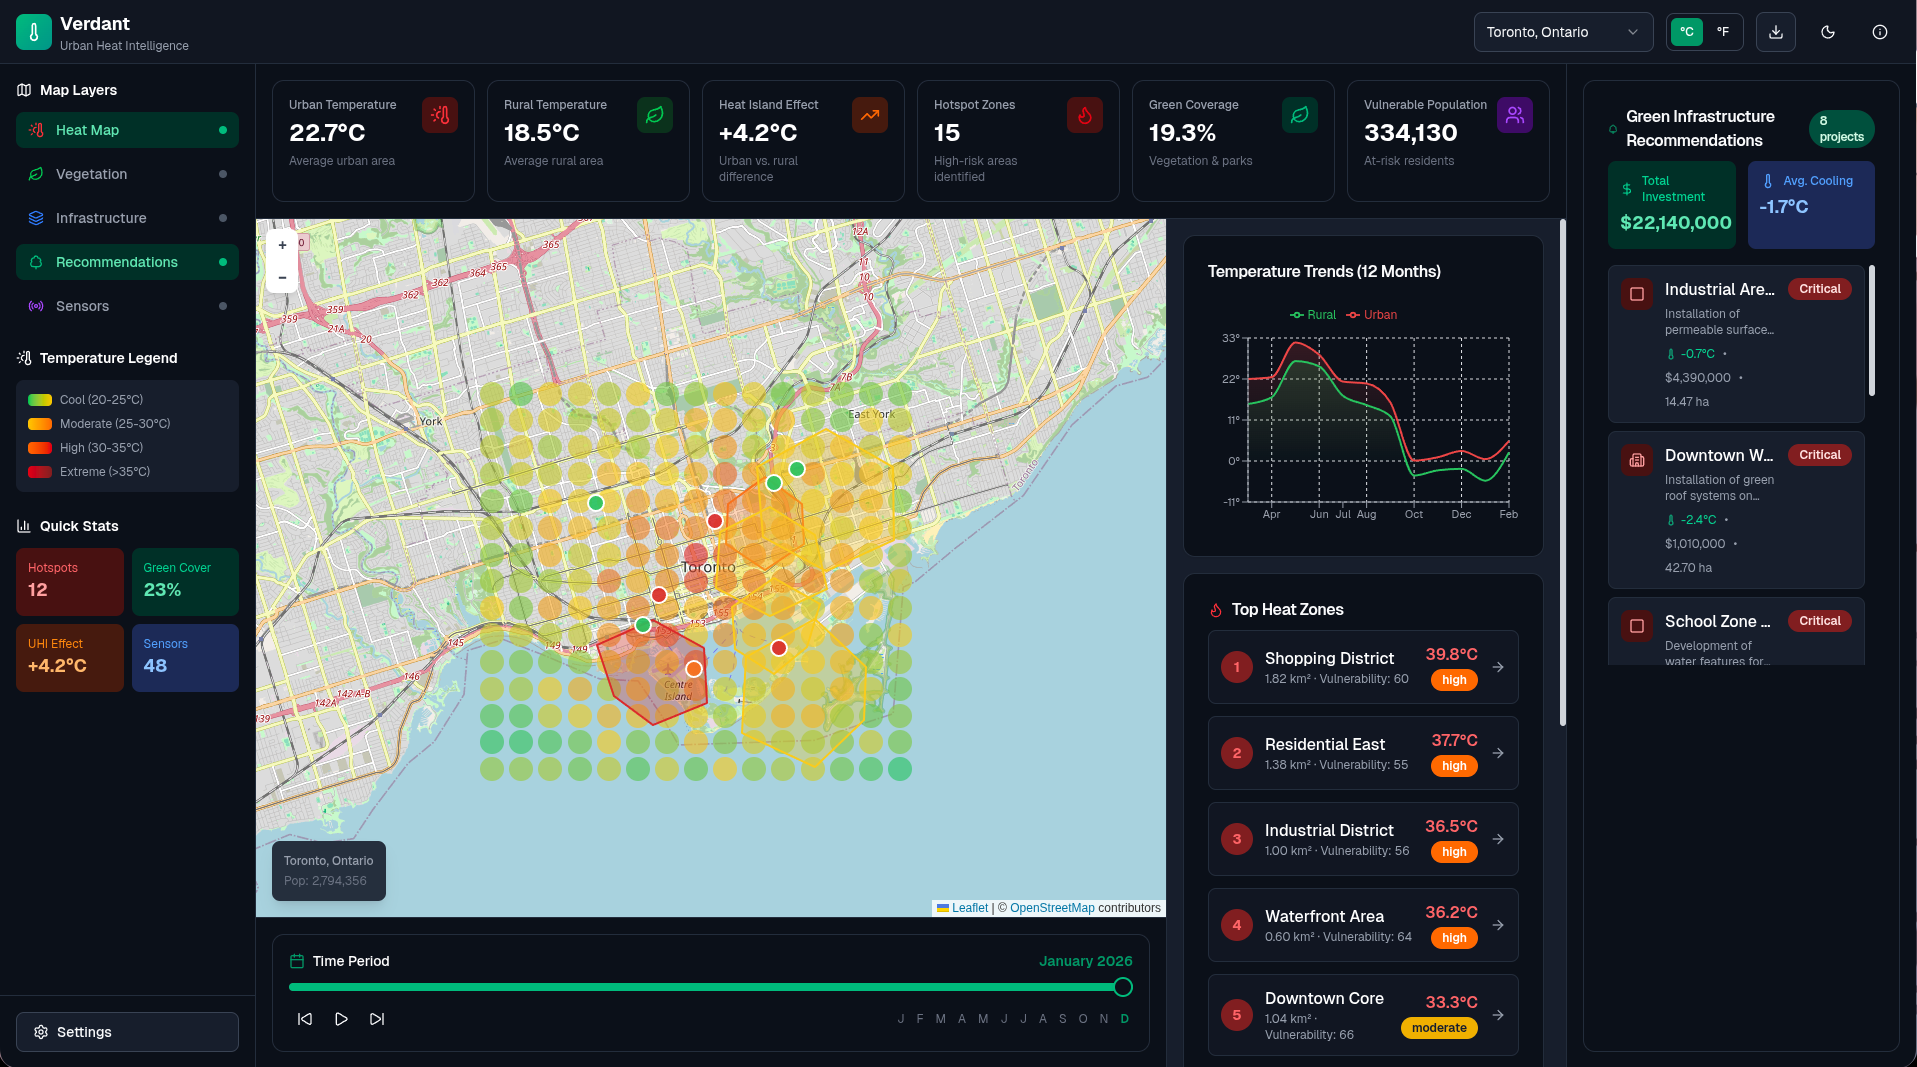
TORONTO, ON
-
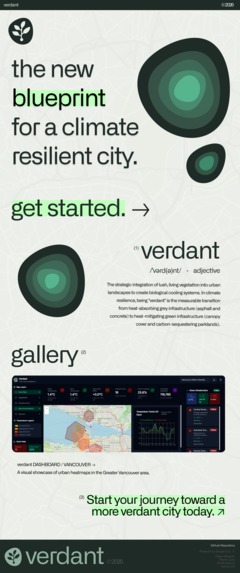
Landing Page / FULL


Inspiration
As cities are getting hotter, we were inspired by the need for a balance in the climate. Our team all grew up in resounding urban areas, and we recognized that the densely-packed concrete-filled areas continue to overwhelm the green balance of our community. We looked to find a solution for company entities to transform heat-absorbing grey infrastructure into cooling, verdant ecosystems through quantifying the cooling power of nature.
What it does
Verdant serves as a climate resilience dashboard designed for city agencies and environmental planners to manage urban temperatures. The platform analyzes open source satellite and sensor data to map urban heat islands in real time. It identifies specific locations where green infrastructure will be most effective and provides projected temperature reductions to help officials plan cooling interventions before construction begins.
How we built it
We developed the platform by leveraging AI models to parse raw environmental data from a variety of open source sources. The core of our analysis is powered by public data APIs from NASA which provide the satellite and sensor information necessary for accurate heat mapping. We built the front end as a web based dashboard that translates this complex climate data into accessible visual maps for city planners, with OpenStreetMap and Mapbox for map visualization.
Challenges we ran into
The biggest hurdle was "data noise." Satellite data can be messy, and merging it with ground-level sensor data required significant fine-tuning of our AI. We also worked hard to ensure our temperature reduction projections were grounded in environmental science rather than just being optimistic estimates.
On a team level, we faced the challenge of making "big data" feel personal. We had to iterate on our dashboard UI multiple times to move away from confusing spreadsheets and toward simple, applicable visuals that the average person could understand. Code wise, managing large datasets in real time was a performance challenge that we overcame by optimizing our data processing pipeline to keep the dashboard fast and responsive.
What we learned
Through this project we learned that many cities lack the accessible data tools needed for rapid climate adaptation. By making this information beginner friendly, we realized we could significantly lower the barrier for both businesses and citizens to participate in cooling strategies. We also gained extensive experience in processing geospatial data and coordinating a multidisciplinary team to turn raw numbers into a functional, beautiful tool.
What's next for verdant
The next phase for Verdant focuses on global expansion and possibly moving toward a business to customer scale. We want to refine our dashboard UI to make it even more applicable for everyday residents to track heat in their own backyards. Beyond heat, we plan to include air quality and flood resilience metrics. Our goal is to create a global urban operating system that helps every city on earth move from a concrete heavy past toward a truly verdant and resilient future.
Built With
- adobe-illustrator
- figma
- mapbox
- next.js
- radix-ui
- react
- tailwind
- tanstack-query
- zustand


Log in or sign up for Devpost to join the conversation.