Inspiration
Floods can damage infrastructure and disrupt road connectivity, making it difficult for disaster response teams to understand which areas may need attention. We wanted to build a practical tool that combines satellite imagery, AI, and geographic data to turn flood observations into useful response insights.
What It Does
VantageQ is a satellite-powered flood intelligence prototype developed for Track B: Mapping Flood Damage from Space.
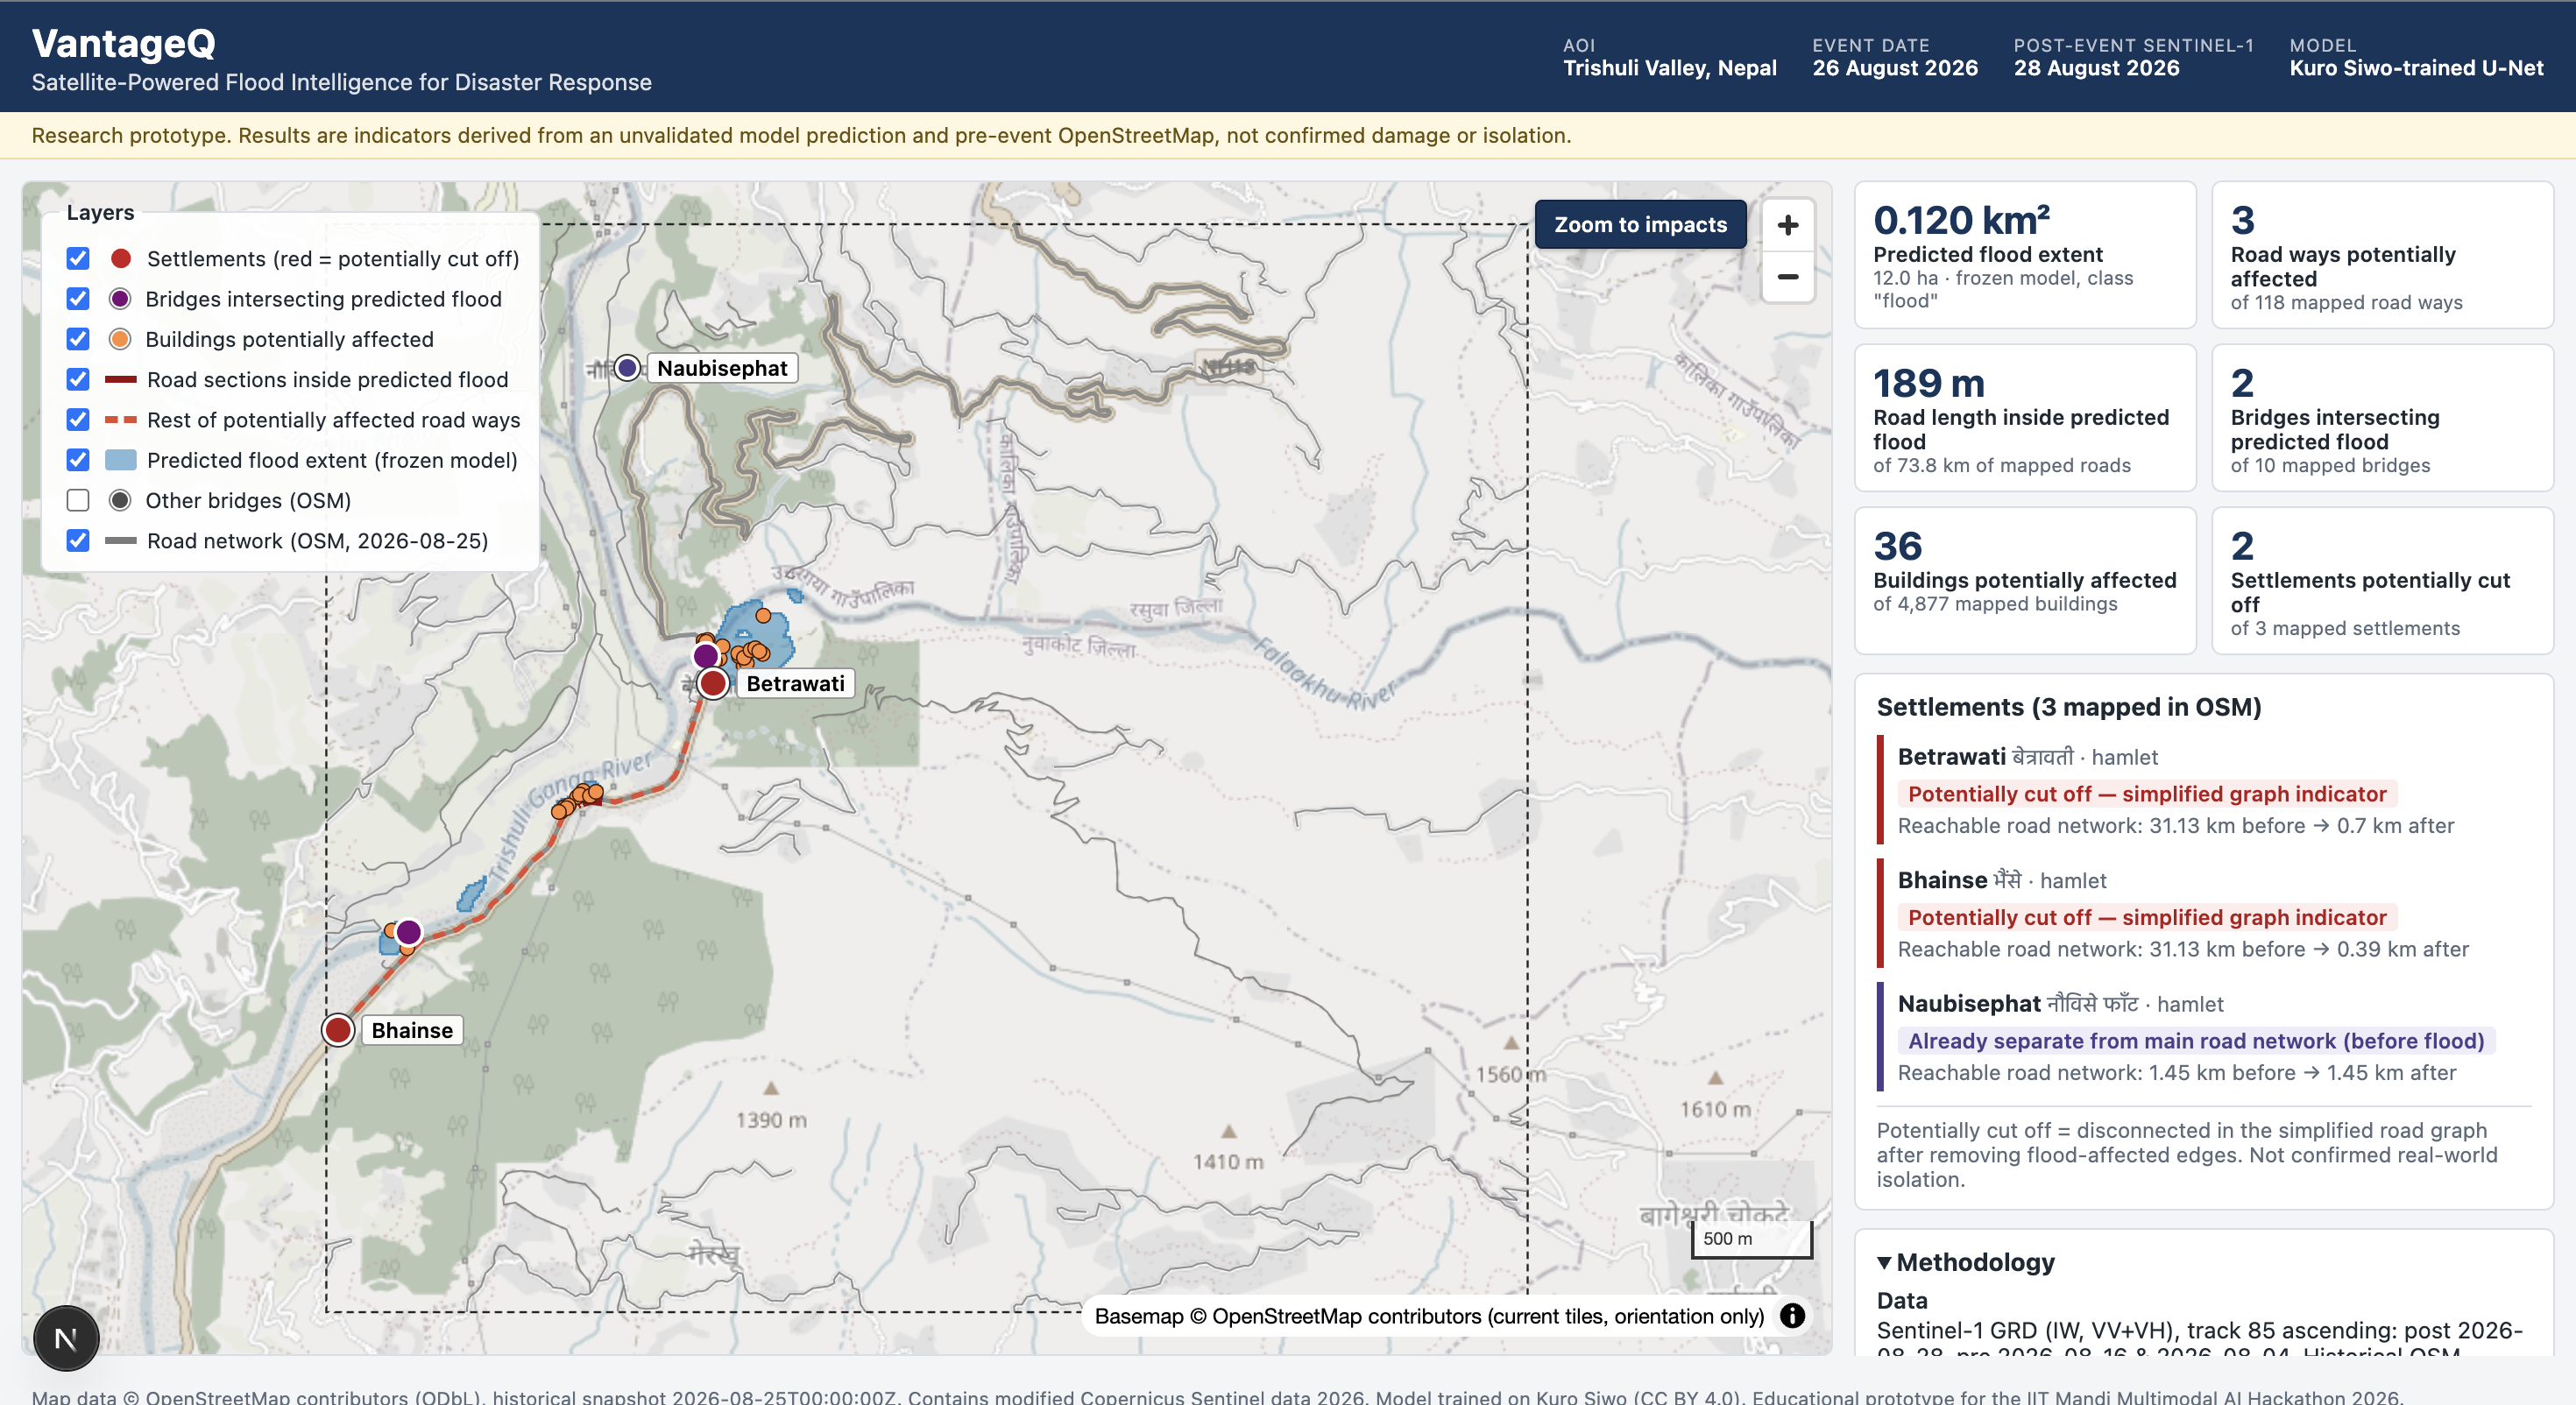
It combines Sentinel-1 radar imagery from before and after a flood with an AI flood-segmentation model trained on the Kuro Siwo dataset. It overlays the predicted flood extent with historical OpenStreetMap roads, bridges, and buildings, then uses NetworkX to identify settlements that may be disconnected from the main road network.
The results are presented through an interactive dashboard, supported by a one-page situation report and a technical report.
How We Built It
We built a geospatial pipeline to process satellite observations, prepare consistent model inputs, run flood segmentation using a U-Net model in PyTorch, and analyze the resulting flood map alongside infrastructure data.
The dashboard was developed using Next.js, React, TypeScript, and MapLibre GL JS. GeoPandas, Rasterio, Shapely, and NetworkX support the geospatial and connectivity analysis.
We evaluated the model on held-out Kuro Siwo test events and applied the pipeline to a sub-area of Nepal's Trishuli Valley around the August 26, 2026 flood event.
Results
For the Trishuli demonstration area, the model predicted approximately 0.120 km² of flood extent. The analysis identified 3 road segments covering 189 metres, 2 bridges, and 36 buildings intersecting the predicted flood area. Connectivity analysis flagged 2 of the 3 mapped settlements as potentially cut off.
On held-out Kuro Siwo test data, the model achieved a flood Intersection over Union (IoU) of 0.307 and an F1 score of 0.470.
These Trishuli results are preliminary and have not been validated against local ground truth.
Challenges and What We Learned
One major challenge was aligning satellite imagery and geospatial features so that the flood predictions and infrastructure layers could be compared consistently. We also learned that radar imagery can produce false positives and that a predicted flood overlap does not prove that infrastructure is damaged.
The project taught us the importance of evaluating AI models on held-out data, communicating uncertainty, using historical infrastructure data, and distinguishing potential connectivity loss from confirmed real-world isolation.
Limitations and Future Work
VantageQ is a prototype demonstrated on a defined study area. Its predictions depend on satellite conditions, model generalization, infrastructure data completeness, and simplified road-network assumptions. Future work could include independent ground-truth validation, testing across additional flood events, and more detailed terrain-based analysis.
Responsible AI and Data Use
Published disaster damage maps are not used as production inputs. The system labels flood extent and infrastructure exposure as predictions rather than confirmed damage. AI-assisted development is disclosed in the repository README.
Project Links
- Source code: https://github.com/techgeekfest-cyber/VantageQ
- Situation report: https://github.com/techgeekfest-cyber/VantageQ/blob/main/docs/output/VantageQ_Trishuli_Situation_Report.pdf
- Technical report: https://github.com/techgeekfest-cyber/VantageQ/blob/main/docs/output/VantageQ_Final_Hackathon_Report.pdf
Built With
- claude-code
- computer-vision
- deep-learning
- geopandas
- geospatial-analysis
- github
- kuro-siwo
- machine-learning
- maplibre-gl-js
- networkx
- next.js
- openstreetmap
- python
- pytorch
- rasterio
- react
- remote-sensing
- satellite-imagery
- sentinel-1
- shapely
- typescript
- u-net

Log in or sign up for Devpost to join the conversation.