-
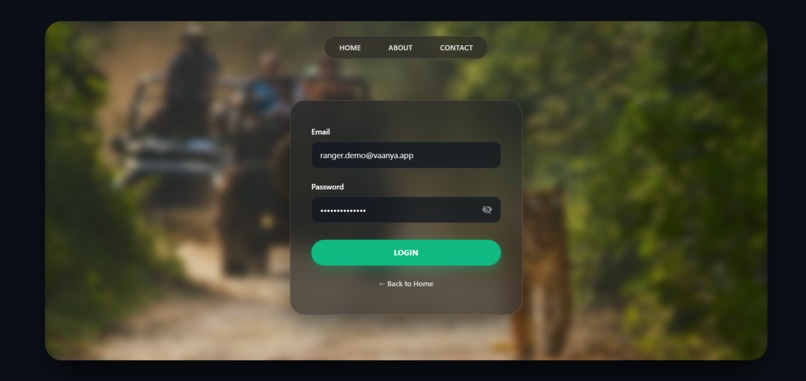
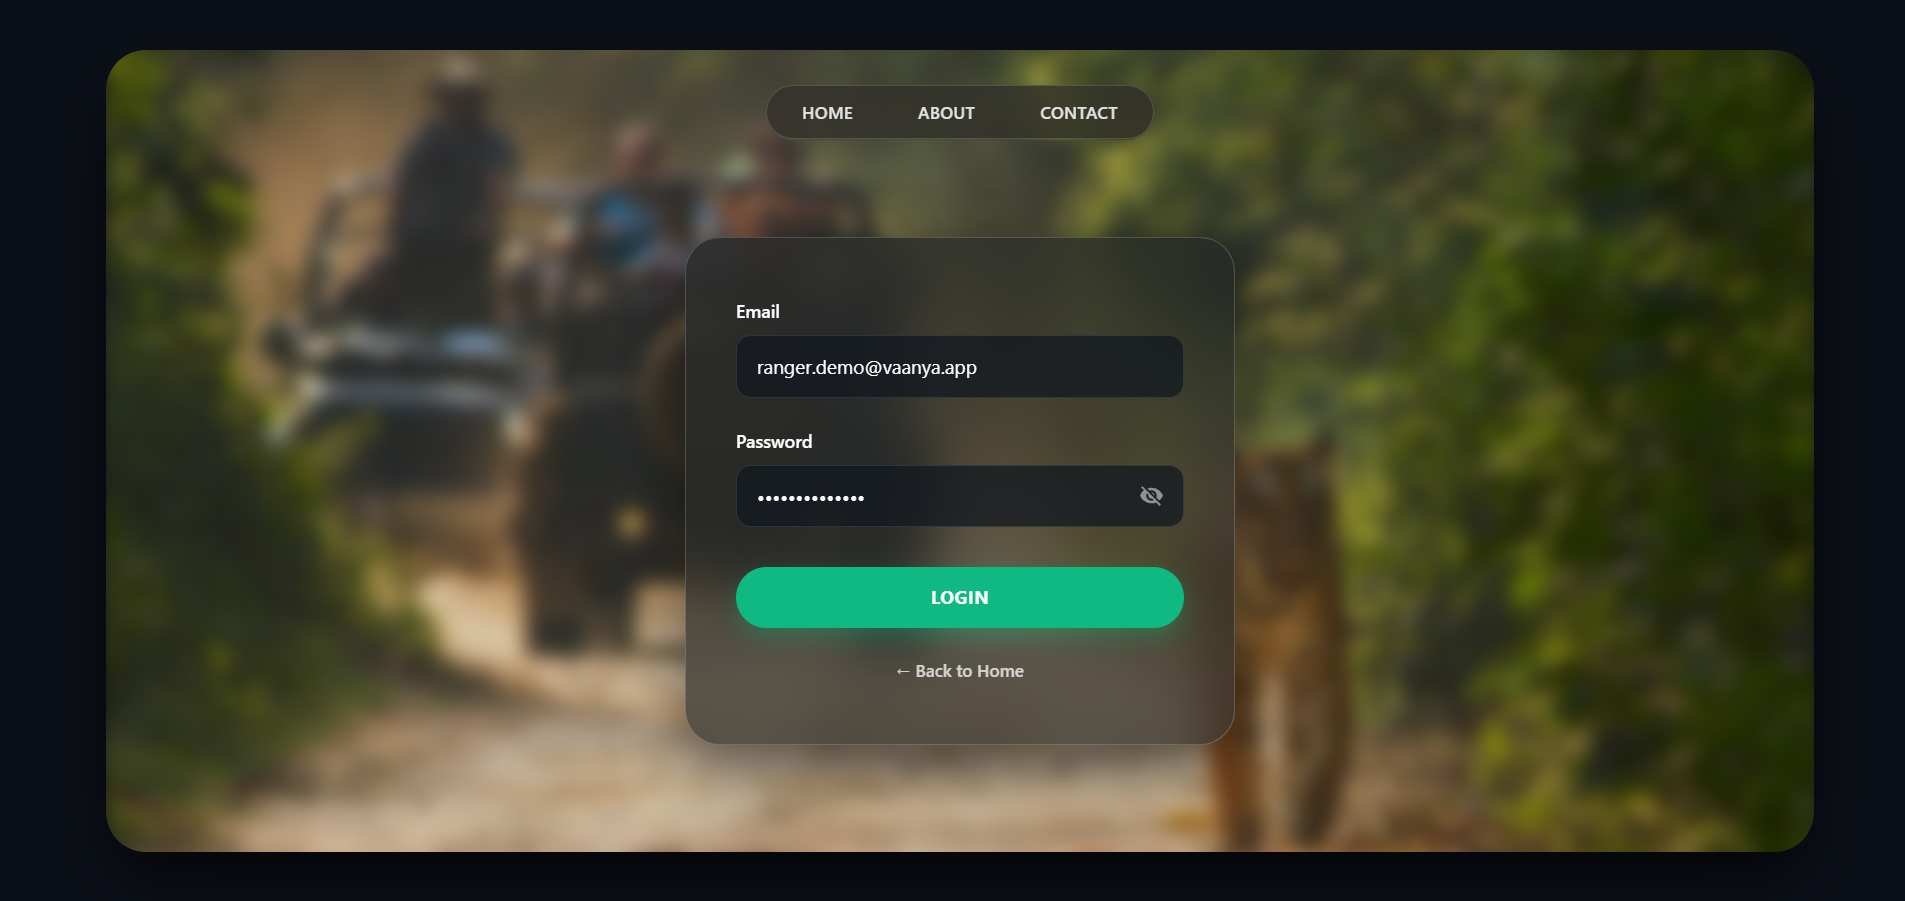
Login screen for rangers and NGO partners — secured with role-based access.
-
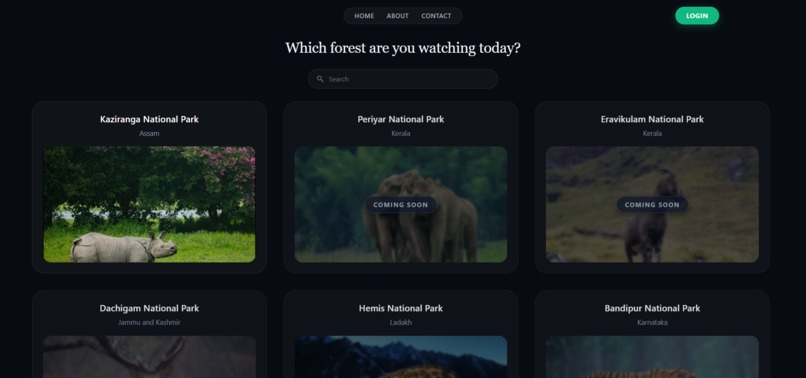
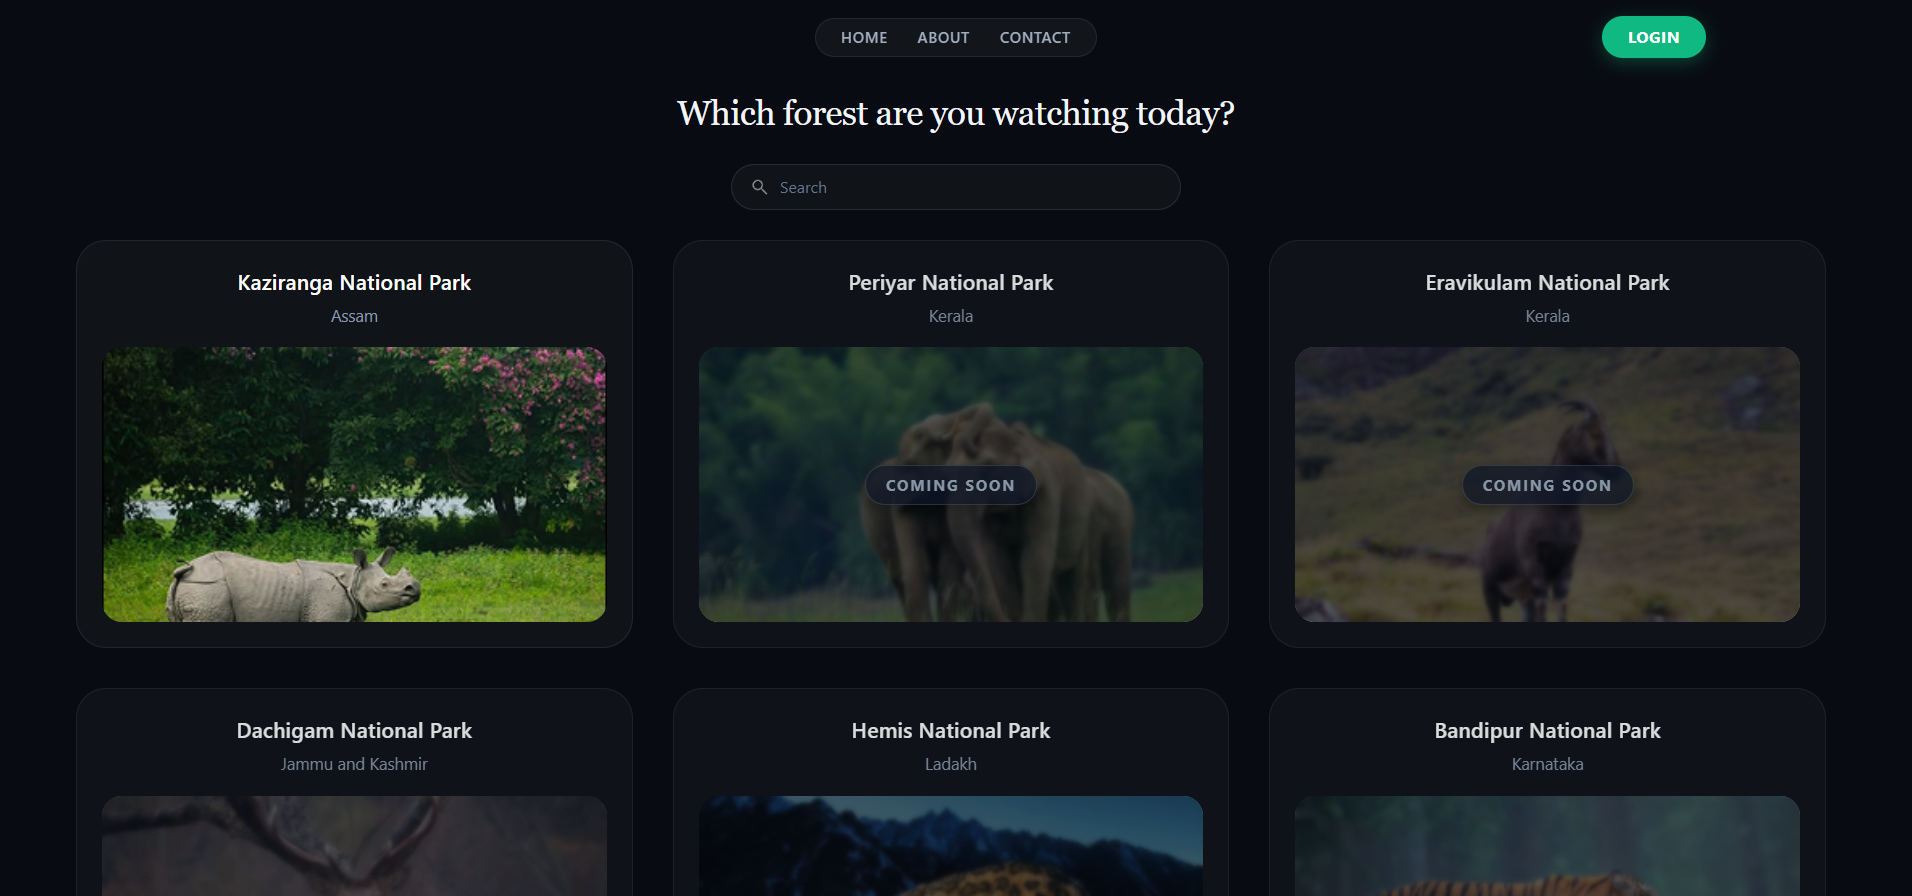
Choose your park — built to scale beyond Kaziranga to any protected area.
-
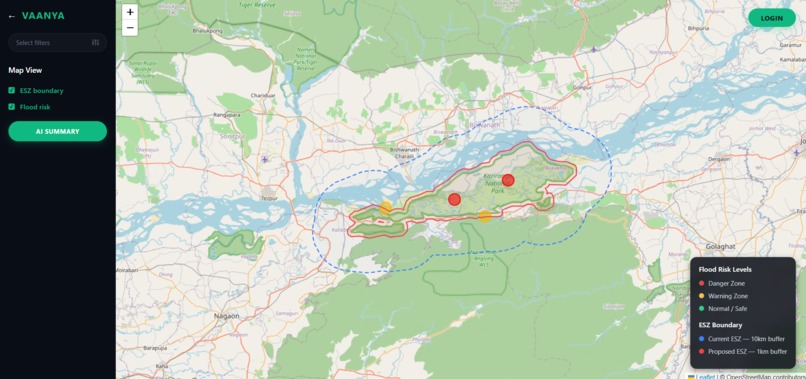
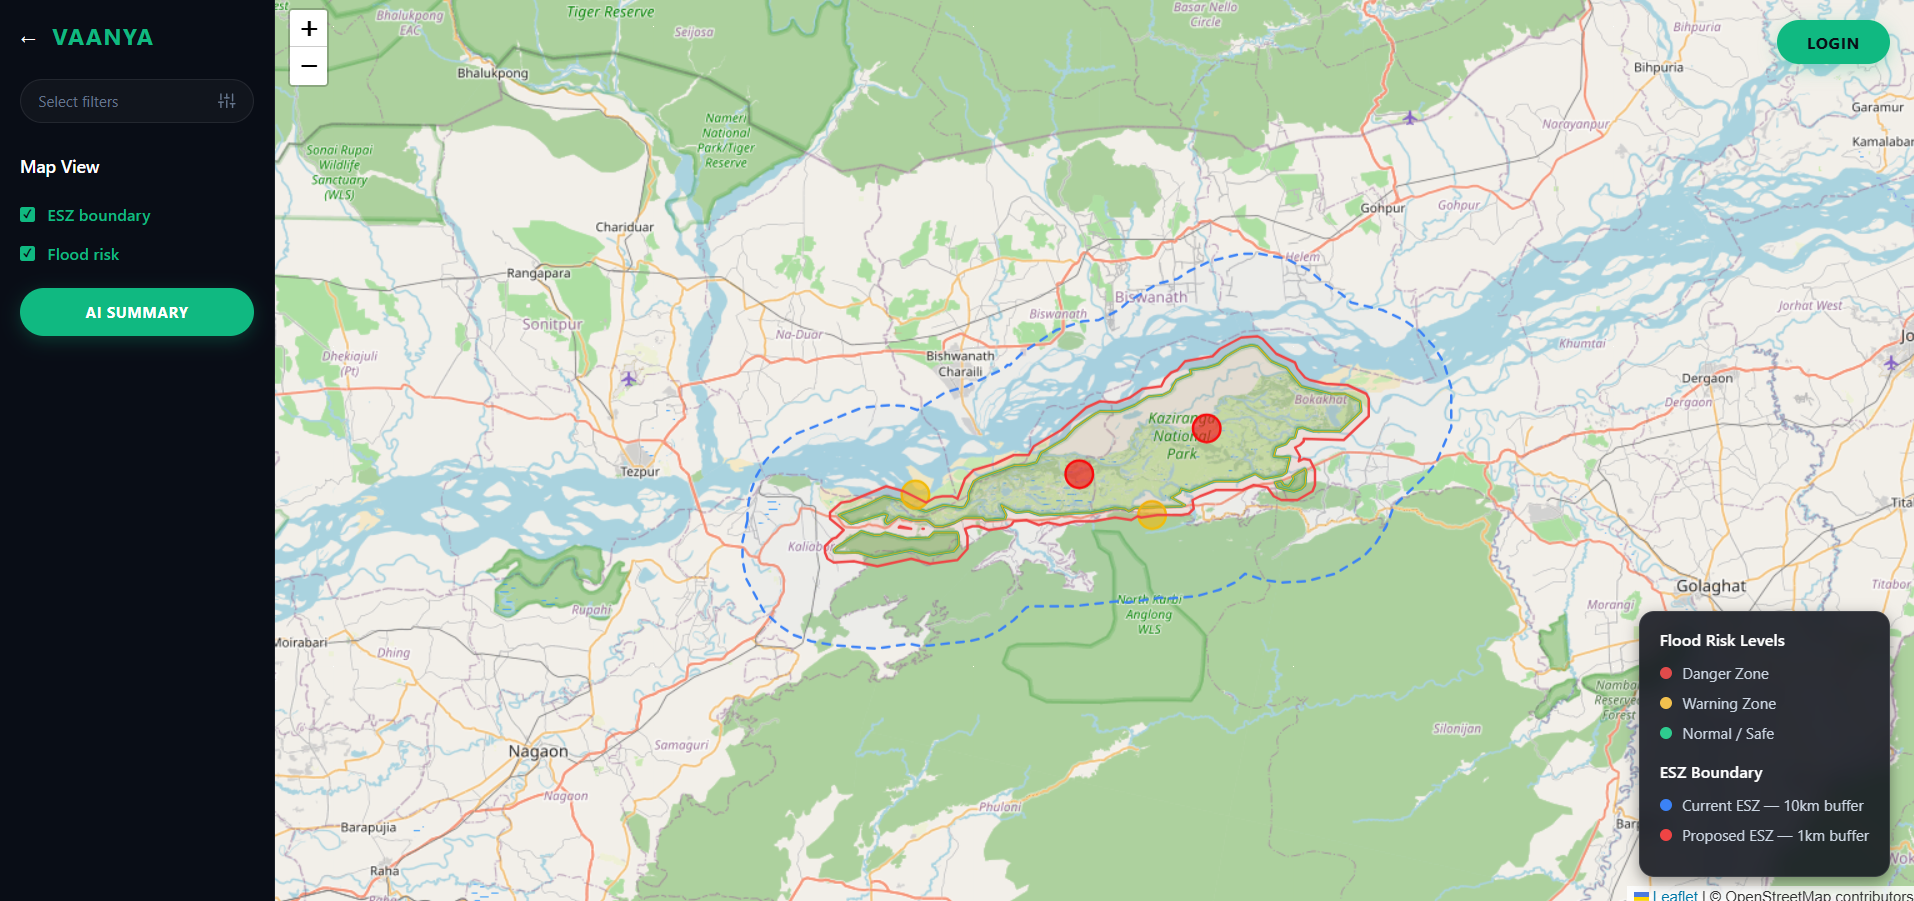
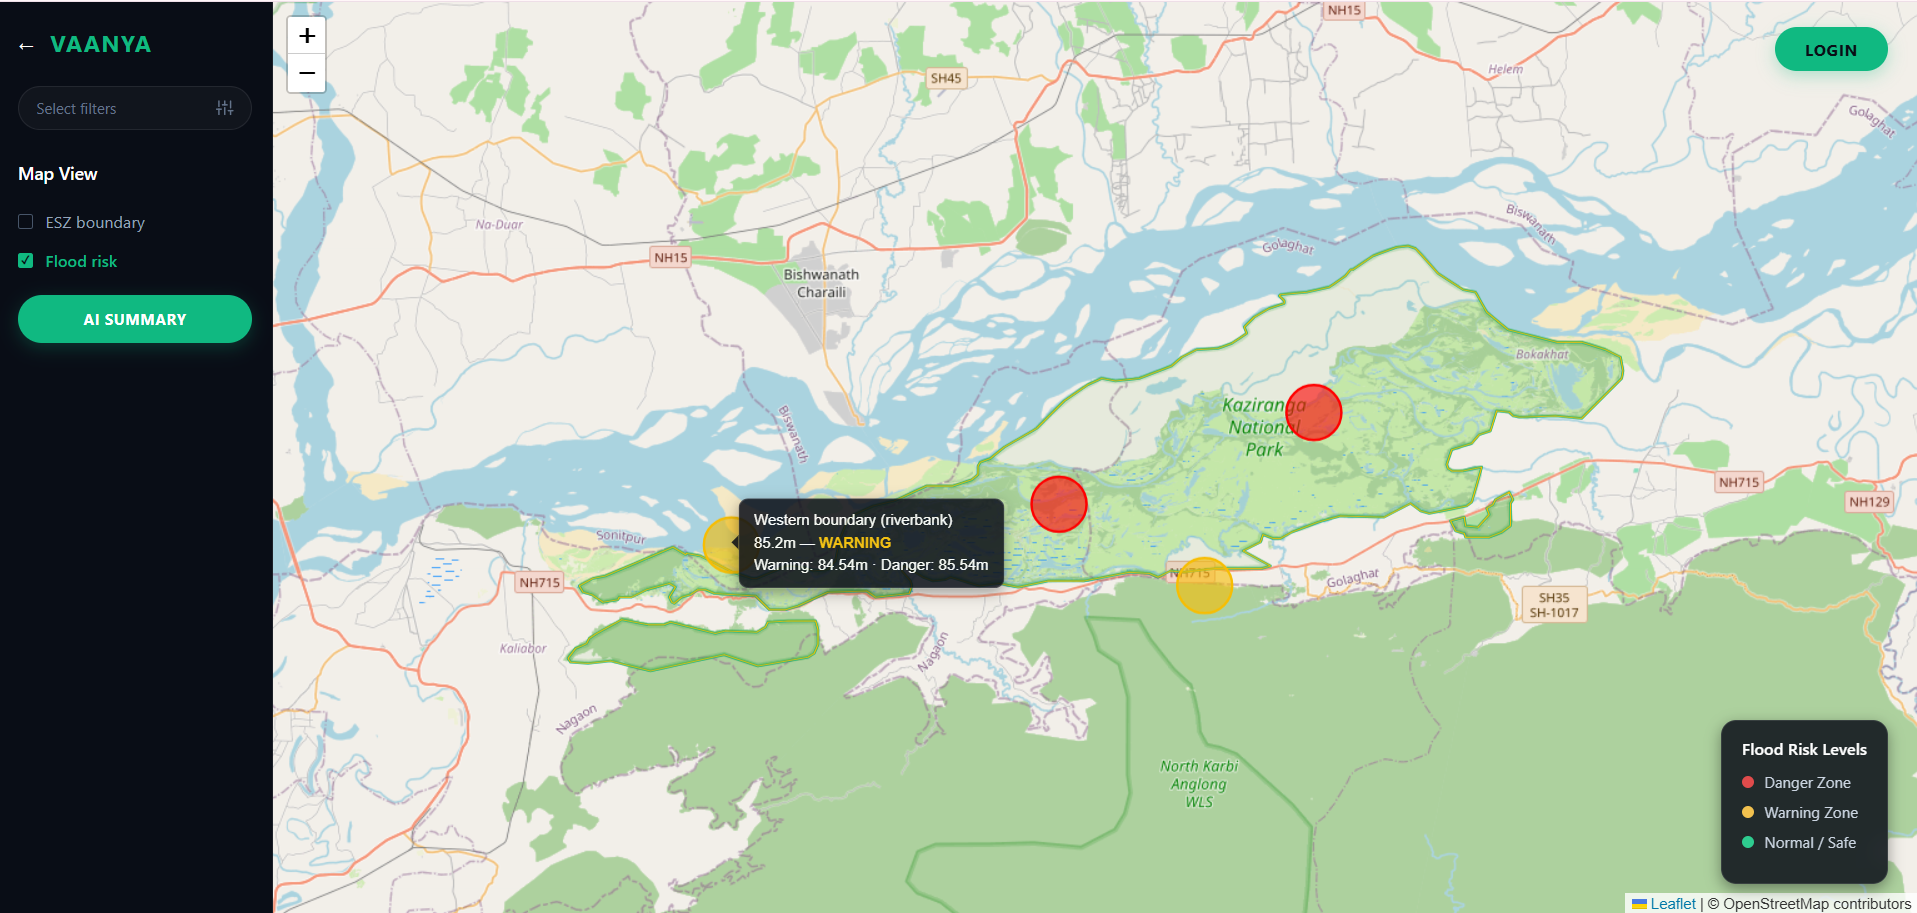
Real-time park boundary and incident zones, pulled from live OpenStreetMap data.
-
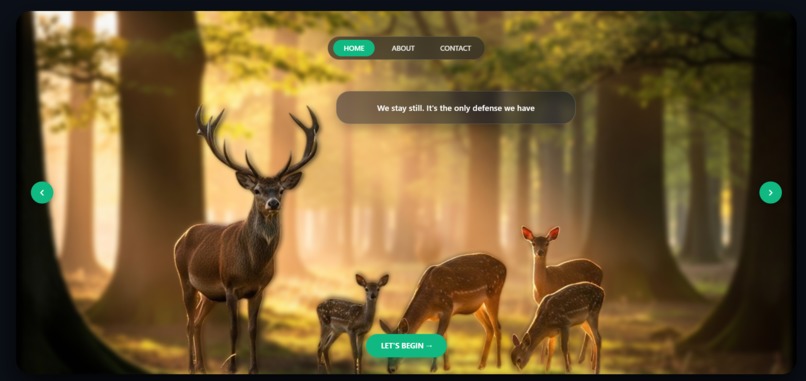
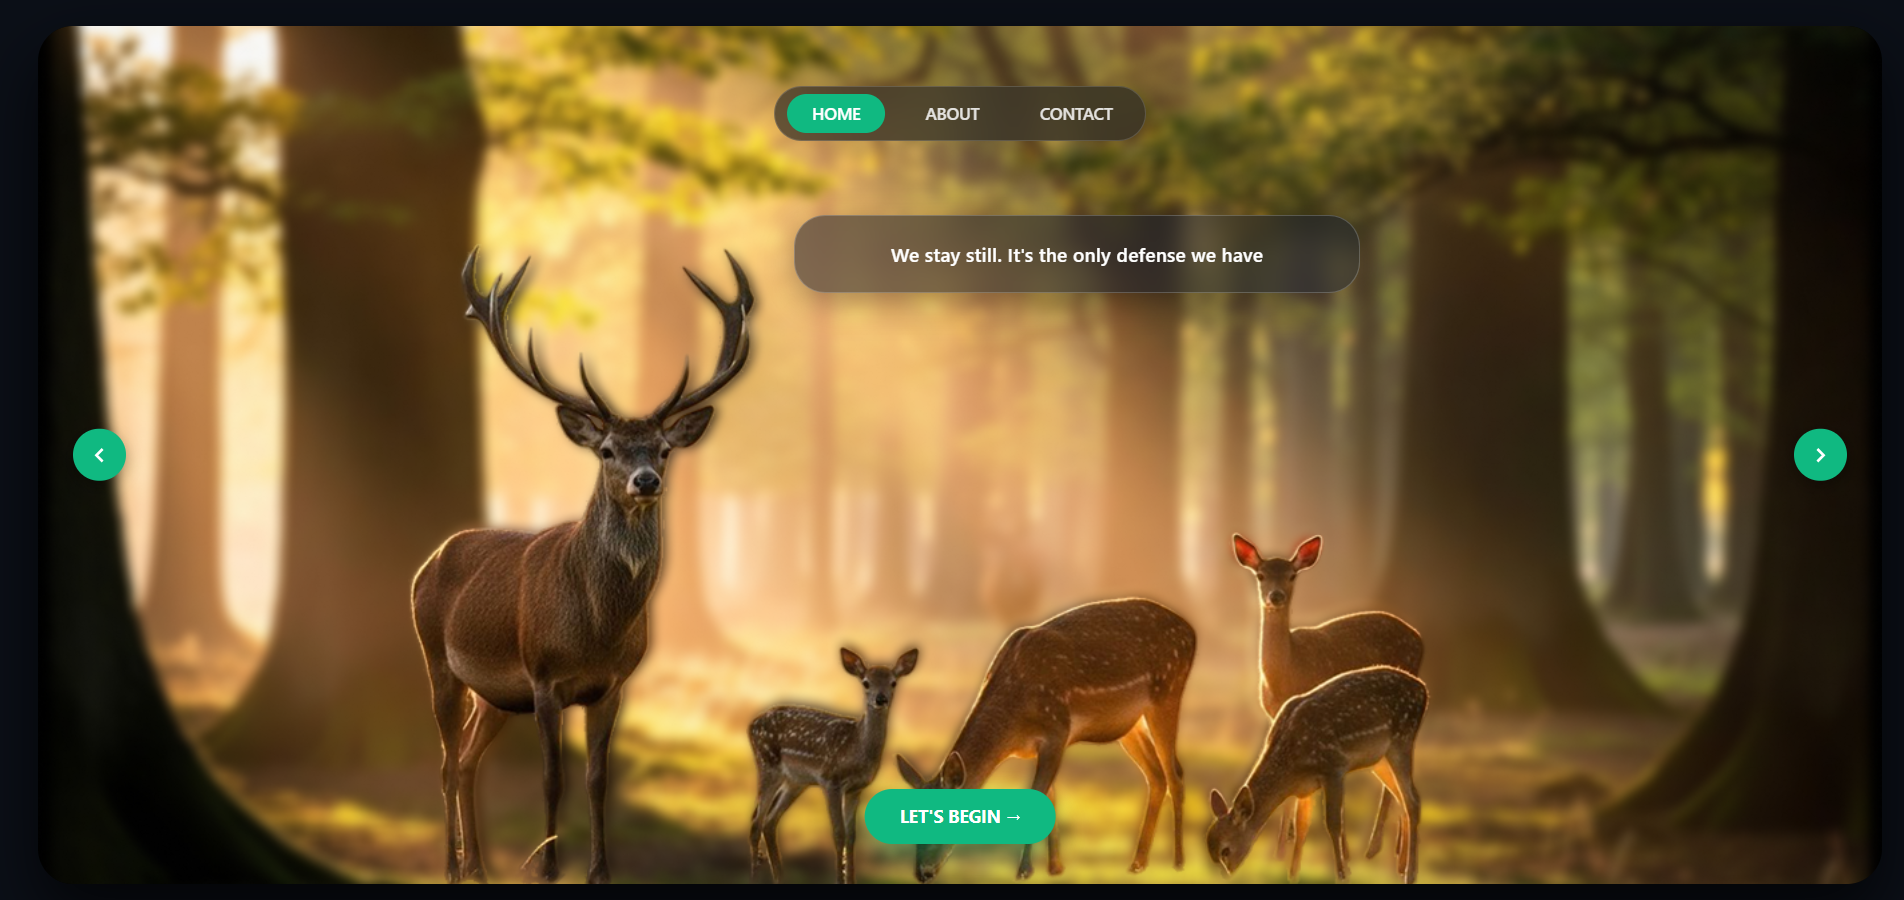
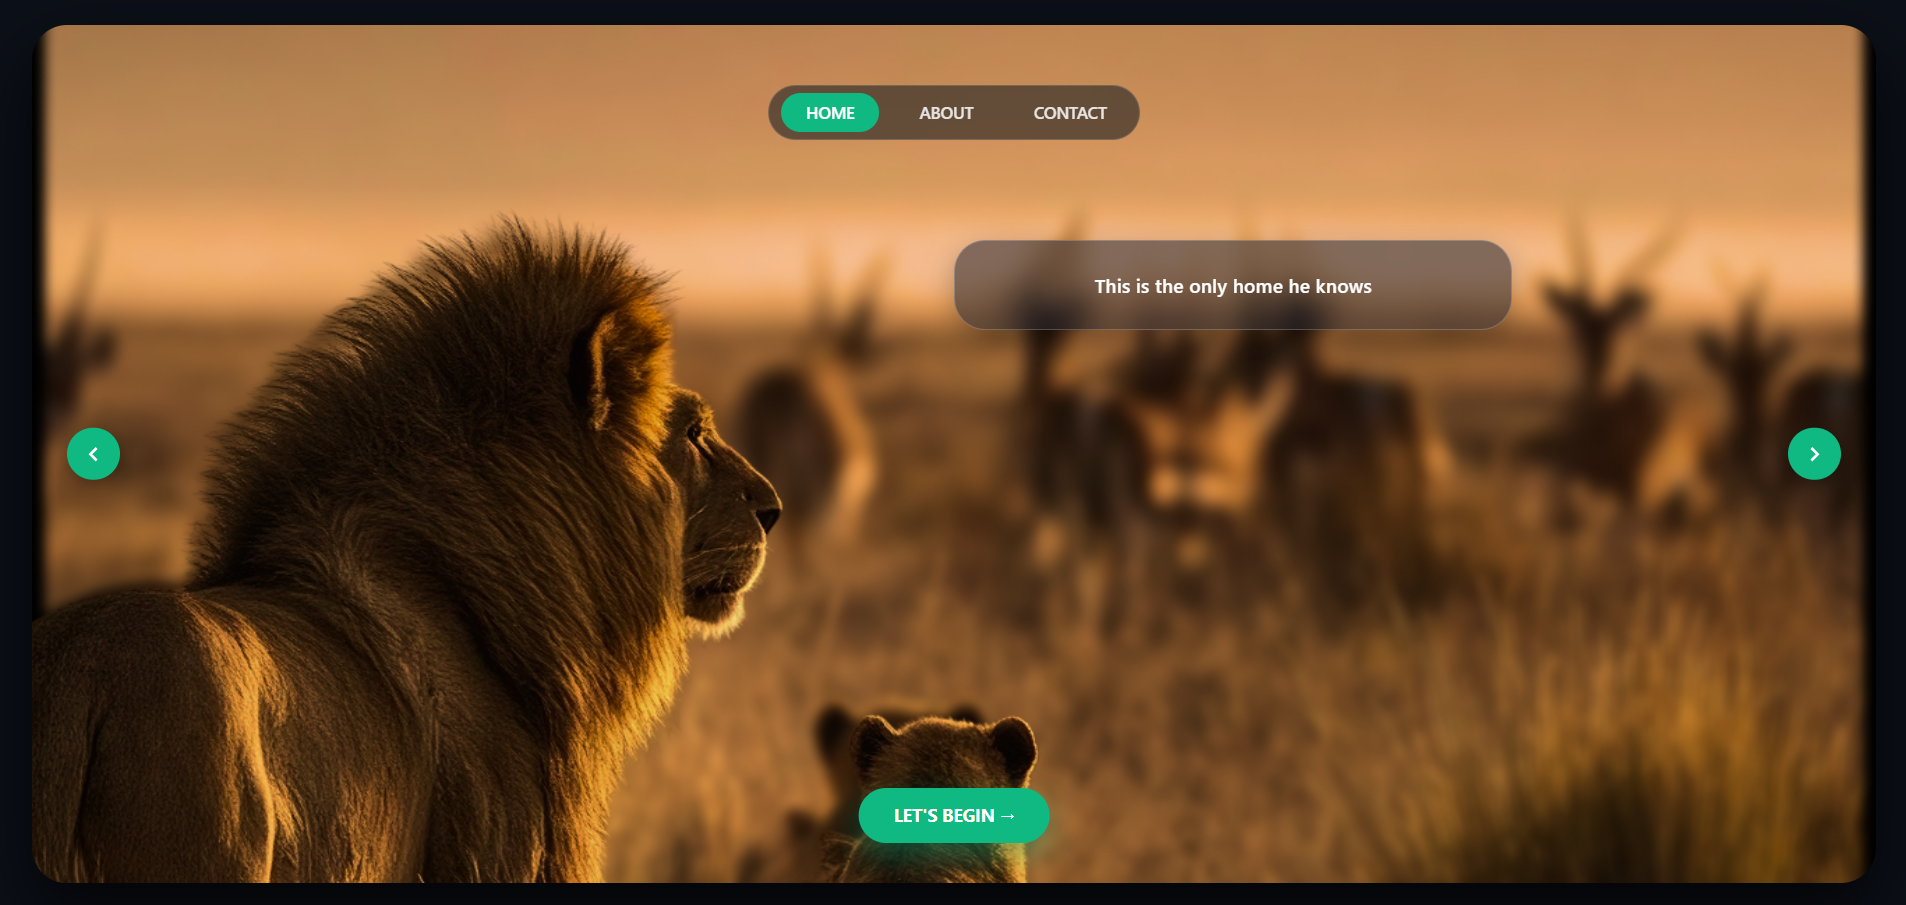
Part of landing page — Vaanya's mission, built for rangers on the ground
-
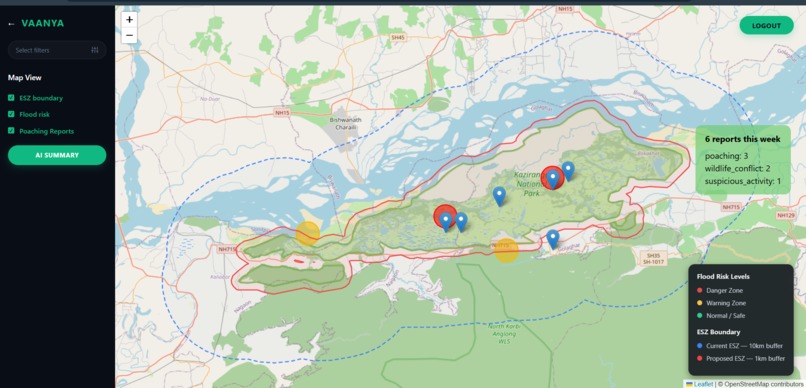
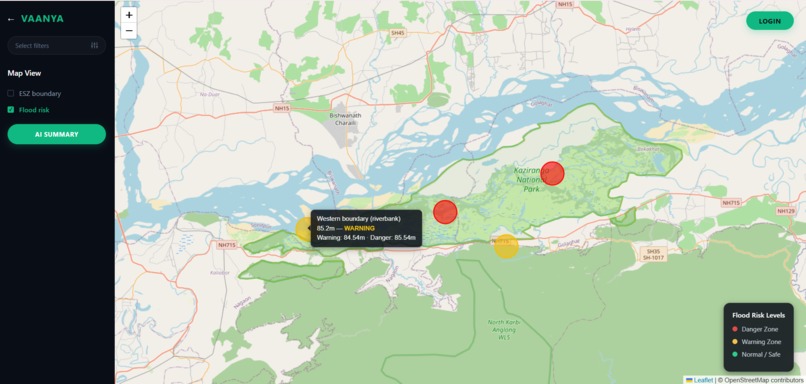
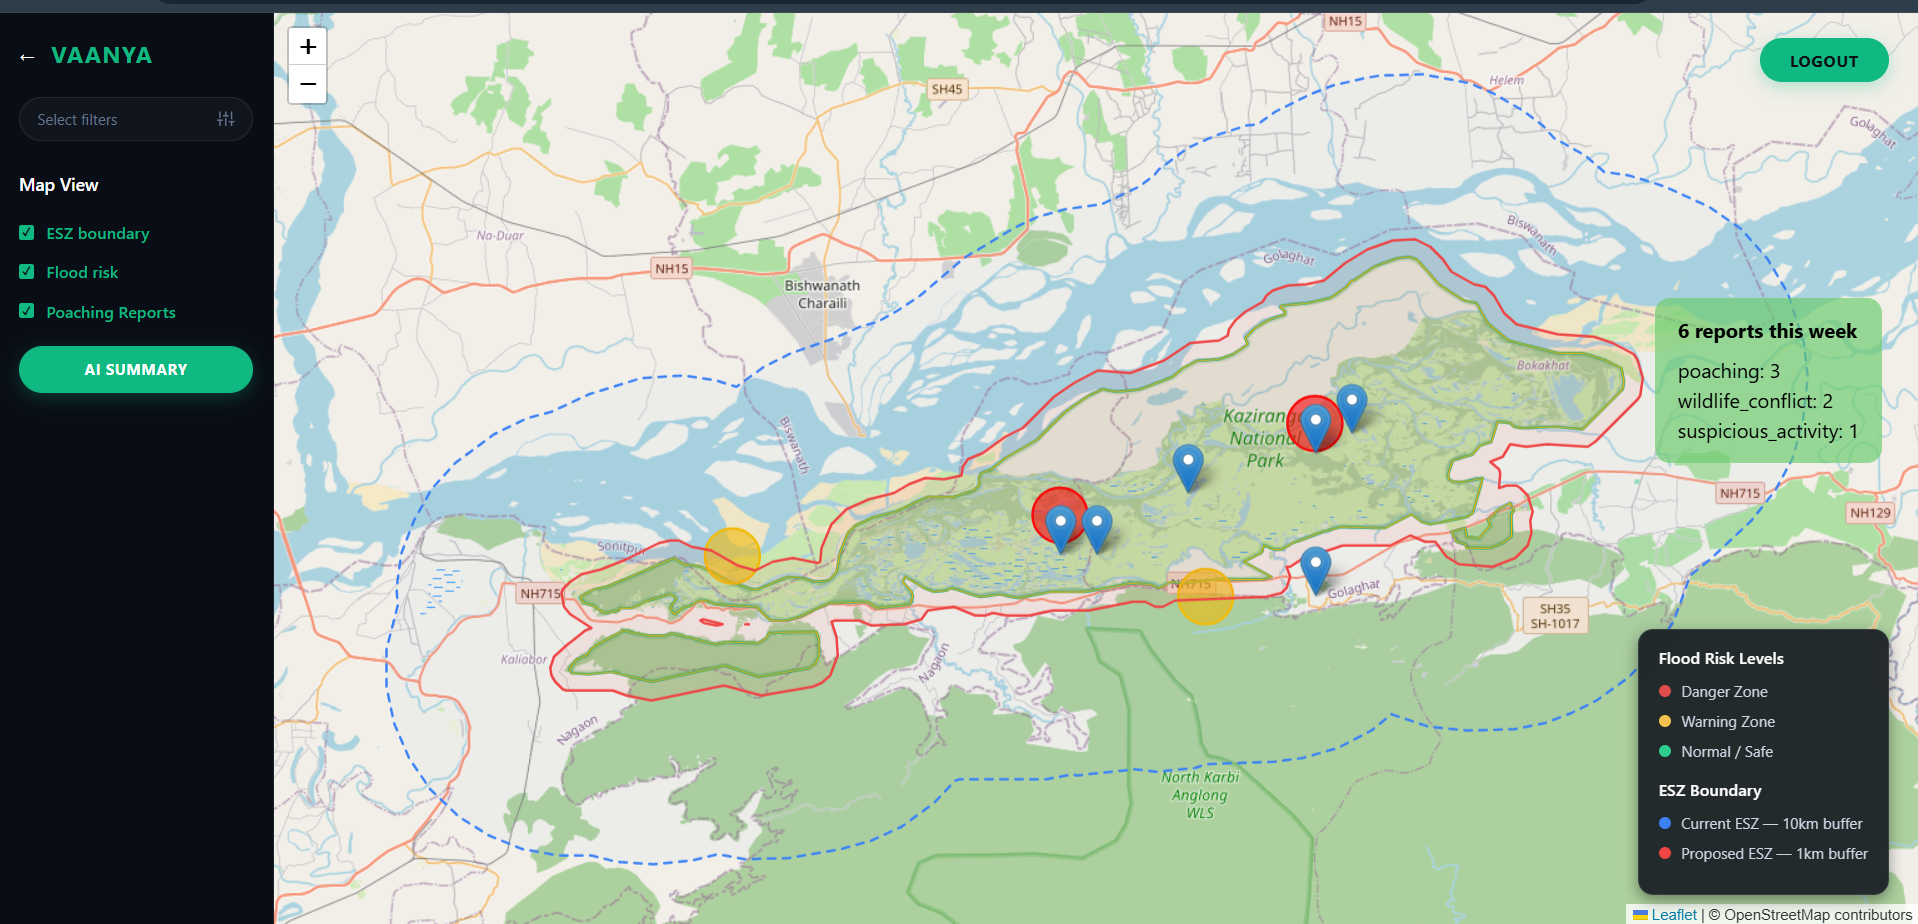
Flood risk zones and poaching reports plotted directly on the live map.
-
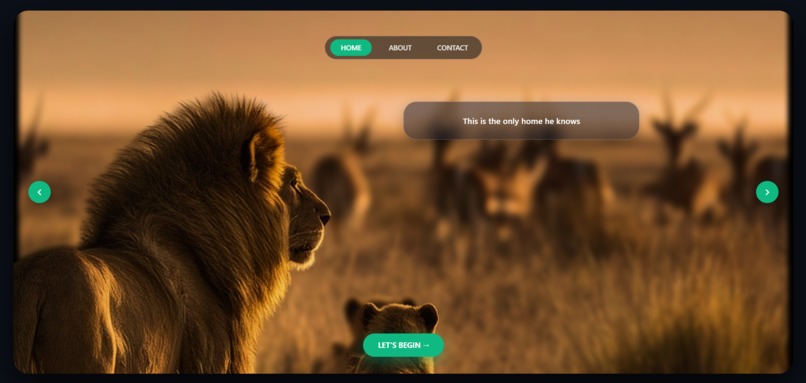
HOME PAGE
-
AI-powered risk briefings, generated from real flood and incident data.
Vaanya — One Dashboard. Every Threat.
Inspiration
Every monsoon, the Brahmaputra floods Kaziranga National Park, forcing rhinos and other wildlife to flee toward the highland corridors of Karbi Anglong. It's a well-documented, recurring crisis — and yet, as we started researching, we realized nobody actually has a single place to see it happening.
The moment that made this project urgent, not hypothetical, was a real news story breaking as we planned: in August 2026, the Assam government proposed shrinking Kaziranga's Eco-Sensitive Zone (ESZ) from a protective 10 km buffer down to just 1 km, citing a 2022 Supreme Court order. Conservationists — including Aaranyak's Bibhab Talukdar — warned publicly that this could cut off the very highland corridors animals rely on during flooding. That's the exact moment two separate crises (a flood risk and a policy decision) collide, and nothing existing shows you that collision.
We looked at what already exists — HAWK, HaatiApp, Roadwatch, VanNetra — and found real, well-built tools, each solving exactly one slice of the problem: incident reporting, elephant tracking, roadkill hotspots, camera-trap detection. None of them connect an incident to the environmental and policy context driving it. That gap — not "another reporting app," but the missing connective layer — is what we set out to build.
What it does
Vaanya is a map-based threat monitoring and reporting dashboard for India's national parks, built around one core idea: public transparency by default, gated write-access underneath.
- Flood Risk Layer — live Central Water Commission Brahmaputra water-level data near Kaziranga (Neamatighat gauge), color-coded against real warning (84.54m) and danger (85.54m) thresholds.
- ESZ Boundary Overlay — toggle between the current 10km buffer and the proposed 1km buffer, using the real, publicly reported figures from the live Assam ESZ debate.
- Poaching / Suspicious Activity Reporting — citizens see aggregated incident counts ("3 reports in Eastern Range this week"); logged-in rangers/NGO workers see exact pin locations to act on.
- AI Risk Summary — powered by Google's Gemini API, this is the feature we're proudest of. It reads the current flood status, ESZ context, and recent report activity, and turns it into one short, plain-English briefing paragraph — the kind of "here's what needs attention today" summary no existing tool provides. A ranger currently has to manually cross-reference a map, a report list, and the news themselves; Vaanya does that synthesis for them.
Anyone — a tourist, a journalist, a judge — can see the live map and AI summary with zero login, in under 10 seconds. Only submitting reports or viewing exact pin locations requires a lightweight ranger/NGO login.
How we built it
Architecture:
FRONTEND (React + Vite + react-leaflet)
   │
   ├── Public view: Map + ParkBoundary + FloodRisk + AI Summary Card
   │                 (aggregated report stats, no login)
   │
   └── Login (Firebase Auth) ──> role lookup in Firestore ──> Ranger Dashboard
                                                                (exact pins, report form)

BACKEND
   ├── Firestore (Firebase) — reports collection, users collection with role field
   ├── floodData.js — hardcoded CWC Neamatighat readings (real bulletin values)
   ├── kaziranga-boundary.geojson — real park shape, pulled via Overpass API (OpenStreetMap)
   └── geminiSummary.js — builds a prompt from flood status + ESZ status + report
                           counts, sends it to Gemini API, returns a plain-English summary
Data flow, end to end:
- User lands on the app → map renders with the real park boundary and current flood-risk color coding.
- The AI Summary Card calls our Gemini service function, which bundles live flood status, ESZ context, and aggregated report counts into a prompt.
- Gemini returns a short briefing paragraph — tone shifts meaningfully depending on severity (we tested this explicitly across calm / warning / danger scenarios).
- If a ranger or NGO worker logs in (Firebase Auth), we look up their role in Firestore and unlock exact report pins and the reporting form.
- New reports write directly to Firestore and feed back into both the map and the next AI summary — a closed loop, not a static demo.
Tech stack: React (Vite) + react-leaflet + Leaflet.js on OpenStreetMap tiles, Firebase (Firestore + Auth), Google Gemini API (Flash model), Turf.js for boundary buffer geometry, deployed on Vercel/Netlify — a fast, free stack chosen deliberately so we could ship a real, live, working deployment rather than a slide describing one.
We split ownership cleanly down the middle: one of us owned backend, data, and the AI layer (Firebase, CWC data, Gemini prompt design, security rules); the other owned frontend, the map, and UI (React + Leaflet, layer toggles, login flow, ranger dashboard). We synced daily to integrate rather than merging everything at the end.
Challenges we ran into
- CWC/India-WRIS has no simple public REST API. We couldn't just
fetch()live flood data client-side. We made the deliberate, transparent choice to hardcode a realistic sample built around genuine CWC bulletin readings (85.02m and 85.59m are real published values) rather than fabricate a live integration we couldn't actually build safely in the time we had — and we say so plainly rather than implying it's a live feed. - Firestore's security model doesn't support field-level read restrictions. We couldn't make just the coordinates private while keeping the rest of a report public within the same rule set. Our honest solution: lock down all writes to authenticated rangers/NGOs, and handle the aggregated-vs-exact-pins split in the UI layer — a real trade-off we can speak to directly if asked.
- Prompt engineering for genuine variation, not generic filler. Our first Gemini prompt drafts produced summaries that technically used the right numbers but read almost identically regardless of severity. We iterated until three test scenarios — calm, warning, and danger — each produced a distinctly different tone and urgency, not just different numbers in the same sentence.
- Getting real boundary geometry right. Kaziranga's actual park boundary isn't a simple shape, and Overpass Turbo's Wizard needed the map view manually navigated to Assam before a boundary query would return real geometry instead of an empty dataset — a small thing that cost real debugging time before we understood why it was failing.
Accomplishments that we're proud of
- A genuinely differentiated core feature, not just another reporting form. The AI Risk Summary is the piece we're most proud of — it's the one thing none of the four existing tools we researched (HAWK, HaatiApp, Roadwatch, VanNetra) do at all. Watching it produce three distinctly different, appropriately-toned briefings for calm, warning, and danger scenarios — instead of the same sentence with different numbers swapped in — was the moment the idea felt real rather than theoretical.
- Built on real, live public data, not fabricated demo numbers. Our flood thresholds are genuine CWC bulletin figures for the Neamatighat gauge, our park boundary is pulled from real OpenStreetMap geometry, and our ESZ narrative is tied to an actual, unresolved August 2026 policy debate — not an invented scenario. That's a deliberately harder path than mocking everything, and we think it shows.
- An access model we can actually defend under questioning. Rather than hand-waving "we'd add security later," we thought through — and can explain — exactly why public read access is a feature (safety information shouldn't be gatekept from the villagers it protects) and where the real trade-offs are (Firestore's lack of field-level read rules, and our resulting UI-layer solution).
- Shipping a real, working, deployed two-person build in a compressed sprint window, with a clean division of ownership (backend/data/AI vs. frontend/map/UI) that let both halves move in parallel without blocking each other.
What we learned
- How to design an access model around a genuinely public-safety product: transparency by default is a legitimate design choice, not just a convenience — hiding wildlife-conflict alerts from villagers to "protect" the data would defeat the entire point of the tool.
- That real government and satellite data (CWC, OpenStreetMap, and — in future work — NASA FIRMS) is more accessible than it looks, but rarely as simple as a clean API; working around messy, non-API data sources is often the actual engineering work.
- How much a single well-designed AI summary layer can change a product's feel — the same raw data, presented as scattered numbers versus one synthesized paragraph, reads completely differently to a time-pressed ranger.
What's next for Vaanya
- Wildlife conflict reporting, redesigned with a privacy-safe implementation — we deliberately cut this from MVP after realizing that exact animal-sighting GPS data could expose movement corridors to poachers, a risk we weren't willing to ship without solving properly.
- A second and third park (e.g. Bandipur) with a live fire-risk layer via NASA FIRMS — the concrete proof that Vaanya's architecture generalizes beyond Kaziranga, not just a single-park app with a national-sounding name.
- Real, non-hardcoded live data integrations once we can build proper backend polling infrastructure, and a genuine partnership conversation with an NGO like Aaranyak or a state forest department.
Kaziranga is our proof of depth. Vaanya is built to protect any park in India.
Built With
- firebase
- firebase-authentication
- firestore
- framer-motion
- gemini-api
- google-gemini
- javascript
- leaflet.js
- openstreetmap
- react
- react-leaflet
- turf-js
- vite


Log in or sign up for Devpost to join the conversation.