-
-
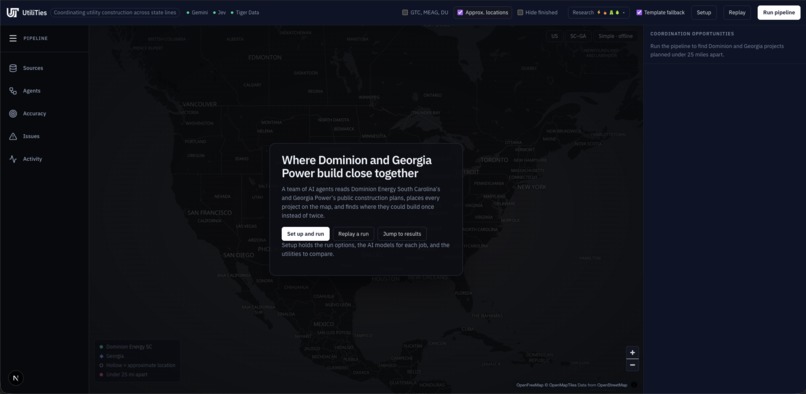
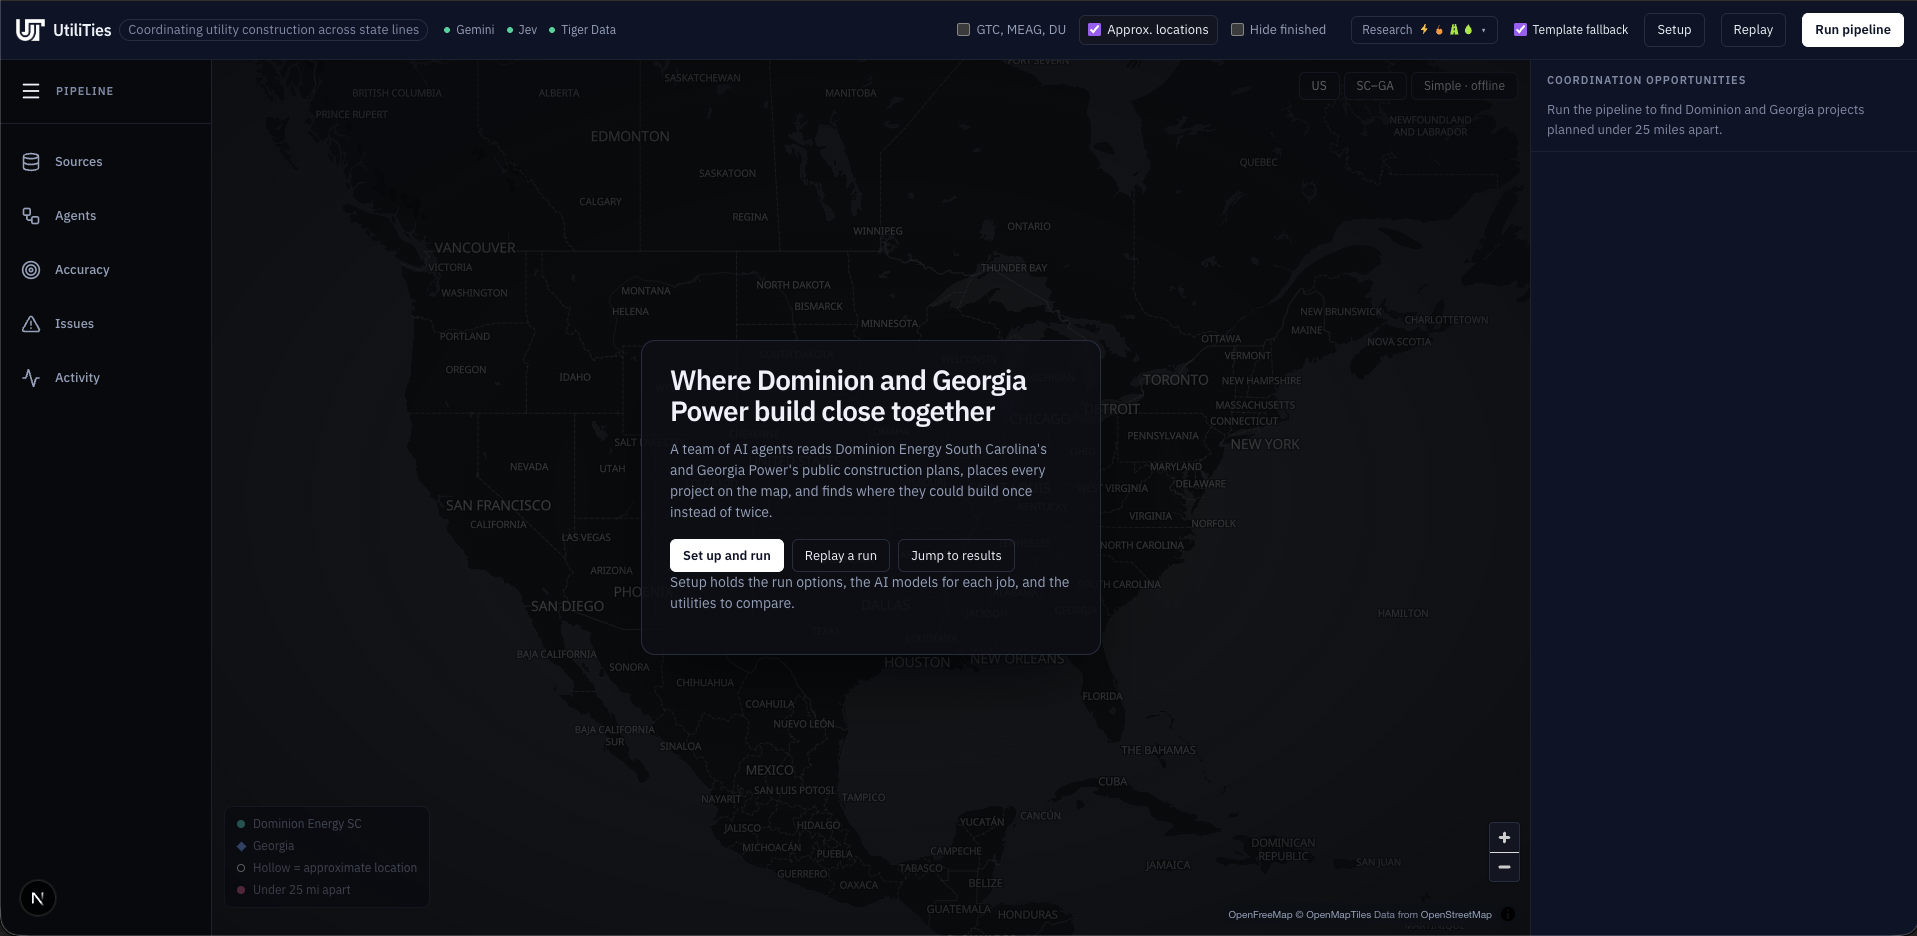
Welcome Screen
-
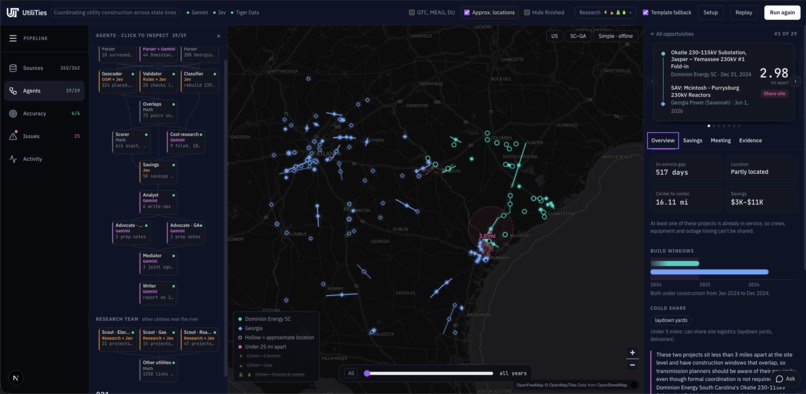
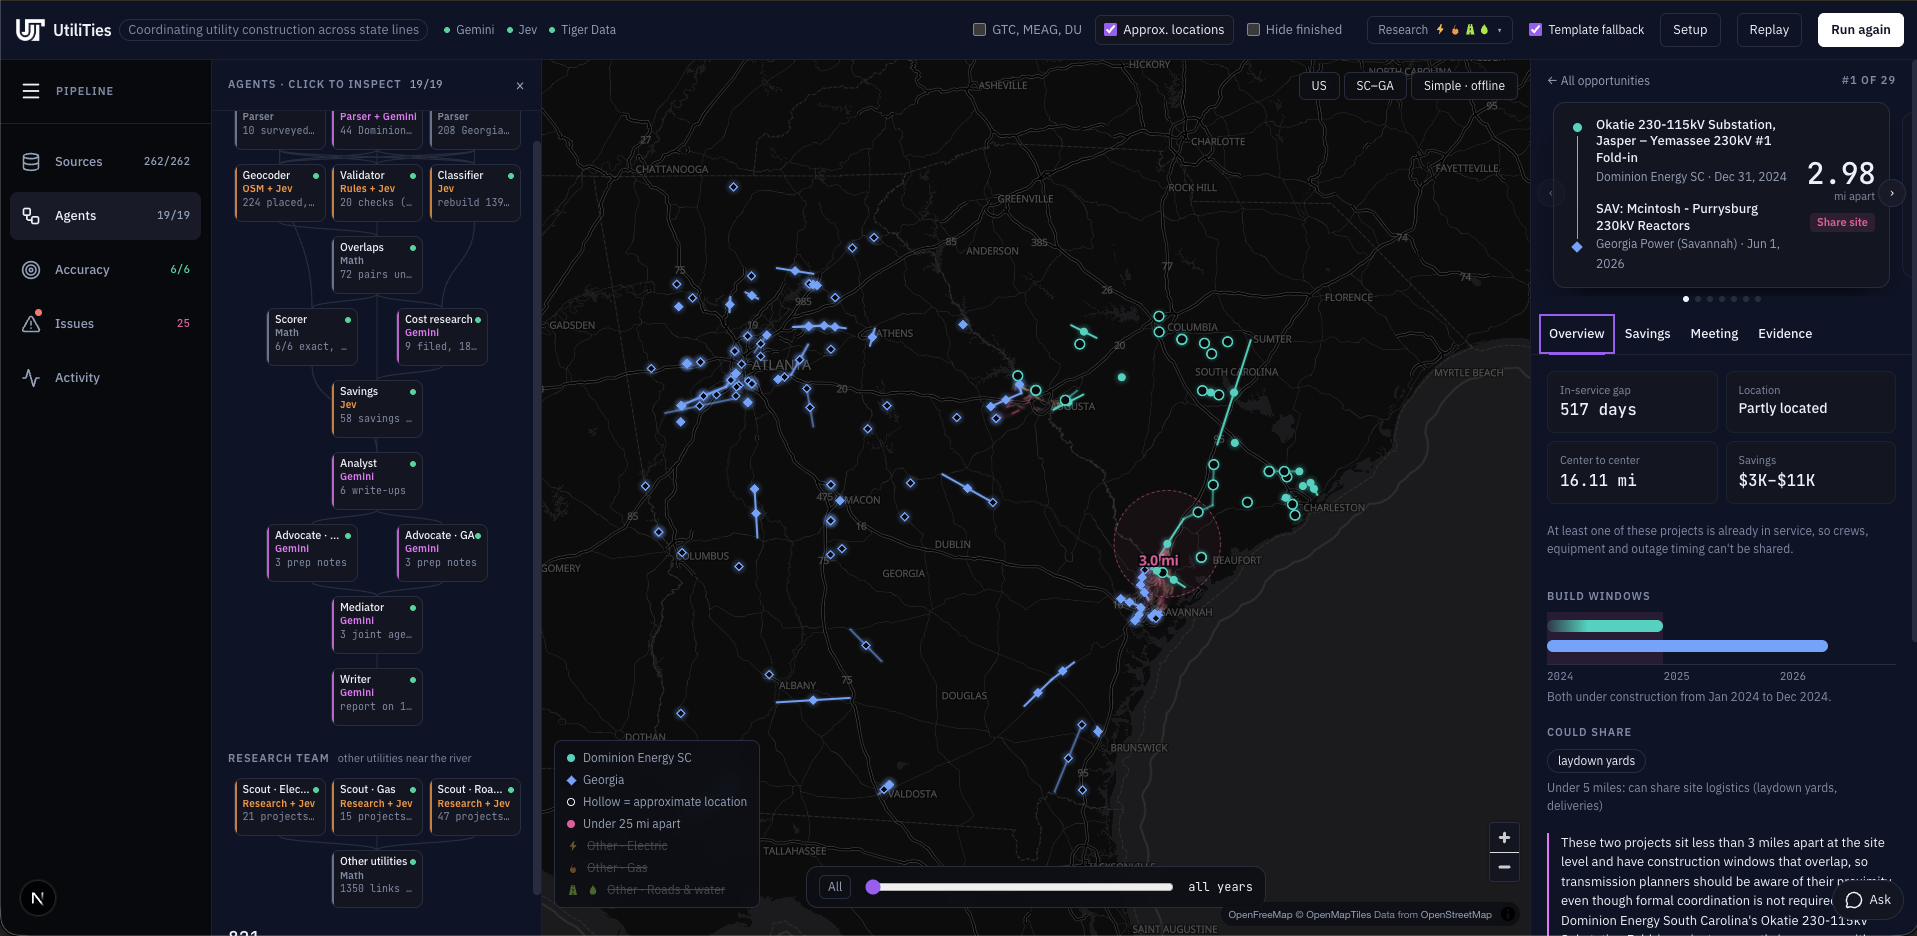
Results
-
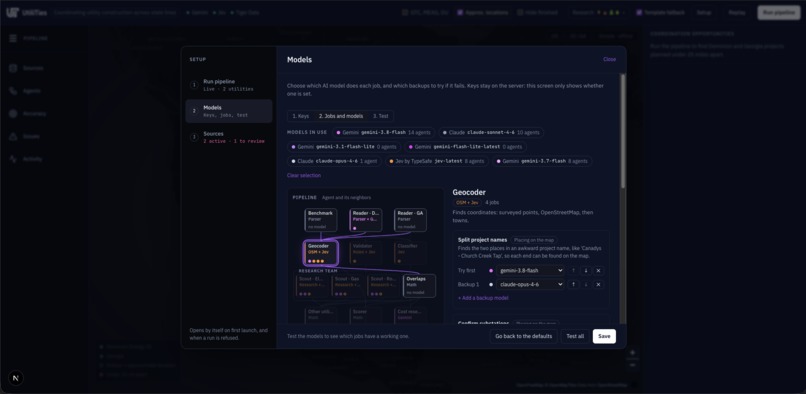
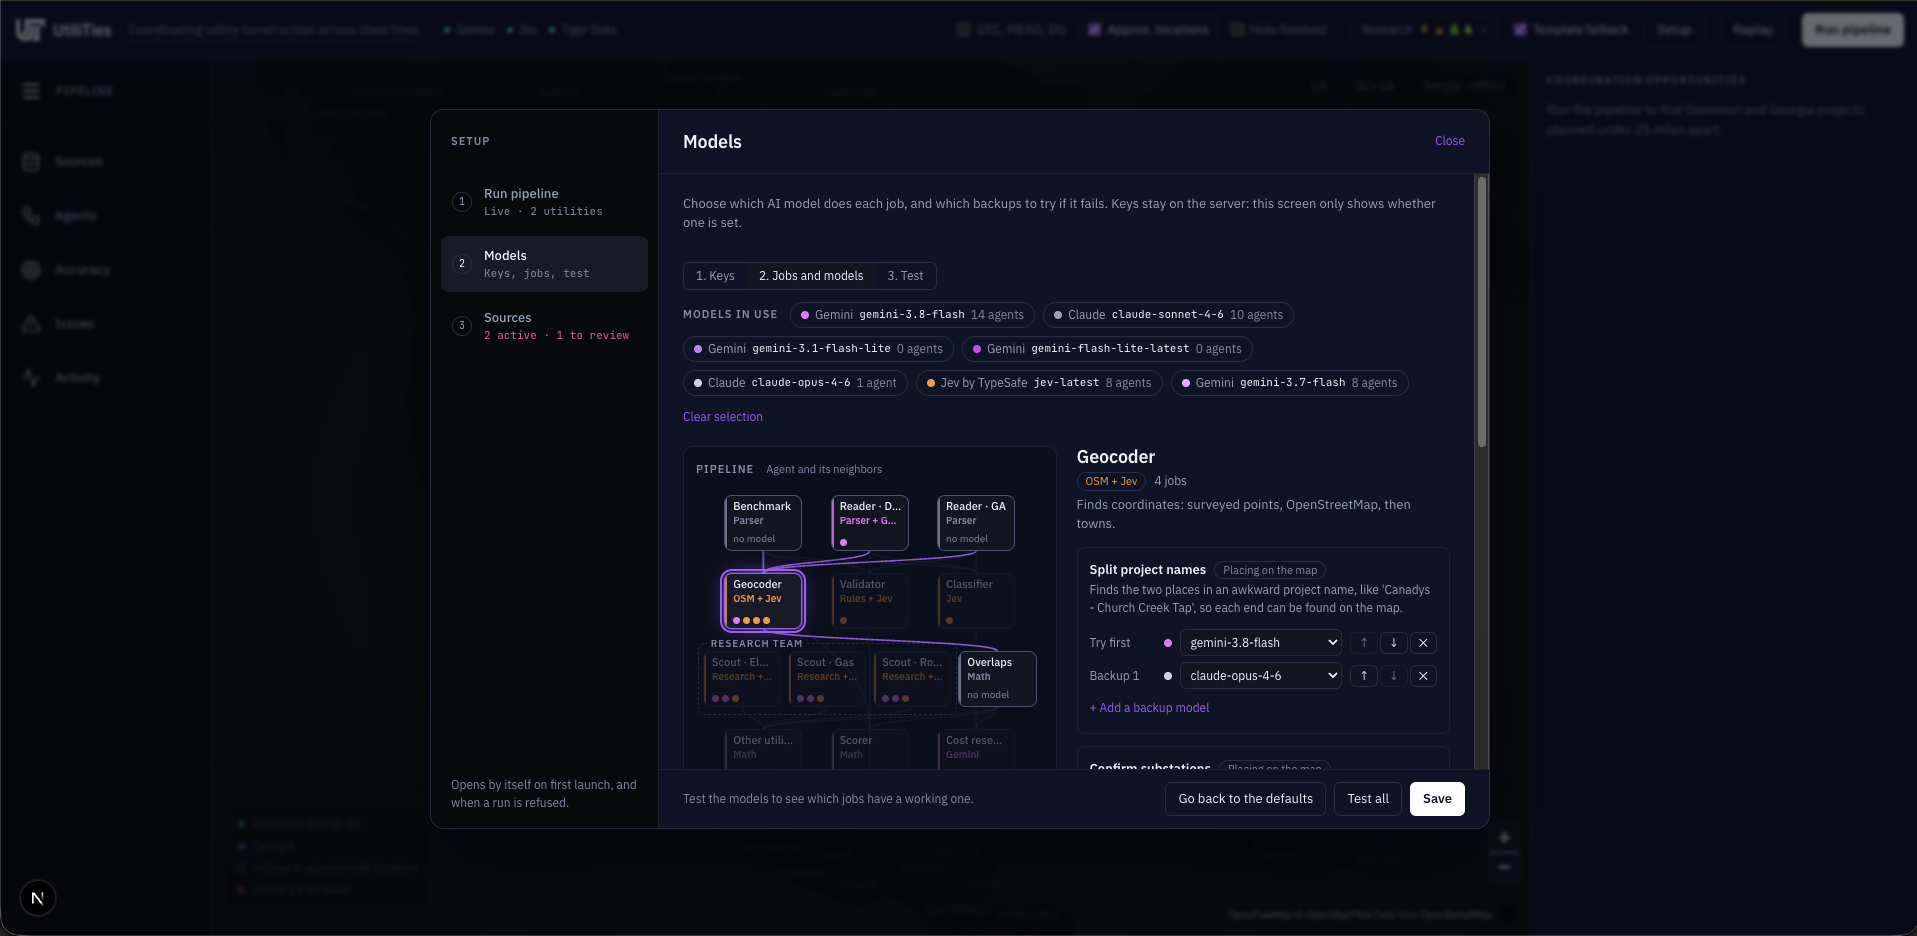
Model Setup
-
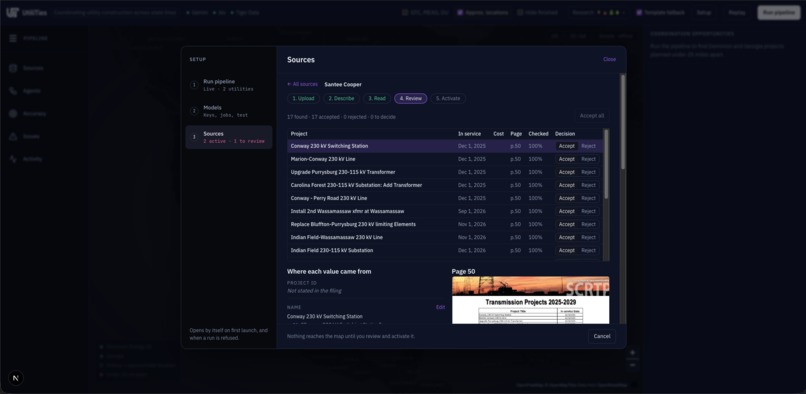
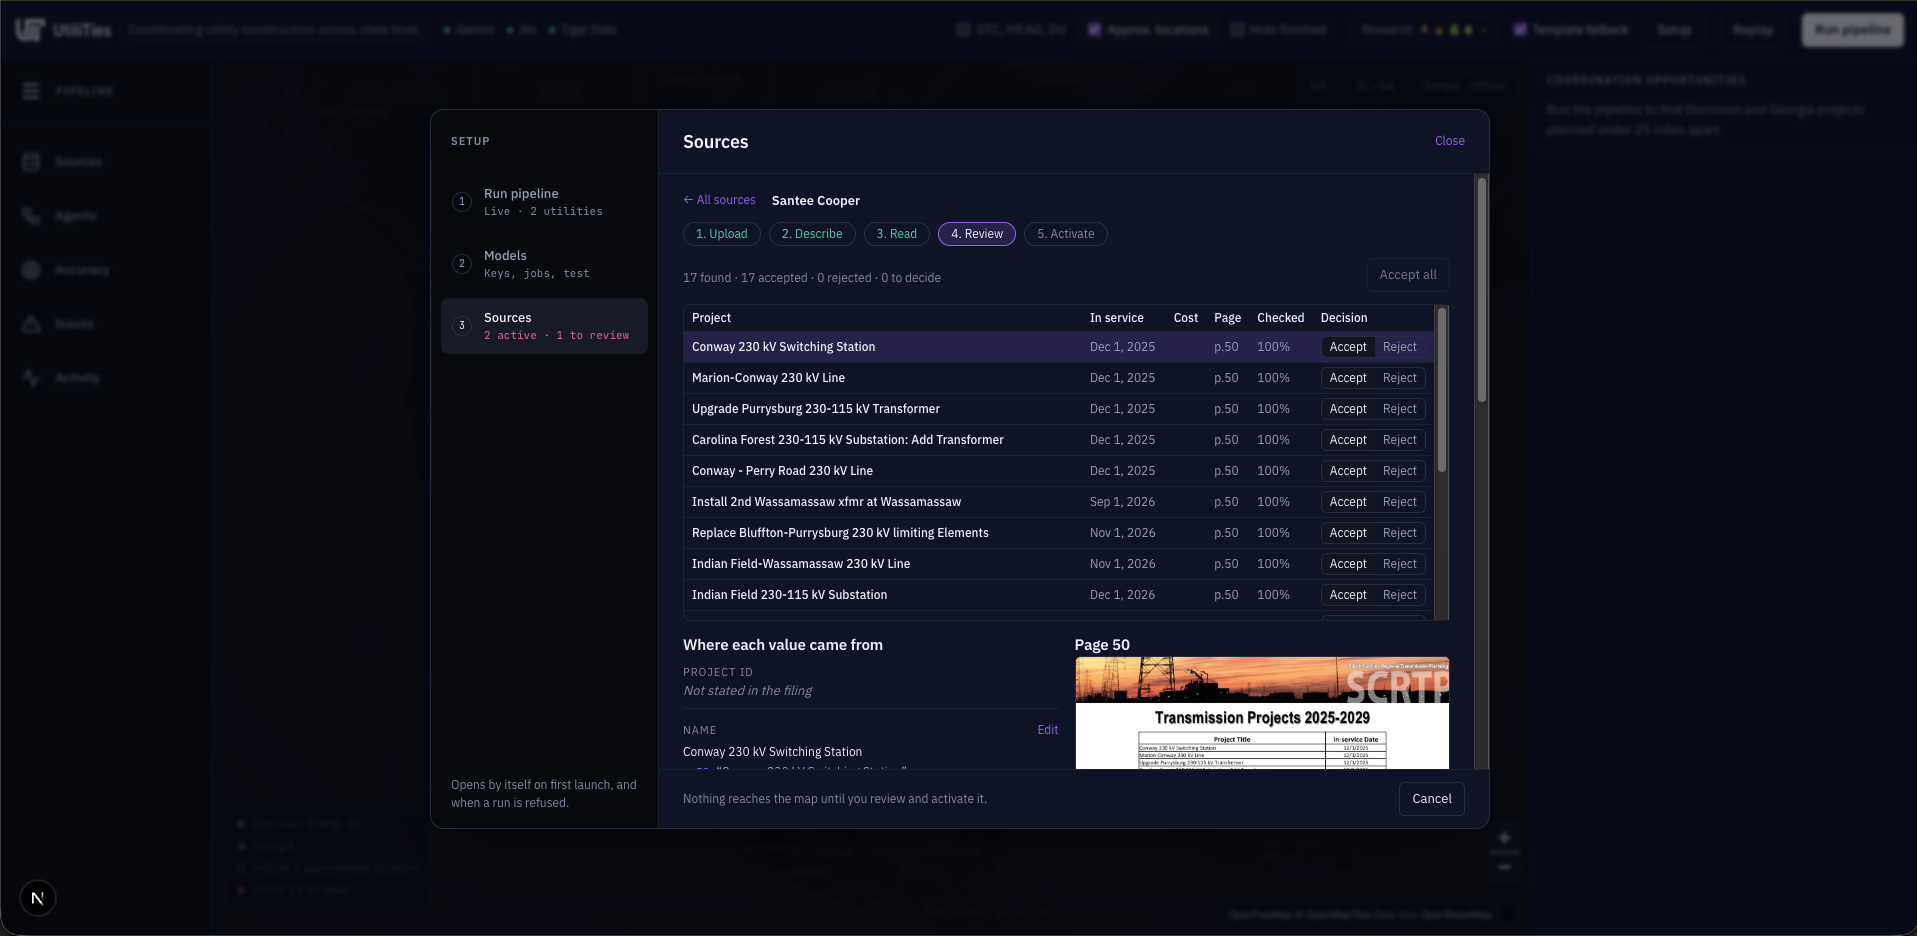
Additional Feature: Research Agents look for other utilities in the area for additional opportunities
Inspiration
Utilities plan their construction years ahead and publish those plans in regulatory filings. Neighboring utilities rarely read each other's filings, though. Two companies can end up building a few miles apart in the same season, each paying separately for crews, equipment, right-of-way, and outages. Sperry's GridLock challenge asked us to find those overlaps. We wanted a tool that reads the plans the way a person would, but across hundreds of projects at once, and shows its evidence for everything it claims.
What it does
UtiliTies reads two neighboring utilities' public construction plans, Dominion Energy South Carolina and Georgia Power, and finds where they could coordinate.
- Reads the filings. It parses 252 planned projects straight from the PDFs, and any other utility's plan can be added as a spreadsheet, PDF, or link.
- Maps every project. It places each substation and line on a map from OpenStreetMap and town records, and says how confident it is in each location.
- Finds the overlaps. It ranks every pair of projects within 25 miles by how much they could share: the land itself, site logistics, or crews and equipment. It also shows whether they're being built at the same time.
- Puts a number on it. It gives each pair a cost and a savings range, and says where every figure came from and which parts are our assumptions.
- Looks beyond the two utilities. Research agents find other owners' gas, road, water, and electric projects near the Savannah River.
- Prepares the conversation. For each opportunity it writes a plain-language summary, argues each utility's side, and drafts a coordination meeting. A final report sums up the run.
You can watch all of this happen: each agent lights up on the map and in a live pipeline graph as it works, and every number links back to a page in a filing or a cited source.
How we built it
UtiliTies is a team of AI agents running on our own DAG executor in Python and FastAPI. Each agent starts as soon as the agents it depends on finish, so independent work runs in parallel. Every agent streams its progress to the frontend over server-sent events, so you can watch the pipeline work on the map and in a live agent graph.
- Readers parse the filings straight from the PDFs: 44 Dominion Energy South Carolina projects and 208 Georgia Power projects. Any other utility's plan can be added as a spreadsheet, PDF, or link. Gemini reads new PDFs page by page. Every value it extracts keeps the page and snippet it came from, and code checks that each snippet really appears on its cited page.
- The Geocoder places each project using OpenStreetMap substations, GeoNames and Census places, and Nominatim. Jev (TypeSafe) confirms fuzzy name matches with fast, typed yes/no decisions.
- The Validator reports malformed costs, yearly costs that don't add up, spending listed after a project's in-service date, and descriptions copied between projects.
- The Overlap engine measures the closest points between every pair of projects, so a long transmission line passing near a substation counts:
$$ d(A,B) = \min_{a \in A,\; b \in B} \lVert a - b \rVert $$
Pairs are ranked by the challenge's tiers: touching or crossing, under 1 mile (share the land), under 5 miles (share site logistics), and under 25 miles (share crews and equipment). The engine also checks whether their build windows overlap.
- Cost research and Savings agents give every paired project a cost. It comes from the filing, from a published source found with Gemini's grounded web search (Jev confirms the quote actually supports the number), or from a model based on Dominion's filed costs for the same kind of work. Savings is a range on the smaller project's cost:
$$ S_{AB} \in \big[\,p_{\text{low}},\ p_{\text{high}}\,\big] \times \min(C_A,\ C_B) $$
The percentages depend on the distance tier and on whether both projects are under construction at the same time. Every percentage is labeled in the app as a team assumption. If Jev judges that sharing isn't worth raising for a pair, no savings are claimed.
- A research team of scouts maps other owners' projects near the Savannah River, covering electric, gas, roads, and water, with a cited source for every record.
- Analyst, two utility Advocates, and a Mediator use Gemini to write up each opportunity and draft the coordination meeting. At the end, a Writer agent summarizes the run.
The frontend is Next.js with MapLibre. The rule we held ourselves to was that code does the math and models do the reading and judgment. Every distance, tier, and dollar figure is computed in Python. Every model-written summary is checked for numbers that aren't in the computed facts, and any it finds are flagged in the app.
Challenges we ran into
- Geography is harder than parsing. At one point a Dominion line from St. George to Sumter matched a Saint George Substation in south Georgia. The map drew a 253-mile line toward Jacksonville, and that one mistake created 12 phantom overlaps, including our #1-ranked pair. We added span checks (a line can't be much longer than its filed mileage, and an out-of-state endpoint has to be within 30 miles of the other end) plus a stricter judge threshold for out-of-state matches.
- Two definitions of distance. Sperry's sample measures center to center, but that misses a long line passing right by a substation. We compute closest-point distance for ranking and keep center-to-center alongside it, so we can still reproduce the benchmark exactly.
- Keeping the models honest. A model will write a confident dollar figure if you let it. Costs therefore need a filing, a verified quote, or a labeled model. Any number in the Writer's summary that the pipeline didn't compute is flagged for review, and a template takes over when the model fails.
- Model reliability during a live demo. Gemini sometimes returned transient errors mid-run. We built a model registry with retries, a fallback model per job, a circuit breaker, and typed error messages the UI can explain. Claude and OpenAI can also stand in for Gemini on any job.
- Four people, one repo, one weekend. Merge conflicts were constant, and one merge left stale code behind that crashed the opportunity panel. Our backend test suite caught regressions in the pipeline, and a snapshot test pins the overlap results so refactors can't silently change them.
Accomplishments that we're proud of
- It passes the benchmark exactly. It reproduces all 6 of Sperry's known overlaps, to 0.01 miles and to the day.
- It works on real filings. It read 252 projects from two real regulatory filings, placed 224 of them, and found 72 coordination opportunities, 29 of them between projects being built at the same time.
- Every number has a source. Each figure traces back to a filing page, a verified quote, or a formula labeled as ours. If a model adds a number we didn't compute, the app flags it.
- It keeps running when models fail. Retries, fallback models, and templates keep a live demo going through API outages. The app says exactly which step fell back and why.
- You can watch the agents think. The live agent graph and map make a multi-agent pipeline something a utility engineer can follow and question.
- It works for any utility. A new utility's plan gets its own Reader and is compared with every other owner's projects, so the tool isn't tied to these two utilities.
What we learned
- The hard part of "AI reads documents" is rarely the reading. It's grounding what the model reads in the real world and deciding when not to trust it.
- Splitting work between deterministic code and model judgment made the system both more accurate and easier to explain to a judge or a utility engineer.
- A benchmark early changes everything. Once we could score ourselves against Sperry's known overlaps (6 of 6 reproduced exactly, to 0.01 mi and to the day), every change had a clear pass/fail.
- Being upfront about assumptions, like labeling savings percentages as ours, builds more trust than a single confident number.
What's next for UtiliTies - Utility Coordination
- Place the last projects. 28 of 252 projects still have no location. We want a human-checked review queue that proposes a location for each one, so every map point still traces back to a source.
- Real routes, not straight lines. The filings only name a line's endpoints, so we draw a straight segment between them. Real line routes from utility GIS data or OpenStreetMap would make closest-point distances much sharper.
- Calibrate the savings. Our savings percentages are labeled team assumptions, and Georgia Power's costs are redacted in the public filing. Actual cost data from utility partners would turn the ranges into estimates they can budget against.
- More neighbors. Any plan can already be added, so the next step is running UtiliTies across whole regions, not just one pair of utilities, and bringing gas, water, and transportation plans in as regular sources.
- Close the loop. Let utility engineers accept or dismiss each opportunity and send the drafted meeting to the right people, so the tool learns which overlaps are actually worth a call.
Built With
- claude
- digitalocean
- docker
- fastapi
- gemini
- geonames
- maplibre
- next.js
- nominatim
- openai
- openfreemap
- openstreetmap
- overpass-api
- poppler
- postgresql
- pydantic
- python
- react
- tiger-data
- timescaledb
- typesafe-jev
- typescript
- us-census
- zustand


Log in or sign up for Devpost to join the conversation.