-
-
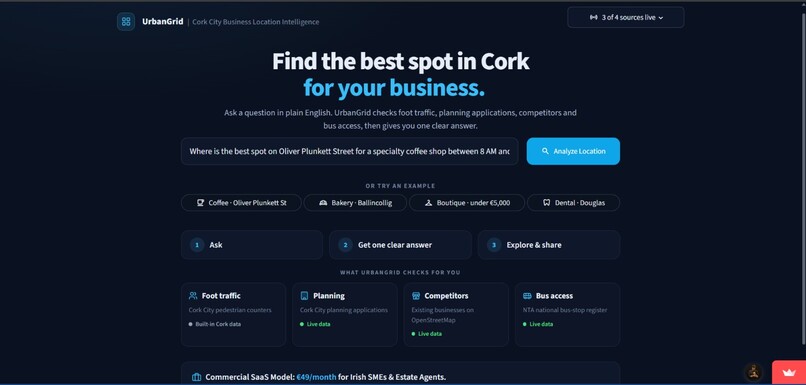
HOME PAGE 1
-
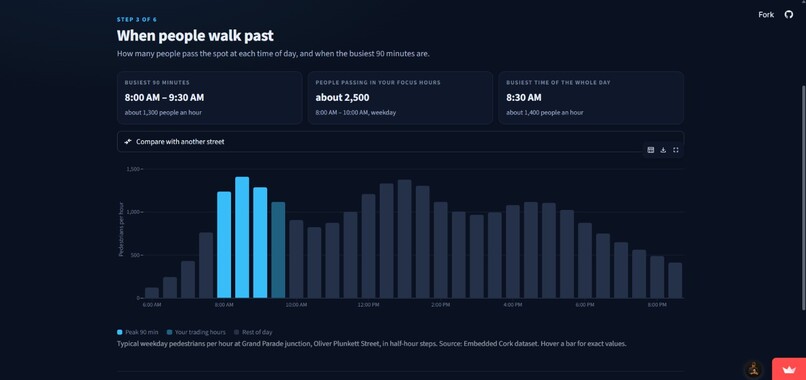
FOOTFALL STAT
-
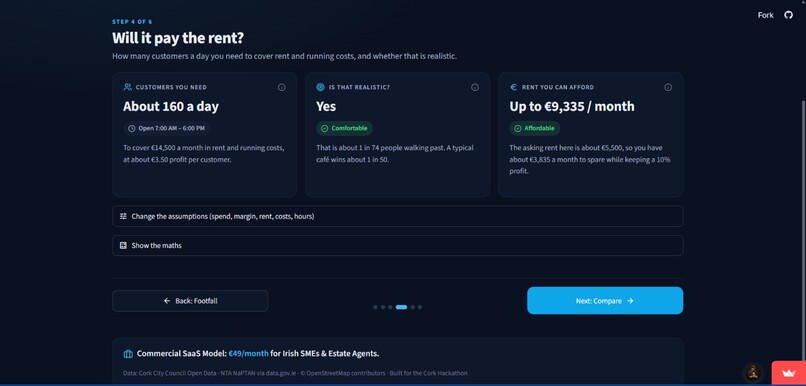
BREAKEVEN
-
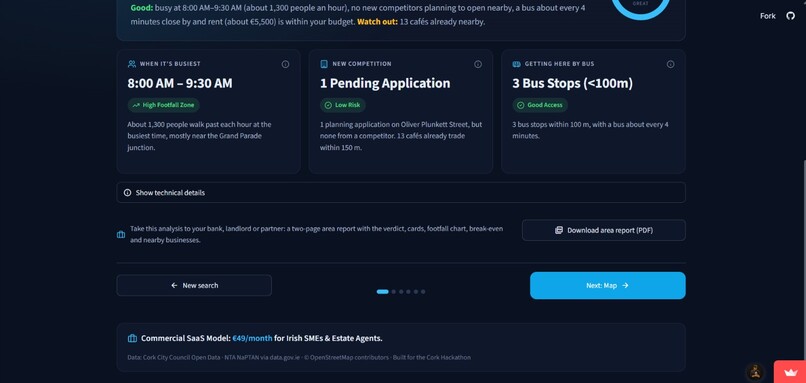
DASHBOARD
-
EXPERT 2
-
DATA & LIMITS 2
-
COMPARISON
-
EXPERT 1
-
DATA & LIMITS
-
MAP
-
HOME PAGE 2

Inspiration
Opening my own business has been my dream for as long as I can remember. But every time I pictured it, the same question stopped me: where? Pick the wrong street and even a great café can close within a year. Big chains pay consultants for footfall studies. First-time owners like me get gut feel, a few walks down the street and an estate agent's opinion.
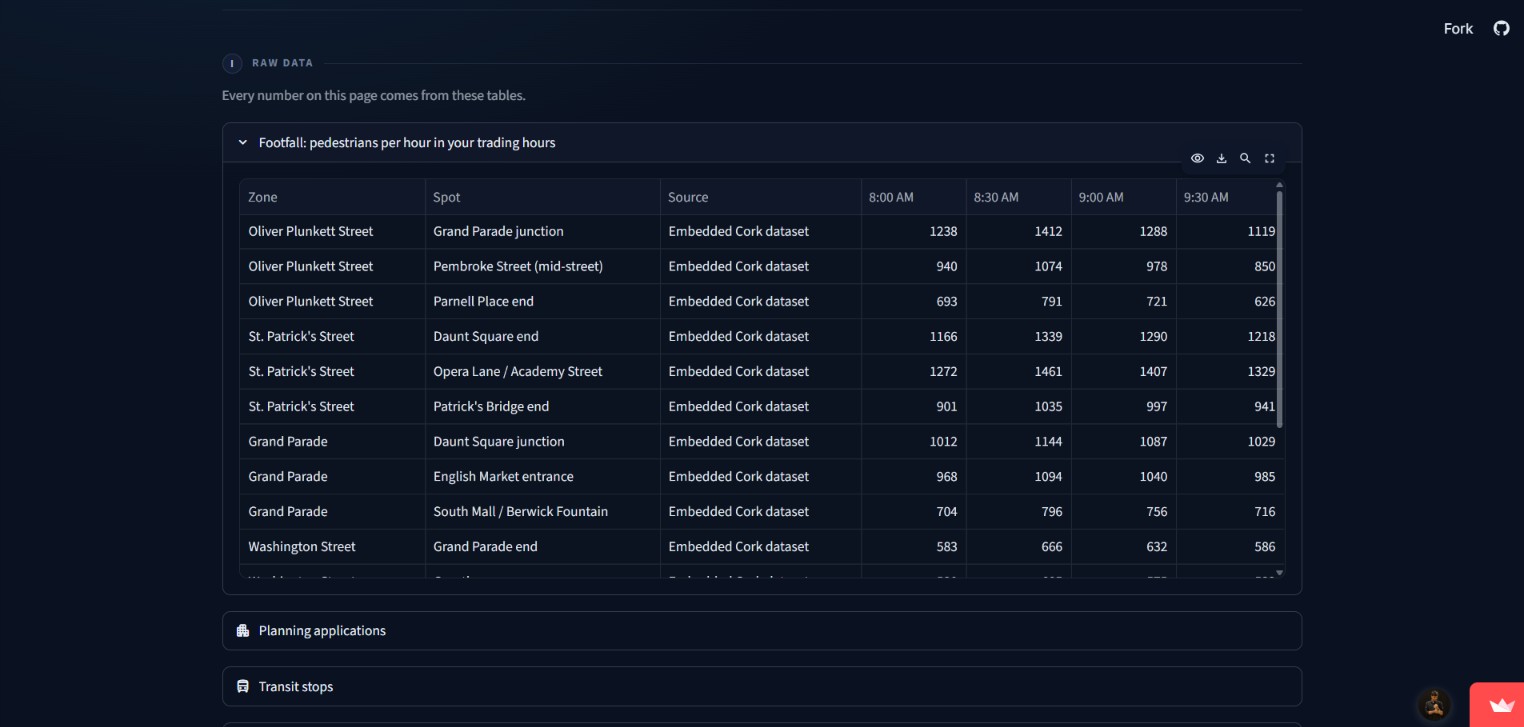
Then I found that Cork already publishes most of the answer: pedestrian counts, planning applications, every bus stop, and (through OpenStreetMap) the businesses already trading. It's just scattered across portals and formats nobody has time to learn. So I built the tool I wish I'd had: UrbanGrid. Someday I'll use it to pick the spot for my own business.
What it does
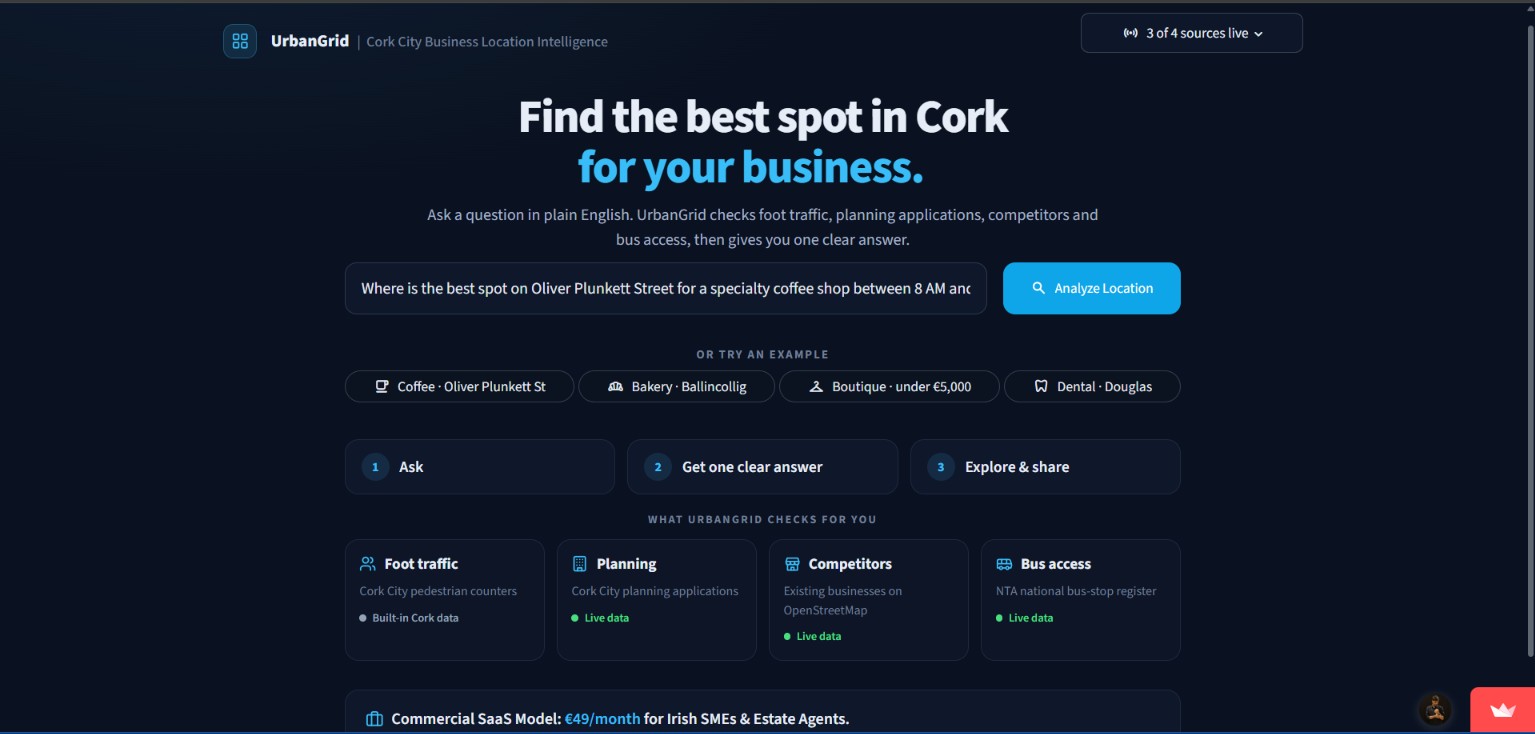
You ask a question the way you'd ask a friend:
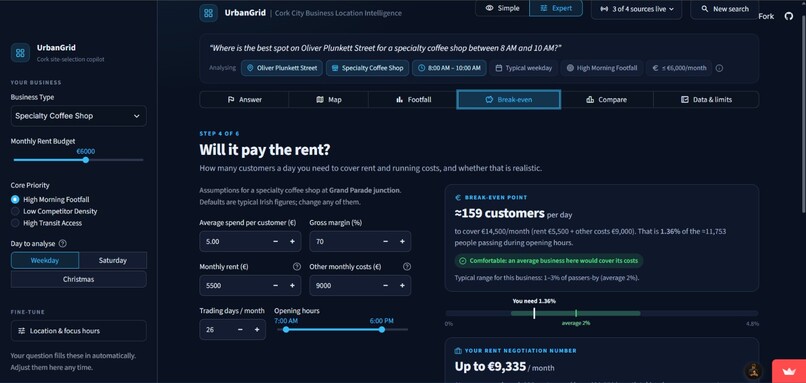
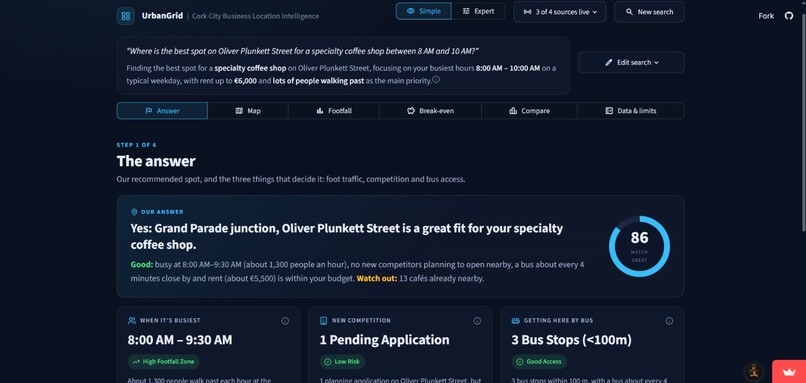
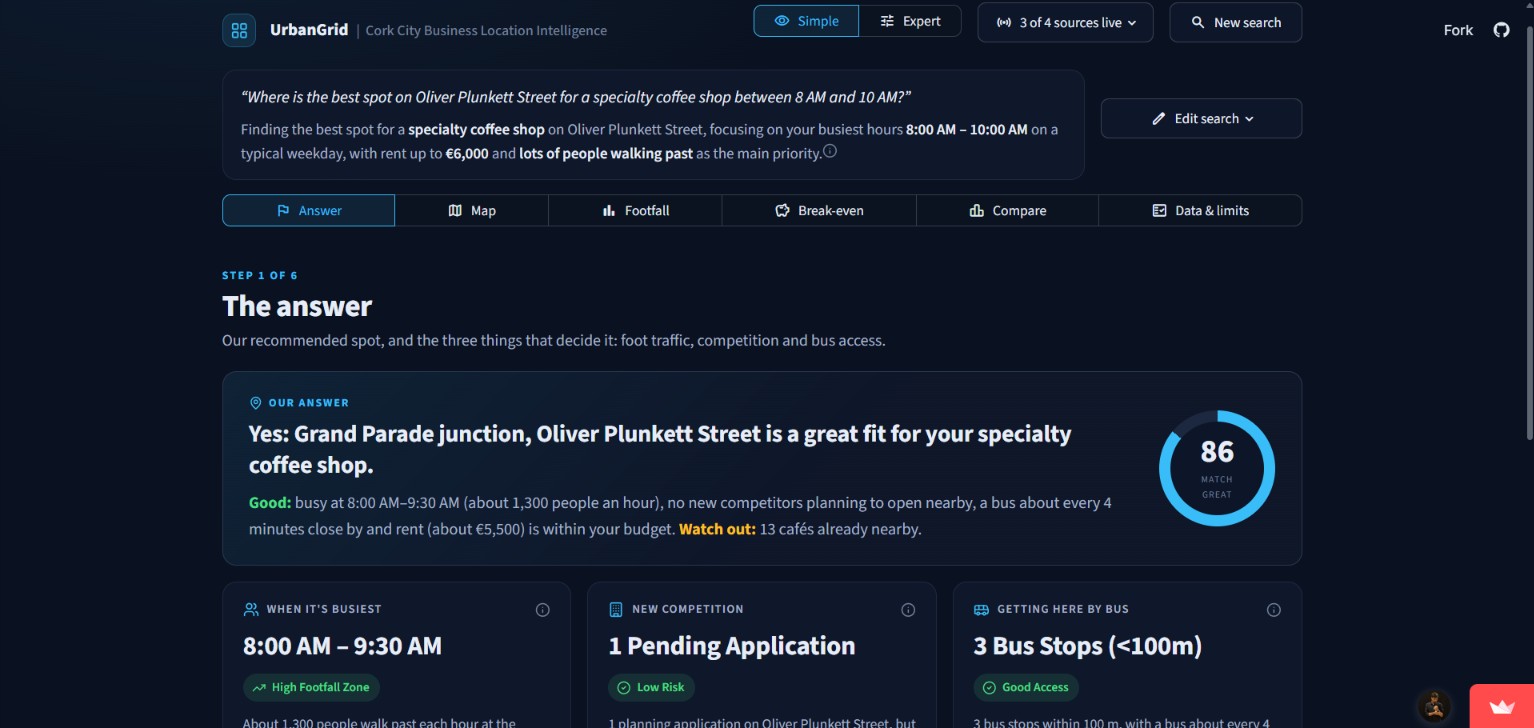
"Where's the best spot on Oliver Plunkett Street for a specialty coffee shop between 8 and 10 AM?"
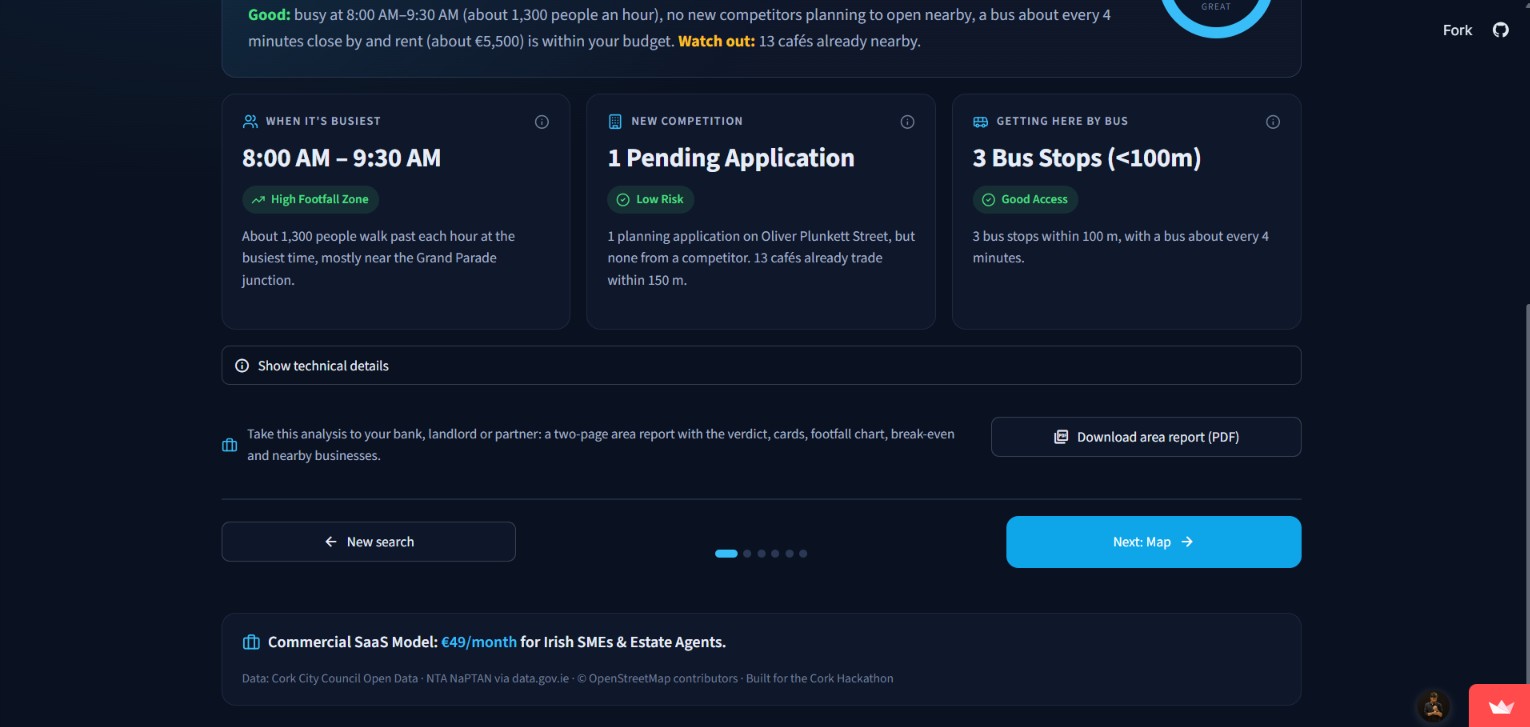
UrbanGrid answers in one sentence, "Yes: Grand Parade junction is a great fit", with a match score and three cards: when it's busiest, new competition nearby and bus access. Then it walks you through the details step by step:
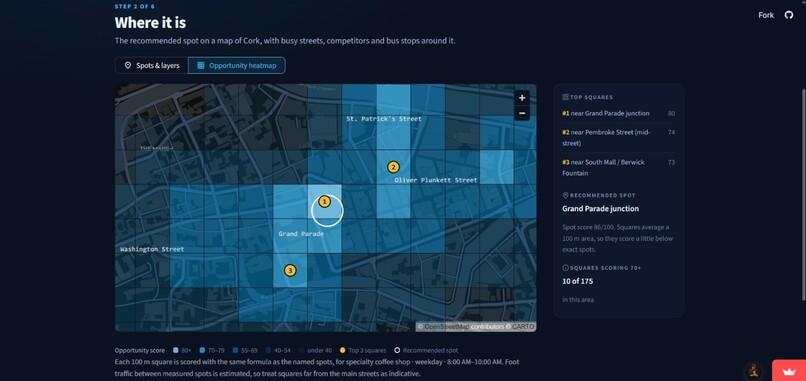
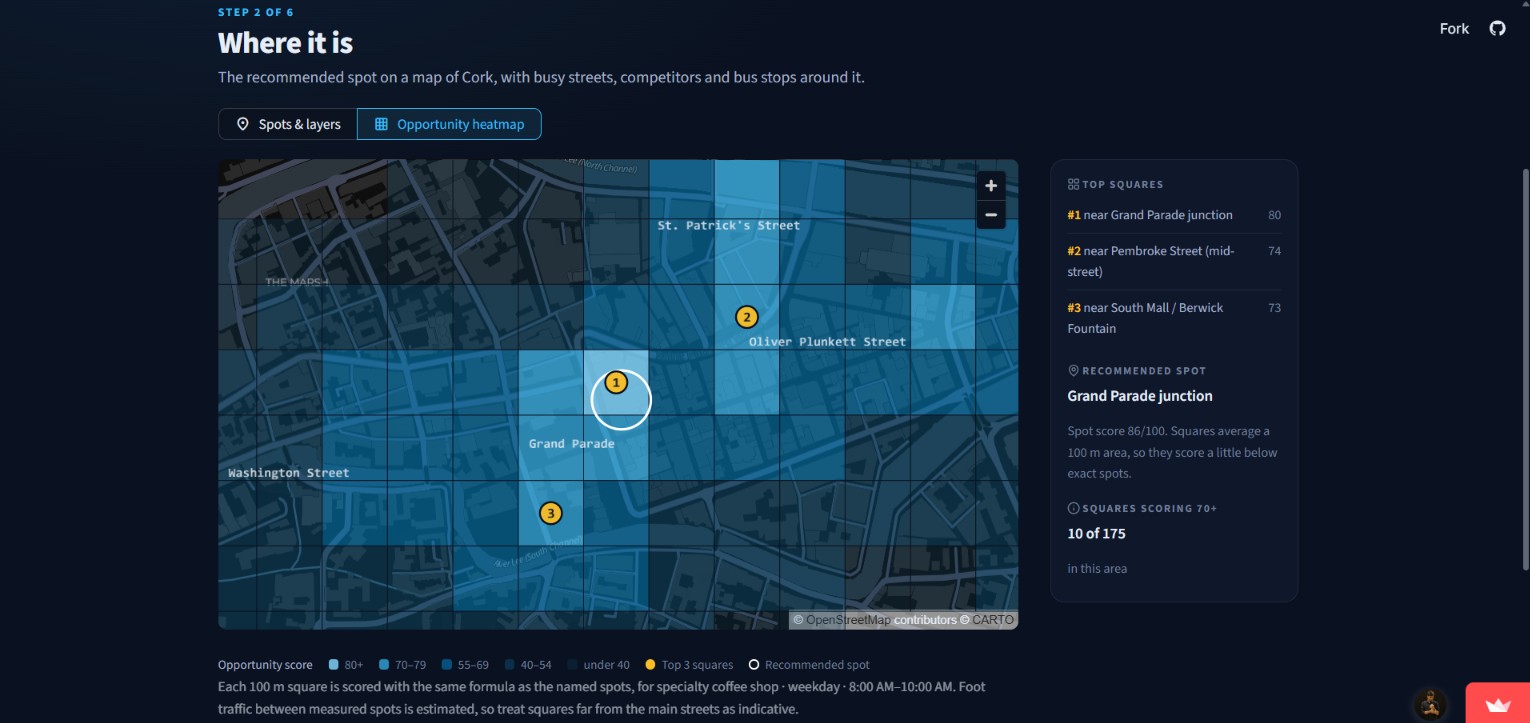
- 🗺️ Opportunity heatmap: every 100 m square of Cork scored, with the top 3 spots marked
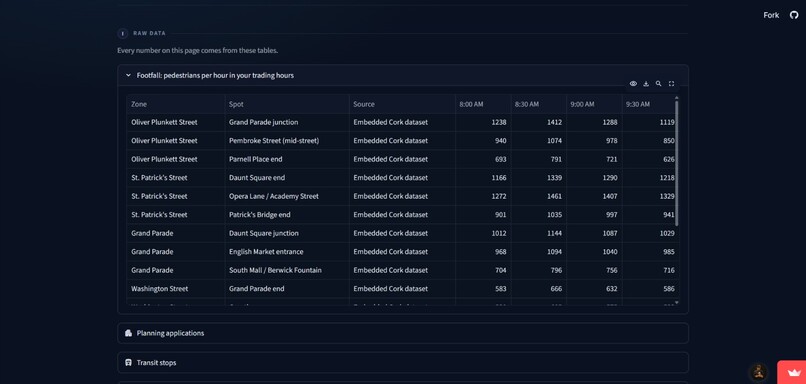
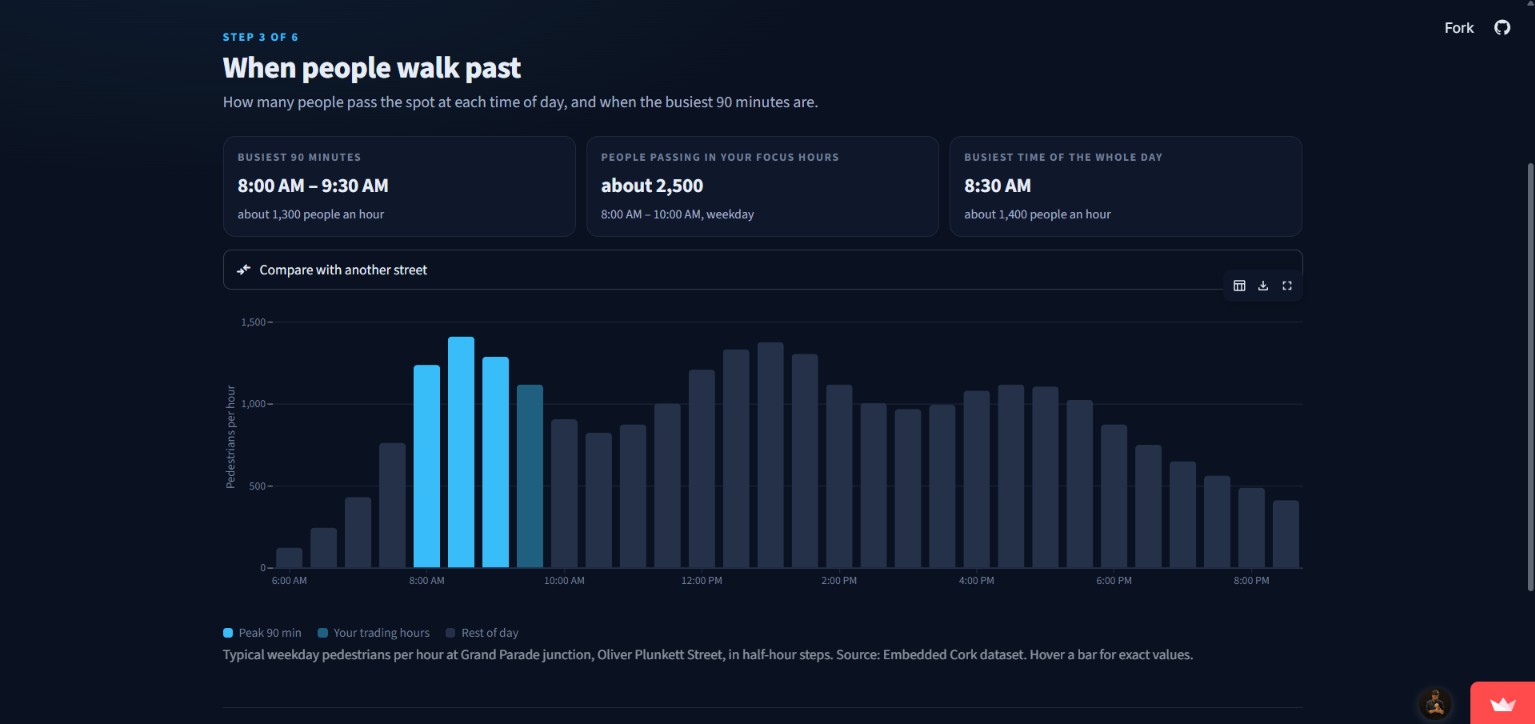
- 🚶 Footfall by hour: weekday, Saturday or Christmas season
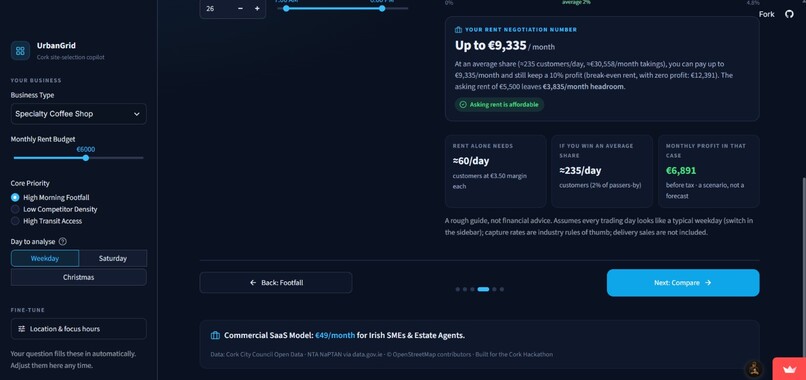
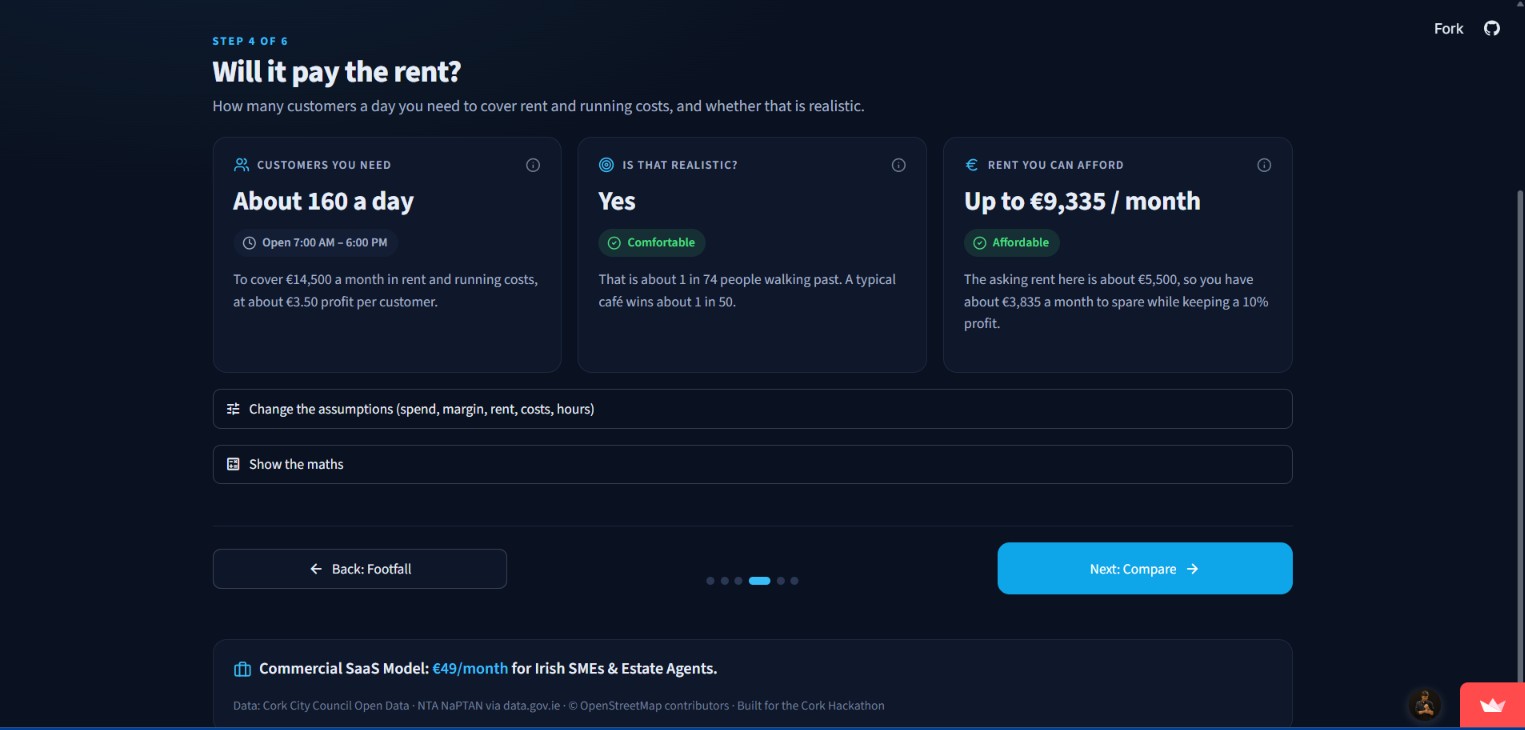
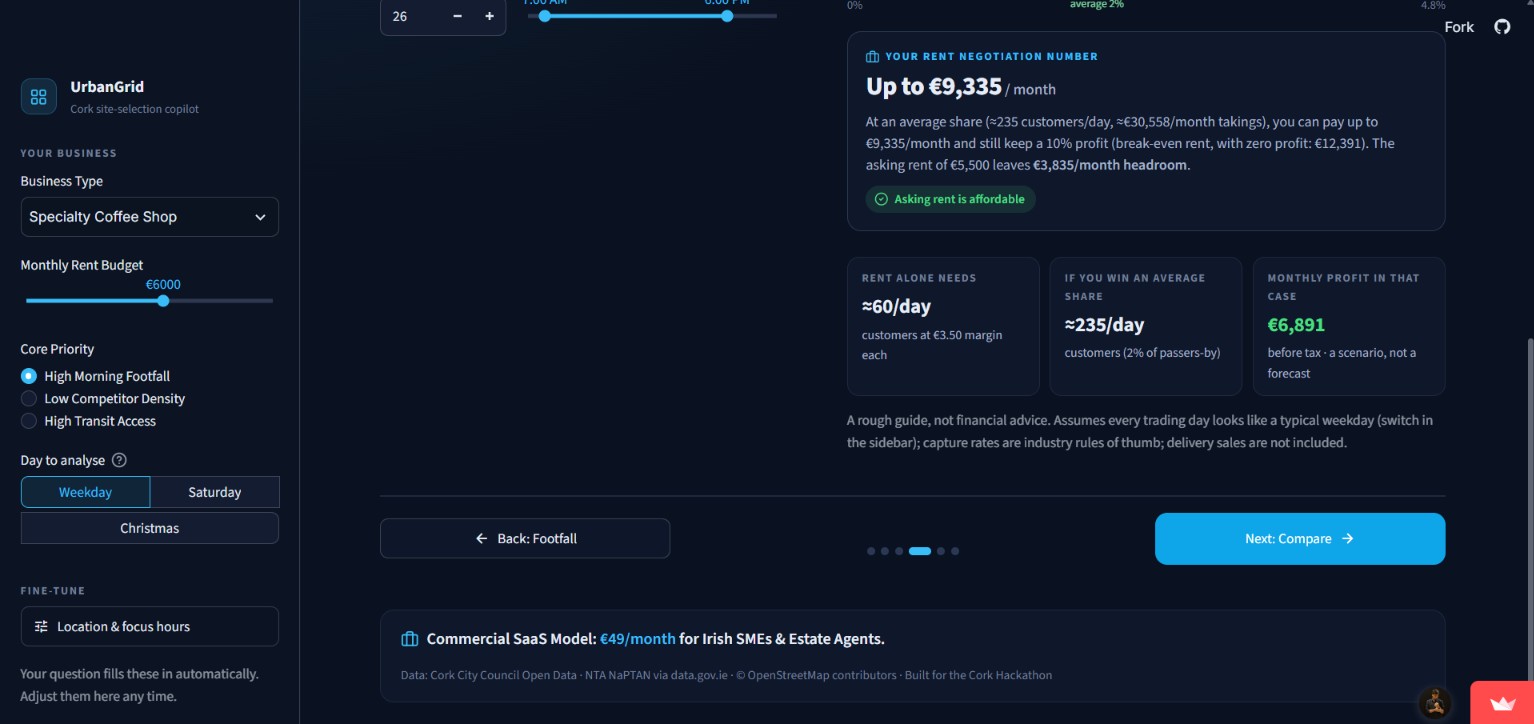
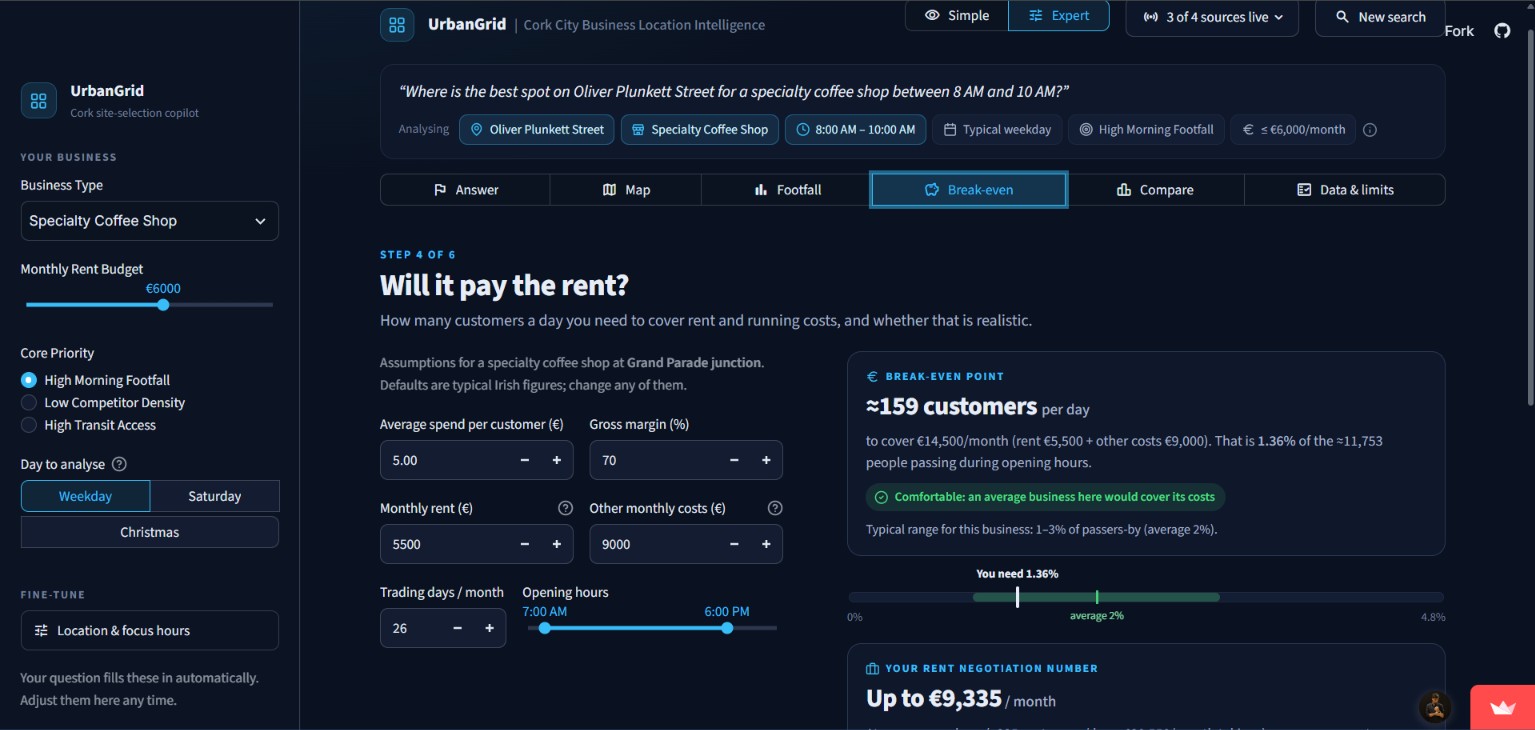
- 💶 Break-even & rent number: how many customers you need a day, and the most rent you can afford
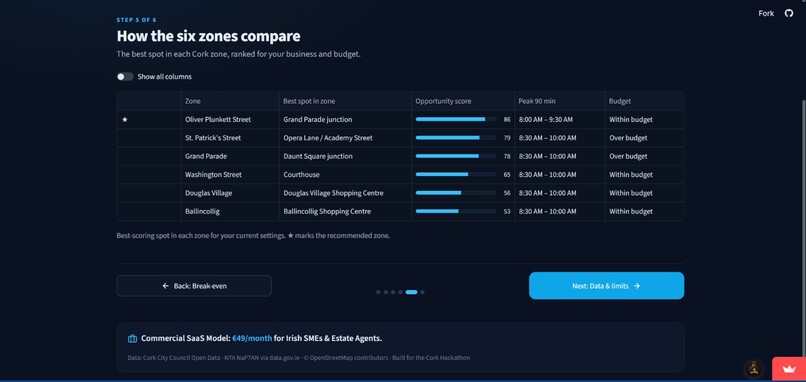
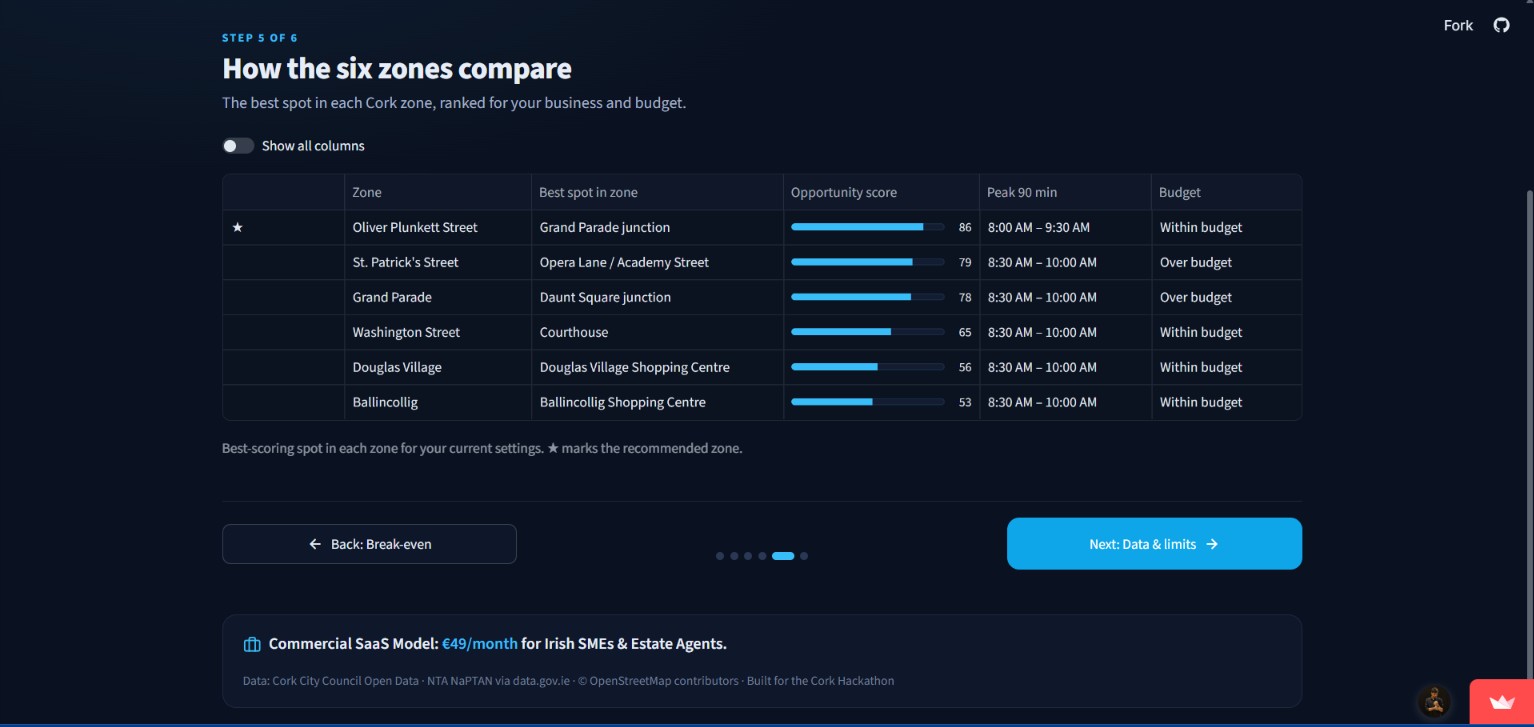
- 📊 Zone comparison across six Cork areas
- 📄 One-click PDF report to show a bank, landlord or business partner
A Simple / Expert switch keeps it friendly for first-time owners, while every number and data source stays one click away.
How we built it
UrbanGrid is a Python + Streamlit app, using Pandas/NumPy for the analysis, pydeck for maps, Altair for charts and fpdf2 for the PDF. It pulls live data from data.corkcity.ie, data.gov.ie (NTA bus stops) and OpenStreetMap. If any source is down, that source falls back to built-in Cork data, so the app never crashes.
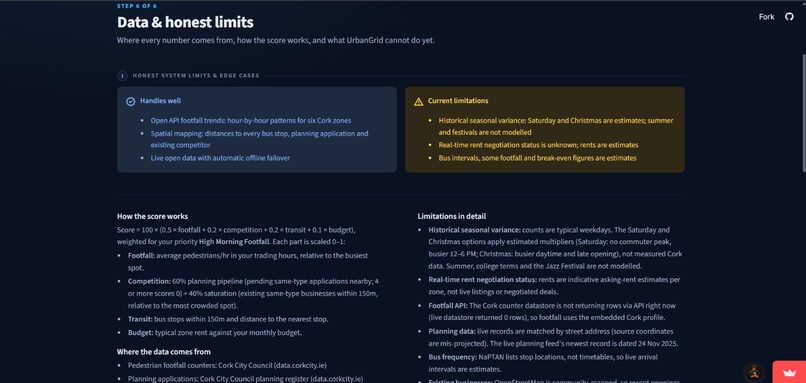
Every spot gets four scores between 0 and 1 (footfall $F$, competition $C$, transport $T$, budget $B$), weighted by what matters most to you:
$$\text{Score} = 100\,(w_F F + w_C C + w_T T + w_B B)$$
Break-even customers per day come from rent $R$, other costs $O$, average spend $s$, margin $m$ and trading days $D$:
$$N = \frac{R + O}{s \cdot m \cdot D}$$
Questions are understood by a lightweight rule-based parser instead of an LLM. That makes answers instant and free to run, and the parser can't make things up.
Challenges we ran into
- Messy open data. The footfall API returned zero rows and the planning coordinates were in the wrong place, so I matched planning records by street address and built a fallback for every source.
- Slow map data. OpenStreetMap servers took 20–40 seconds to respond, so I embedded a snapshot and refresh it quietly in the background.
- Too much information. Testers got lost in my first version, so I rebuilt it as a landing page plus a six-step guided tour. It uses plain-English sentences like "about 1 in 74 people walking past".
Accomplishments that we're proud of
- One sentence in, one clear answer out, in seconds
- Four public data sources combined into one score, and it still works with the internet off
- A rent negotiation number owners can take straight to a landlord
- Honest by design: estimates are labelled, and the app's limits are listed on their own page
What we learned
Public data only helps people once it's translated: "a bus every 4 minutes" beats a table of stop codes. And every API will fail at some point, usually during a demo, so plan for that from day one.
What's next for UrbanGrid: Instant Intelligence for Retail Expansion
- Real Saturday and seasonal footfall once Cork's counters publish historical data
- Alerts when a competitor applies for planning near your shortlist
- More Irish cities and live rental listings
- A €49/month plan for Irish small businesses and estate agents


