-
-
-
-
-
-
-
-
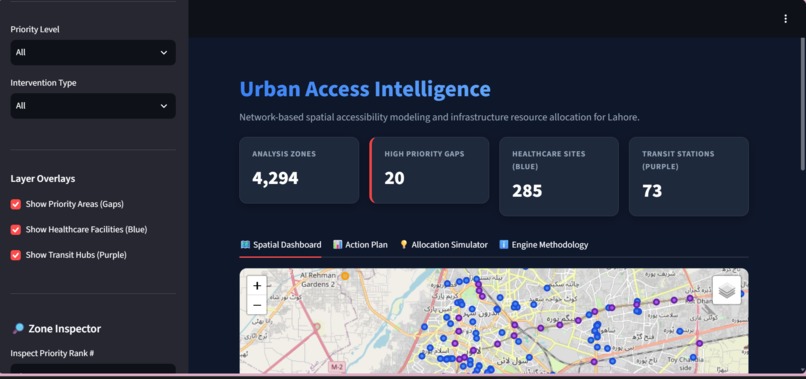
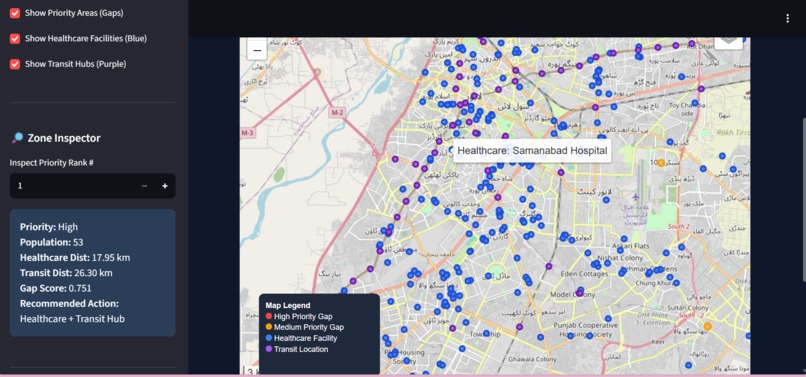
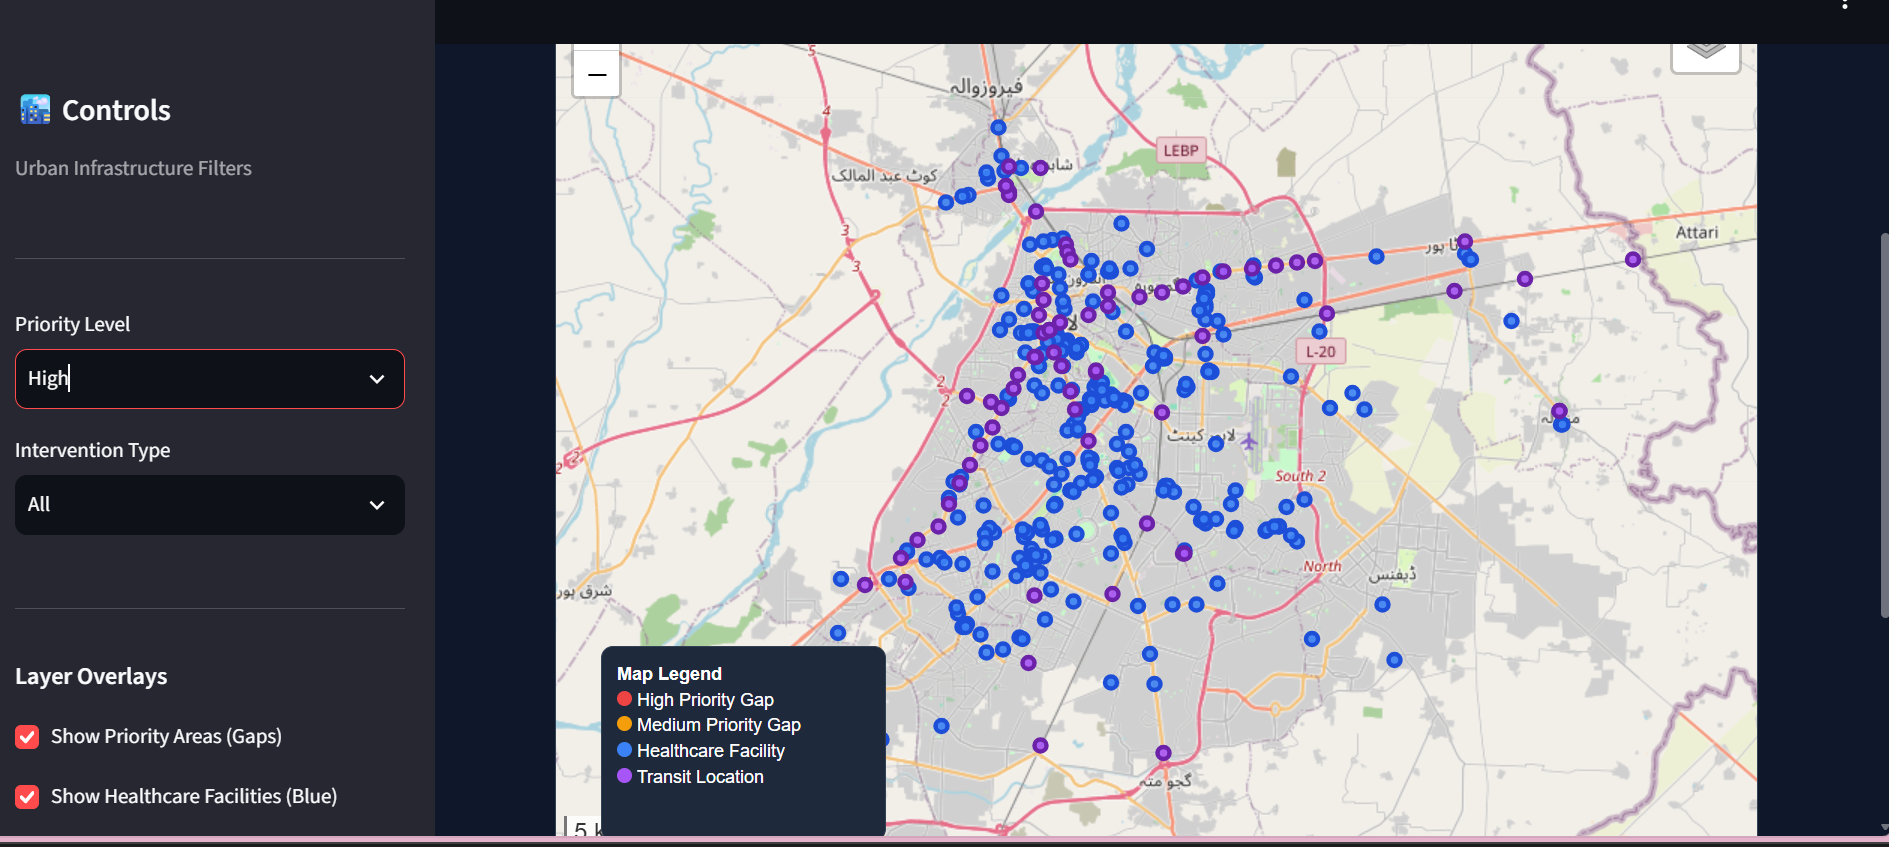
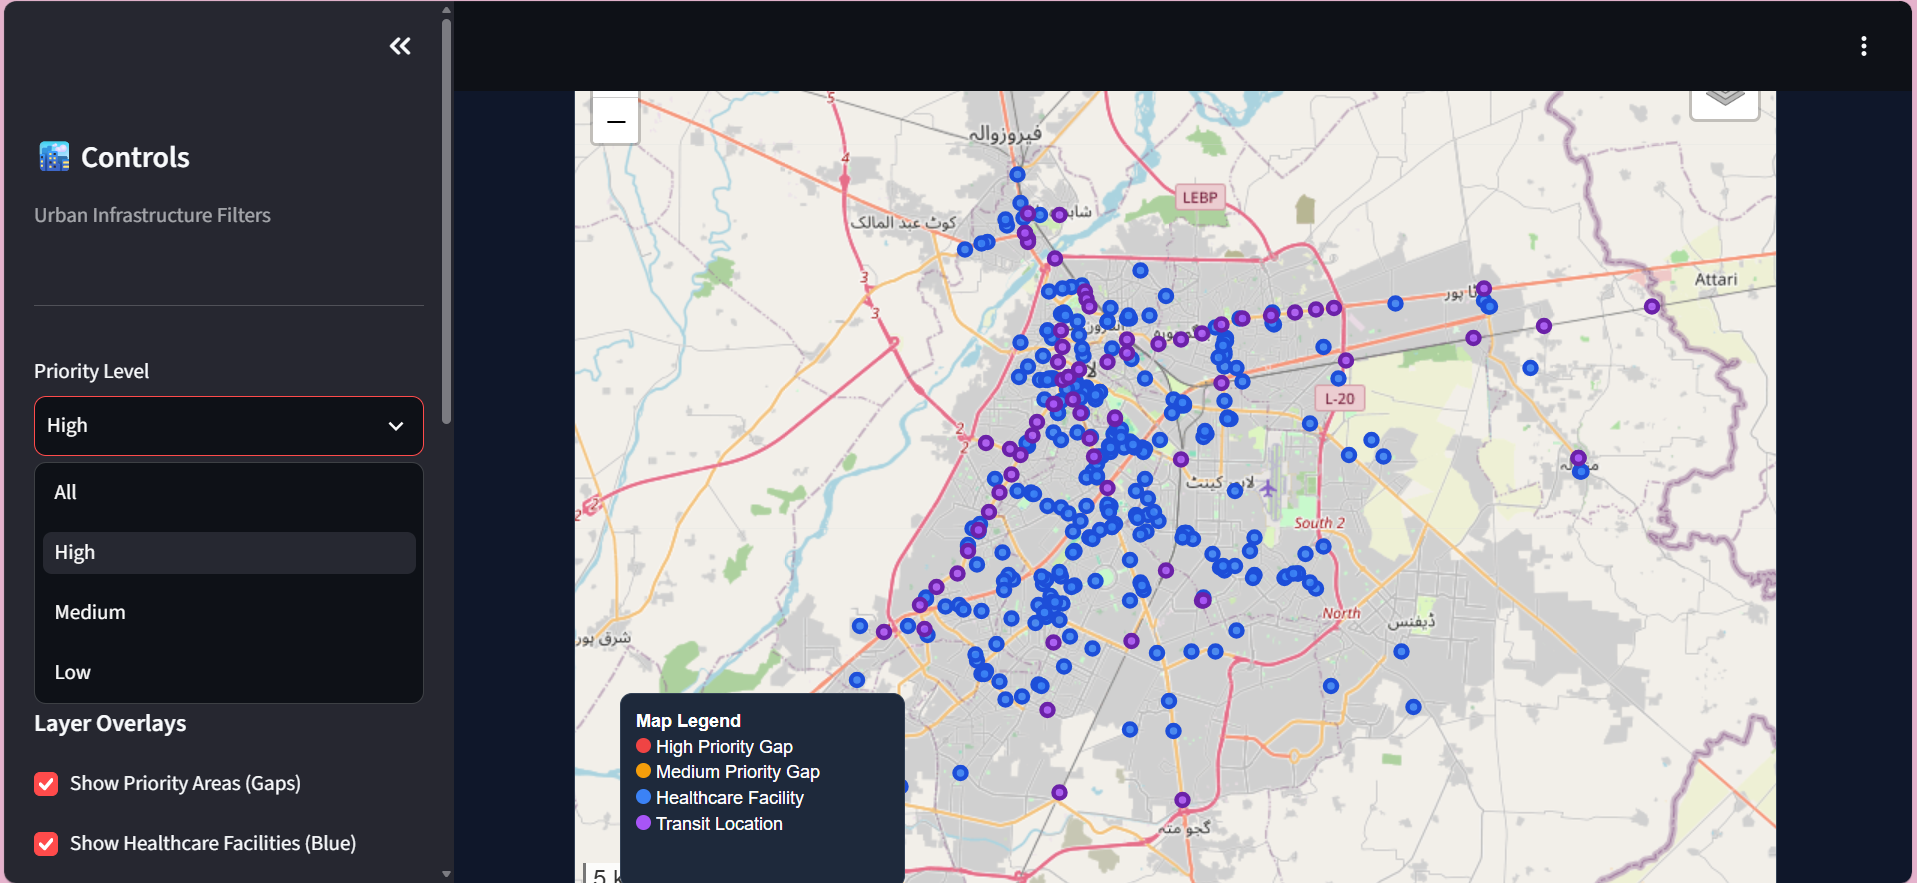
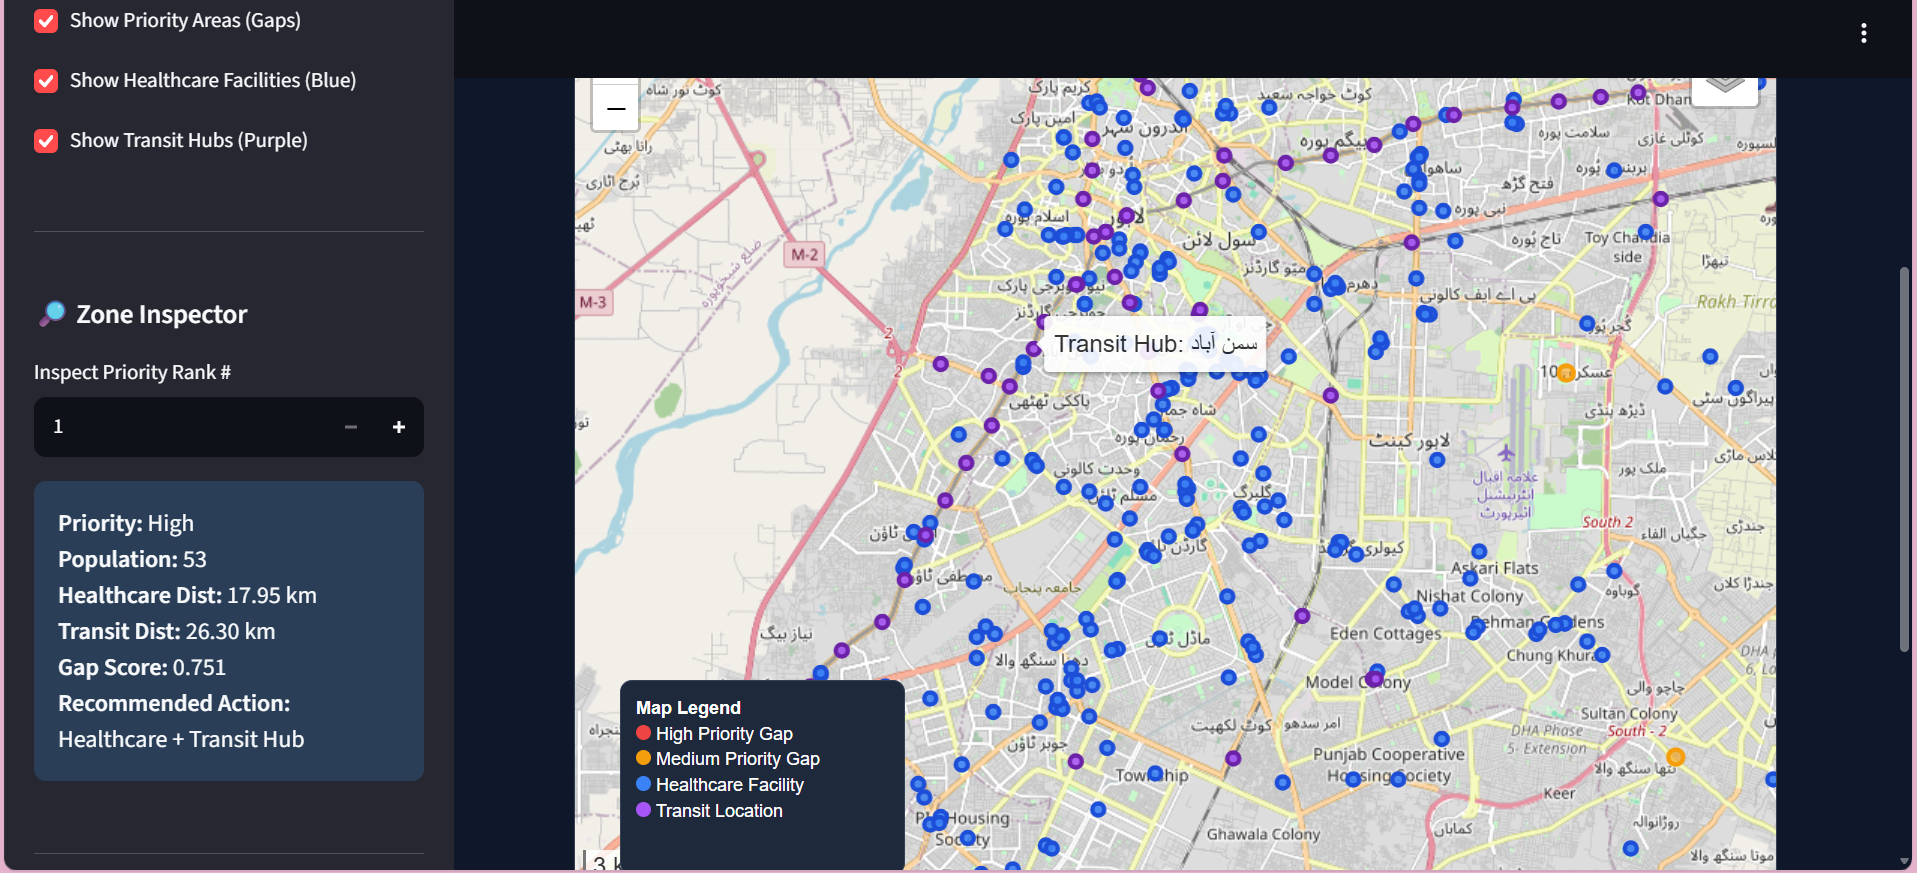
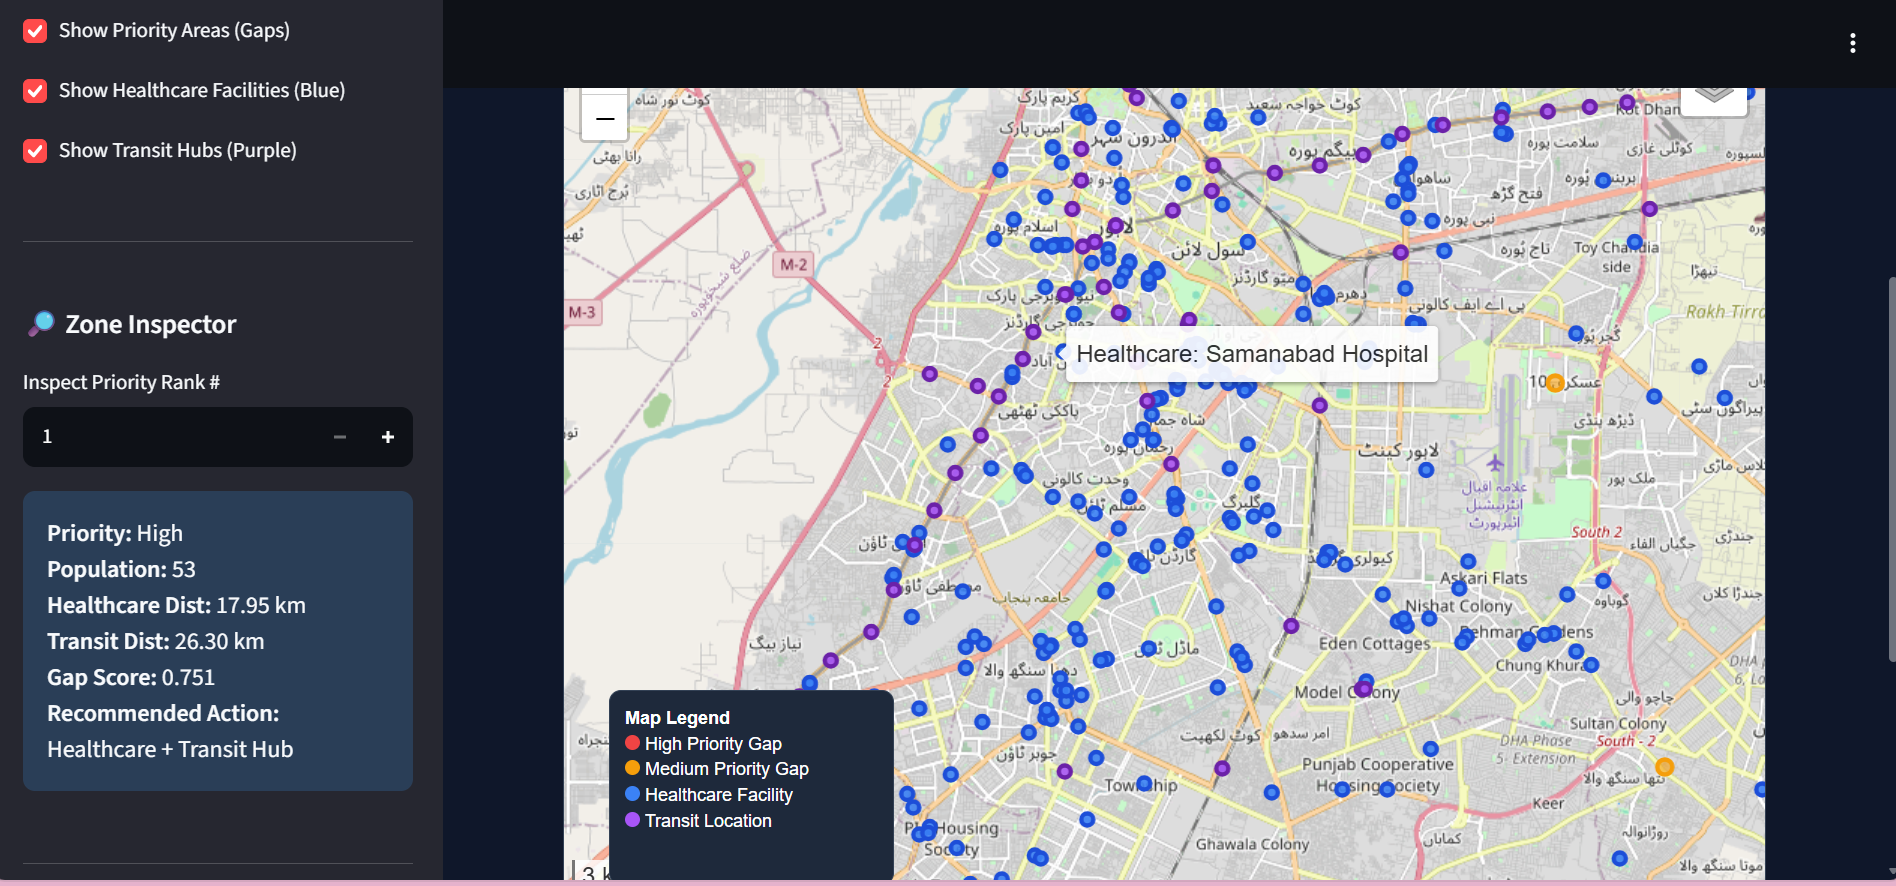
Interactive city-wide urban resource accessibility dashboard.
-
-
-
-
-
-
About the Project
The Inspiration
Lahore is a rapidly growing city, but having resources somewhere in the city does not necessarily mean that everyone can access them equally.
We were inspired by a simple question:
What if we could identify not only where resources already exist, but where the city needs them most?
Most mapping applications can show hospitals, transit stations, or other facilities on a map. We wanted to go one step further and build a system that could analyze population distribution and real walking-network accessibility to identify underserved areas and suggest where new resources should be prioritized.
For our initial prototype, we focused on healthcare and public transport, two services where physical accessibility can have a major impact on people's daily lives.
What We Built
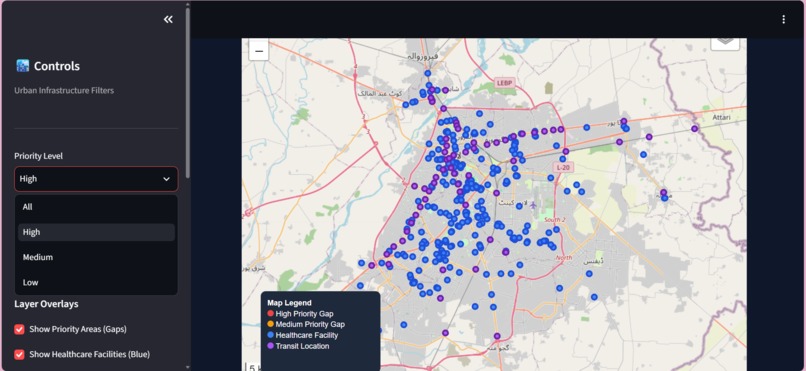
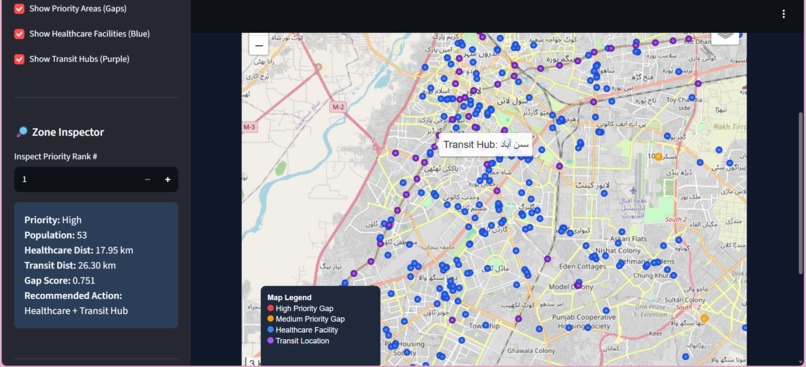
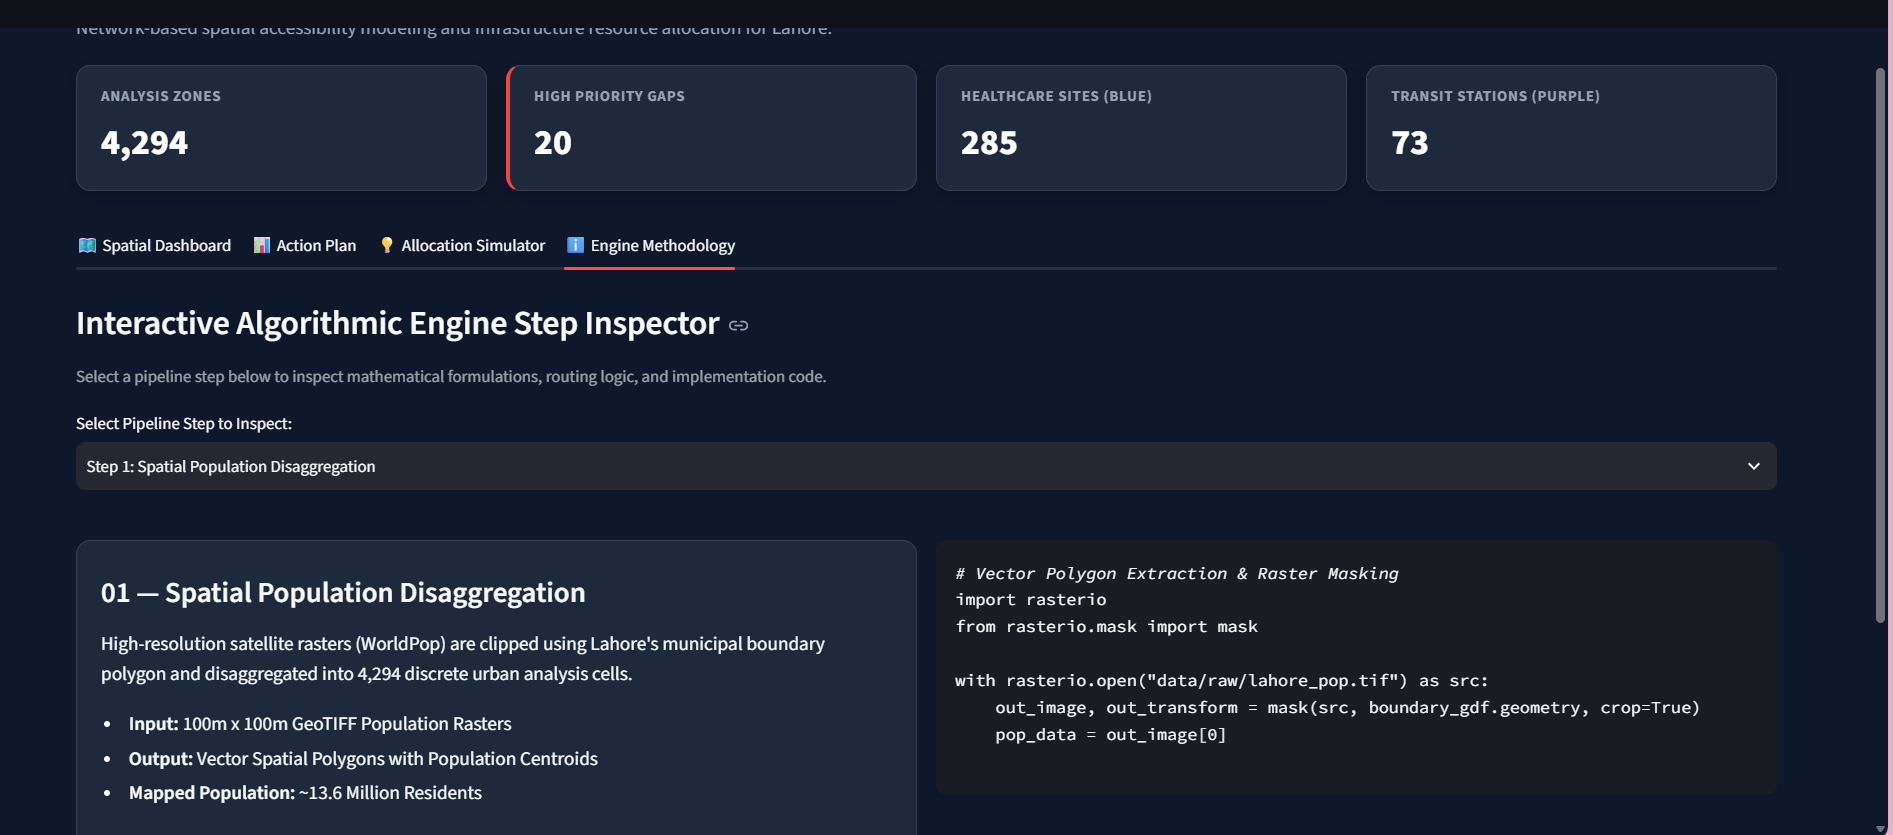
We built Lahore Urban Resource Intelligence, a geospatial decision-support prototype that combines population data, healthcare facilities, public transit locations, and Lahore's walking-road network.
The system follows this pipeline:
Population Data → Analysis Zones → Road Network → Accessibility Analysis → Resource Gap Score → Recommendation
Instead of calculating only straight-line distances, we connect population areas and facilities to a walking network and calculate shortest-path distances.
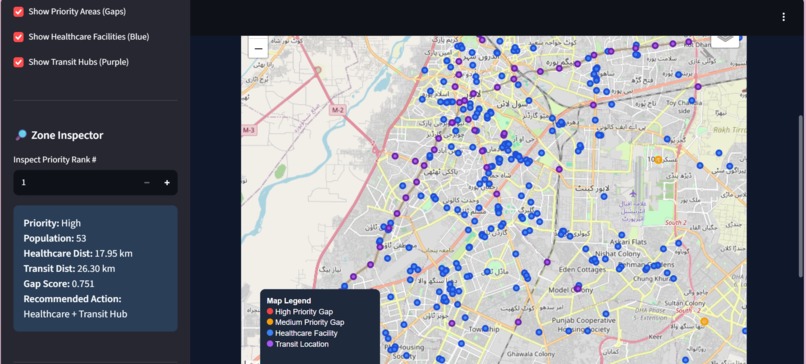
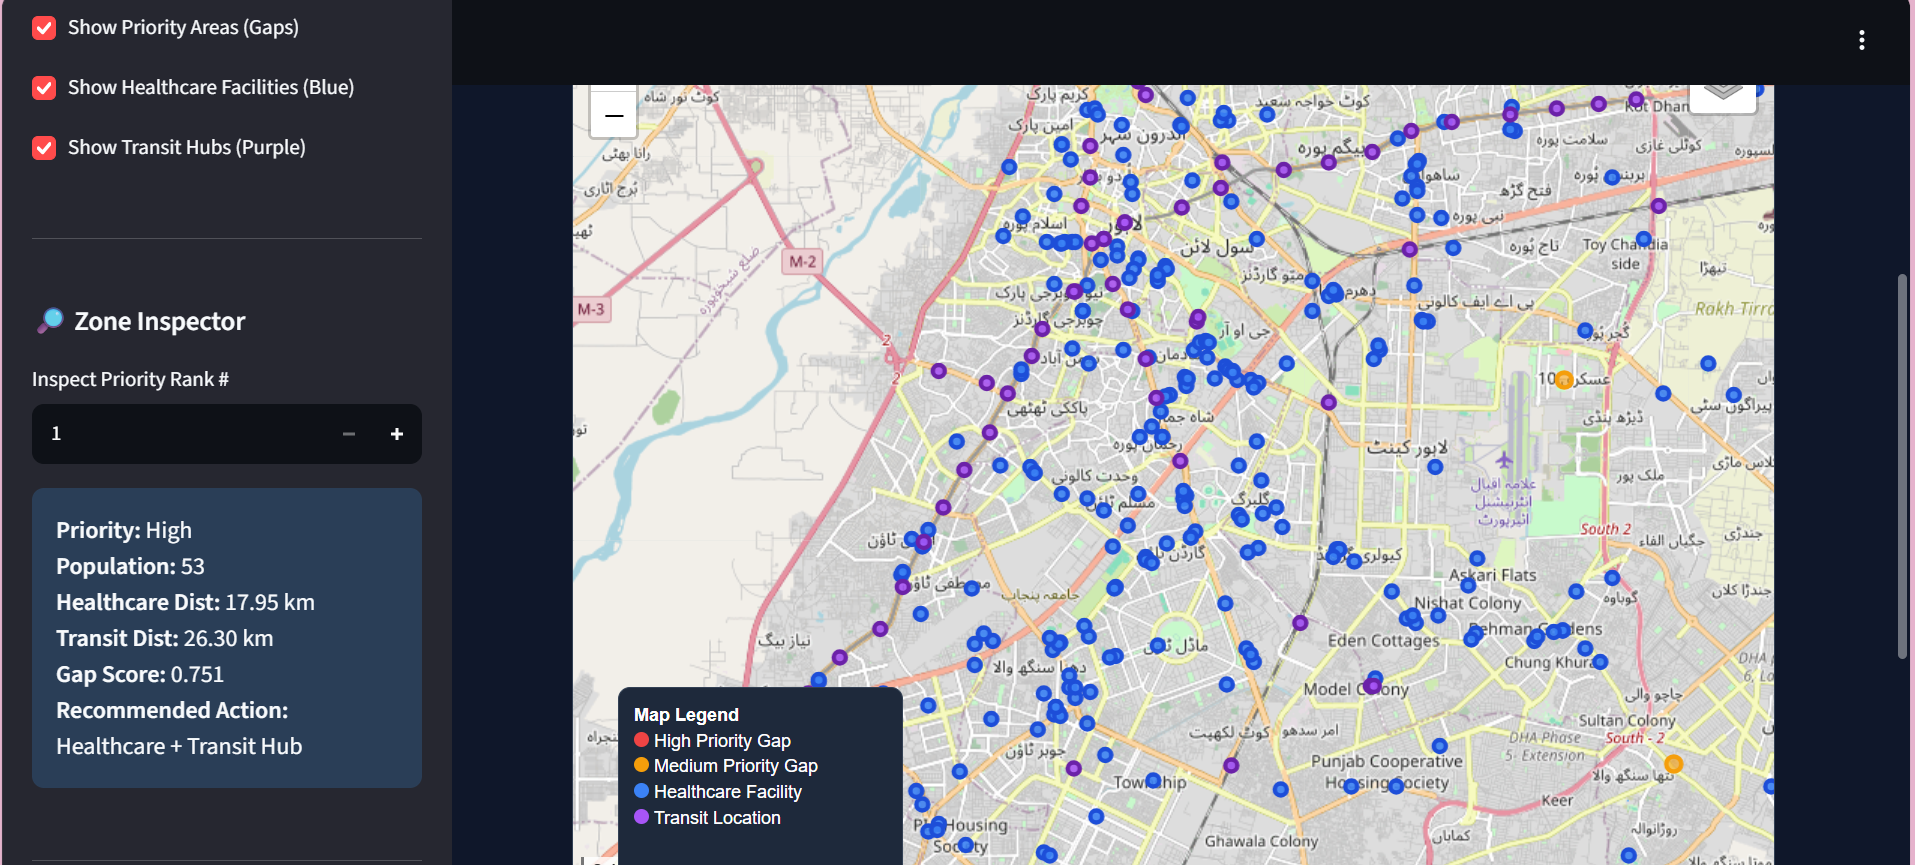
For each analysis zone, the system calculates:
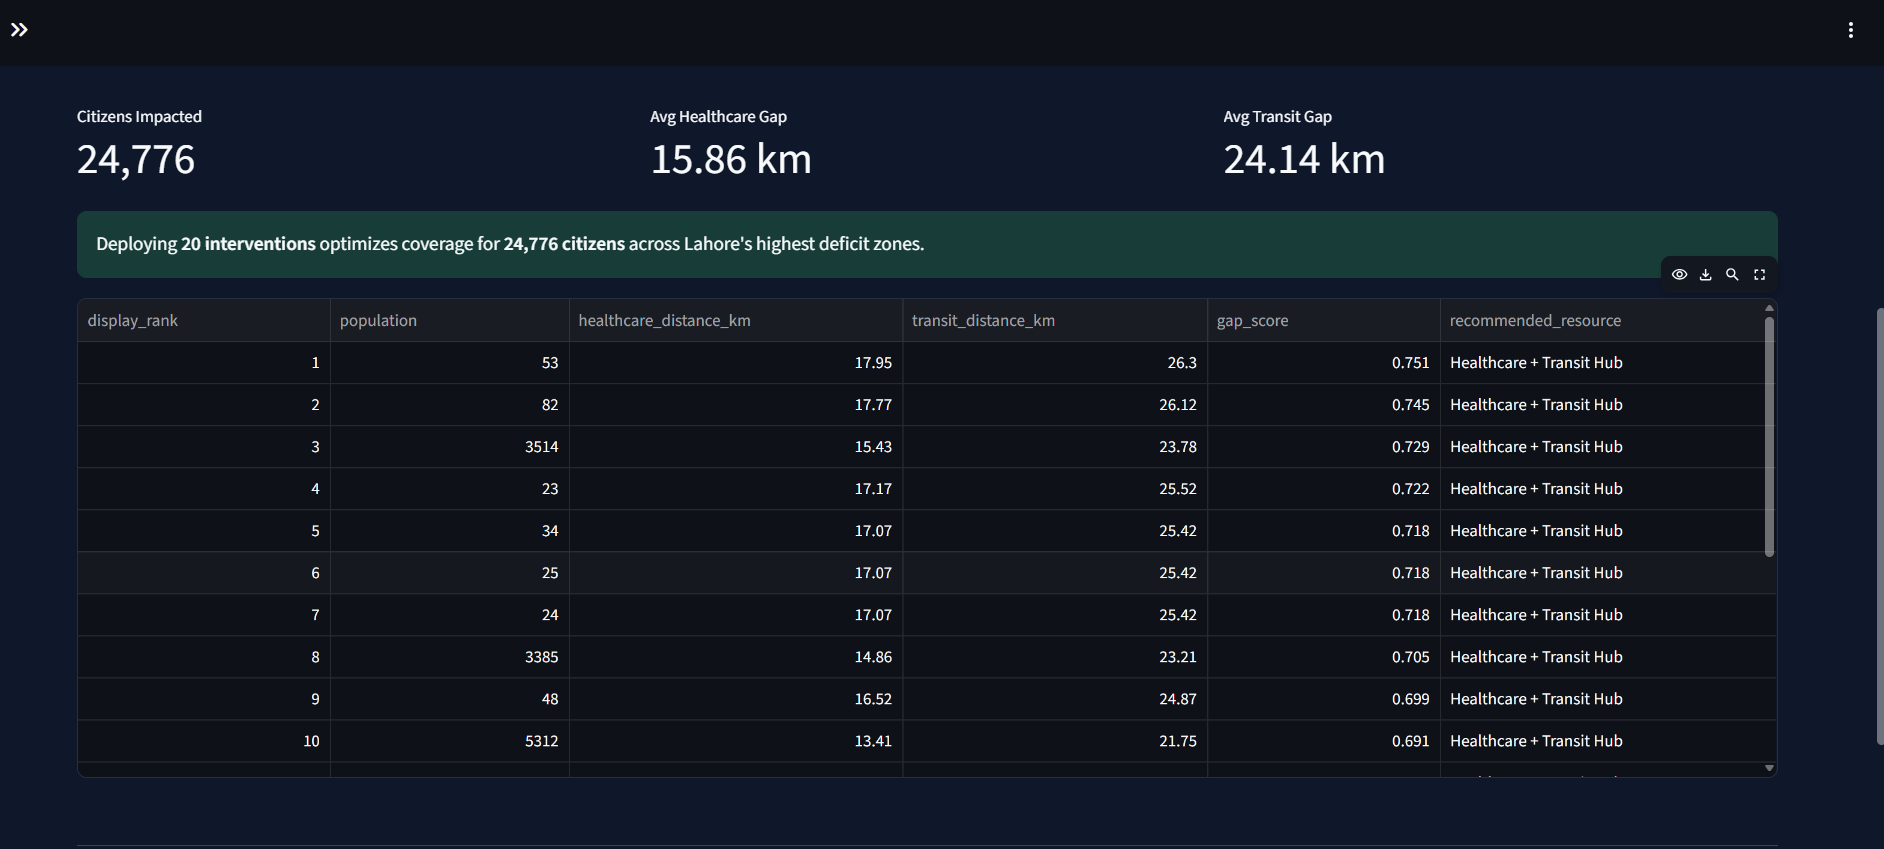
$$ GapScore = 0.45H + 0.30T + 0.25P $$
where:
- (H) = normalized healthcare distance
- (T) = normalized transit distance
- (P) = normalized population
A higher score represents a greater potential resource gap.
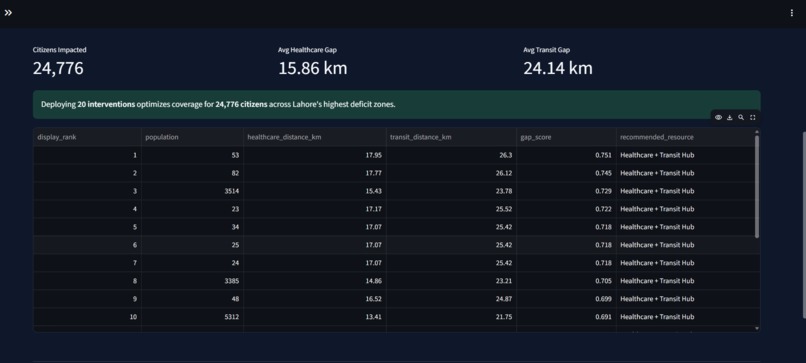
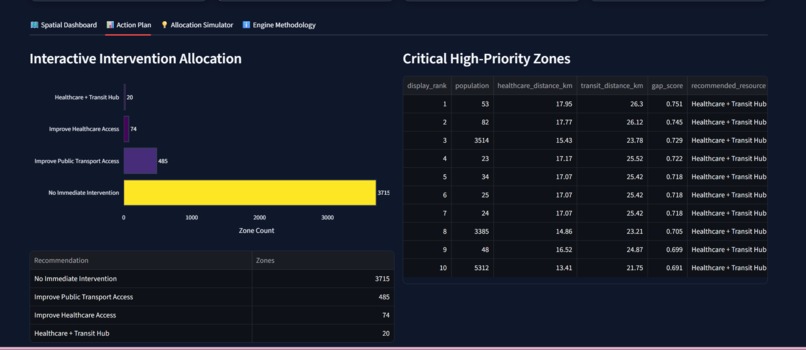
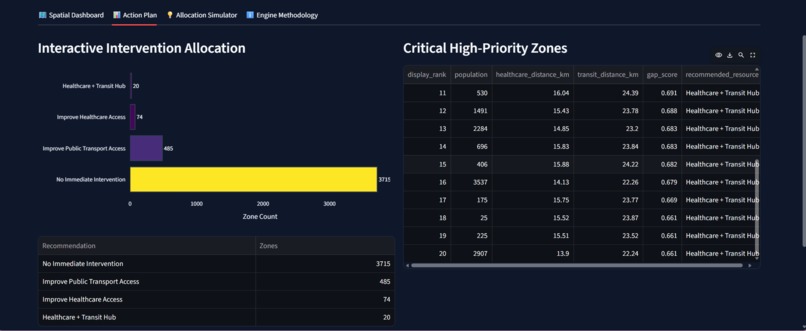
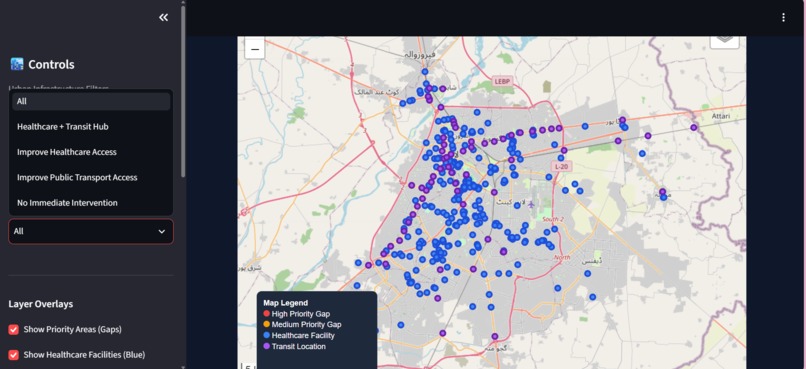
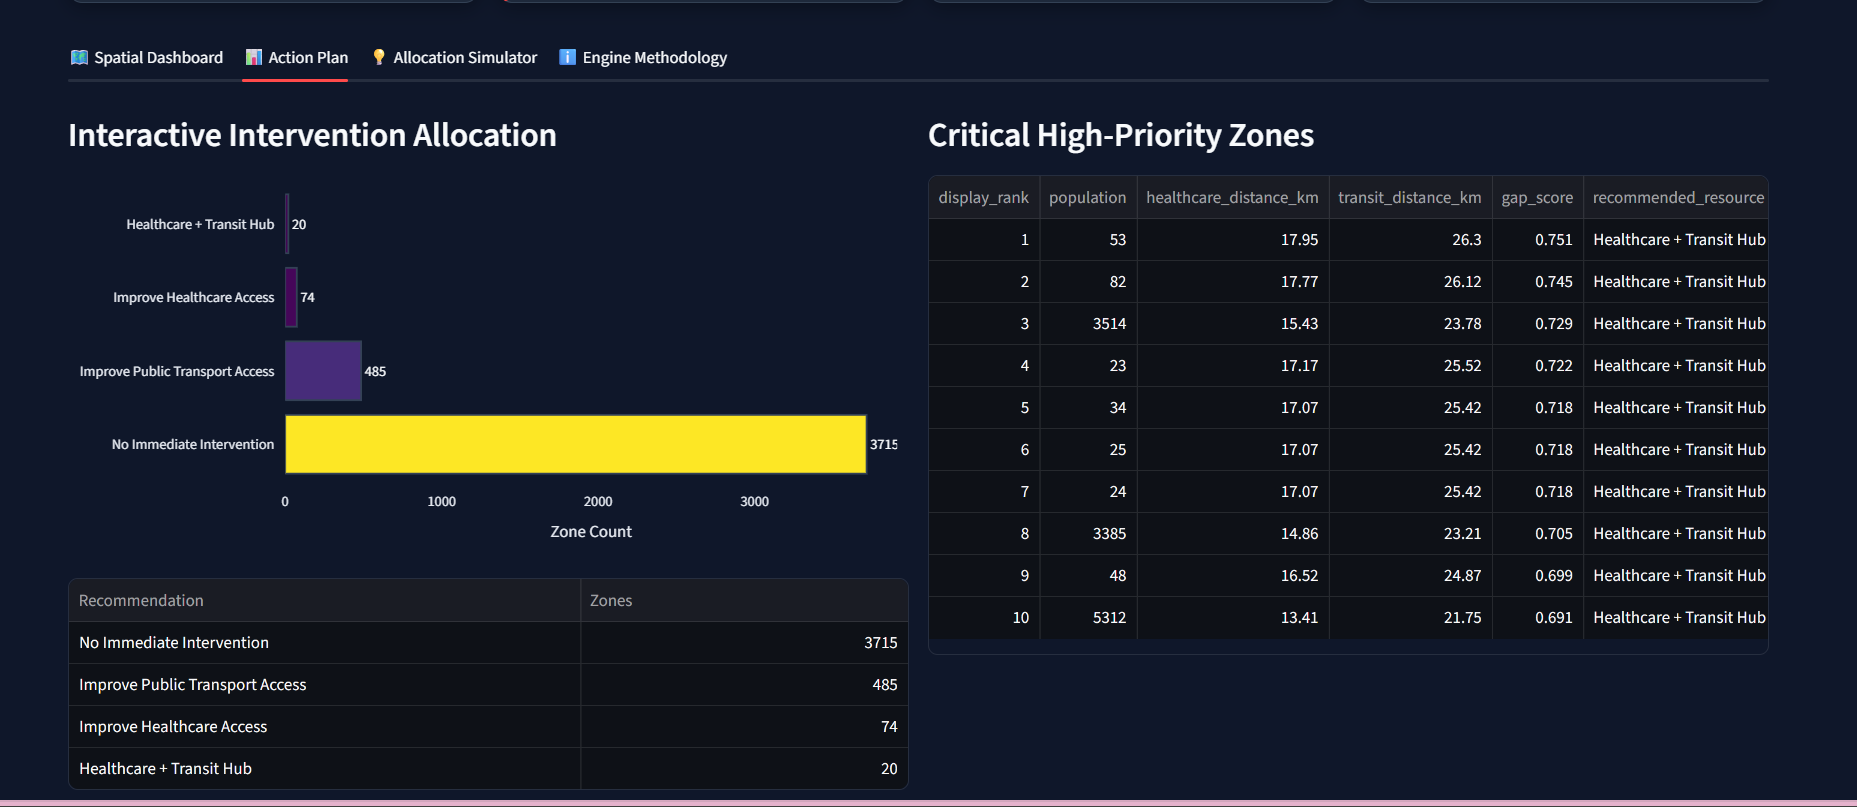
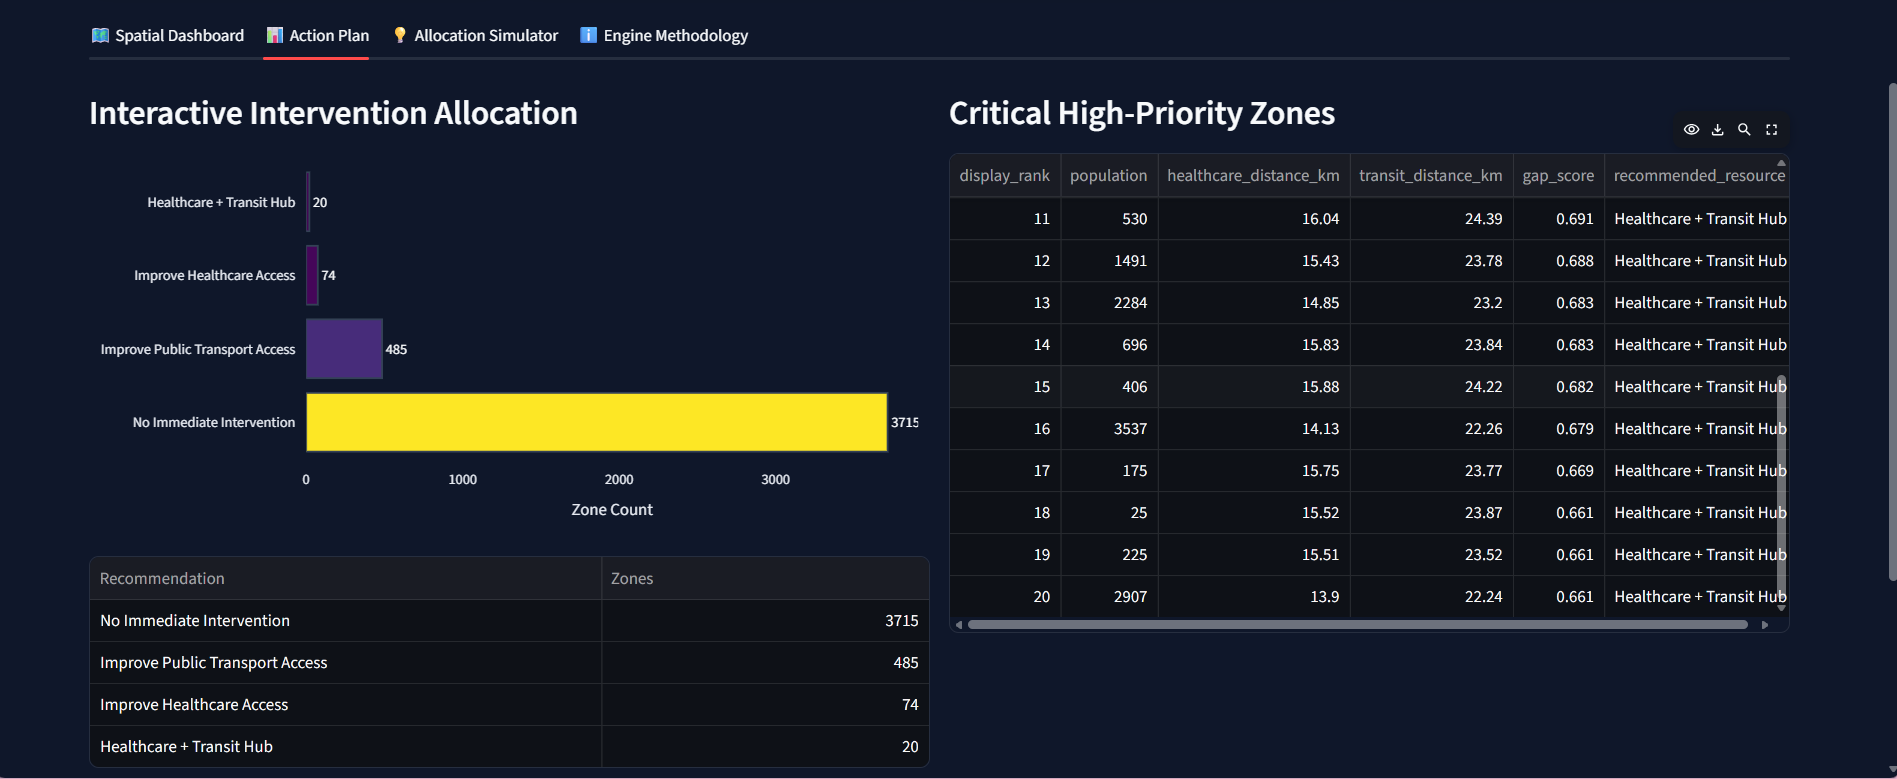
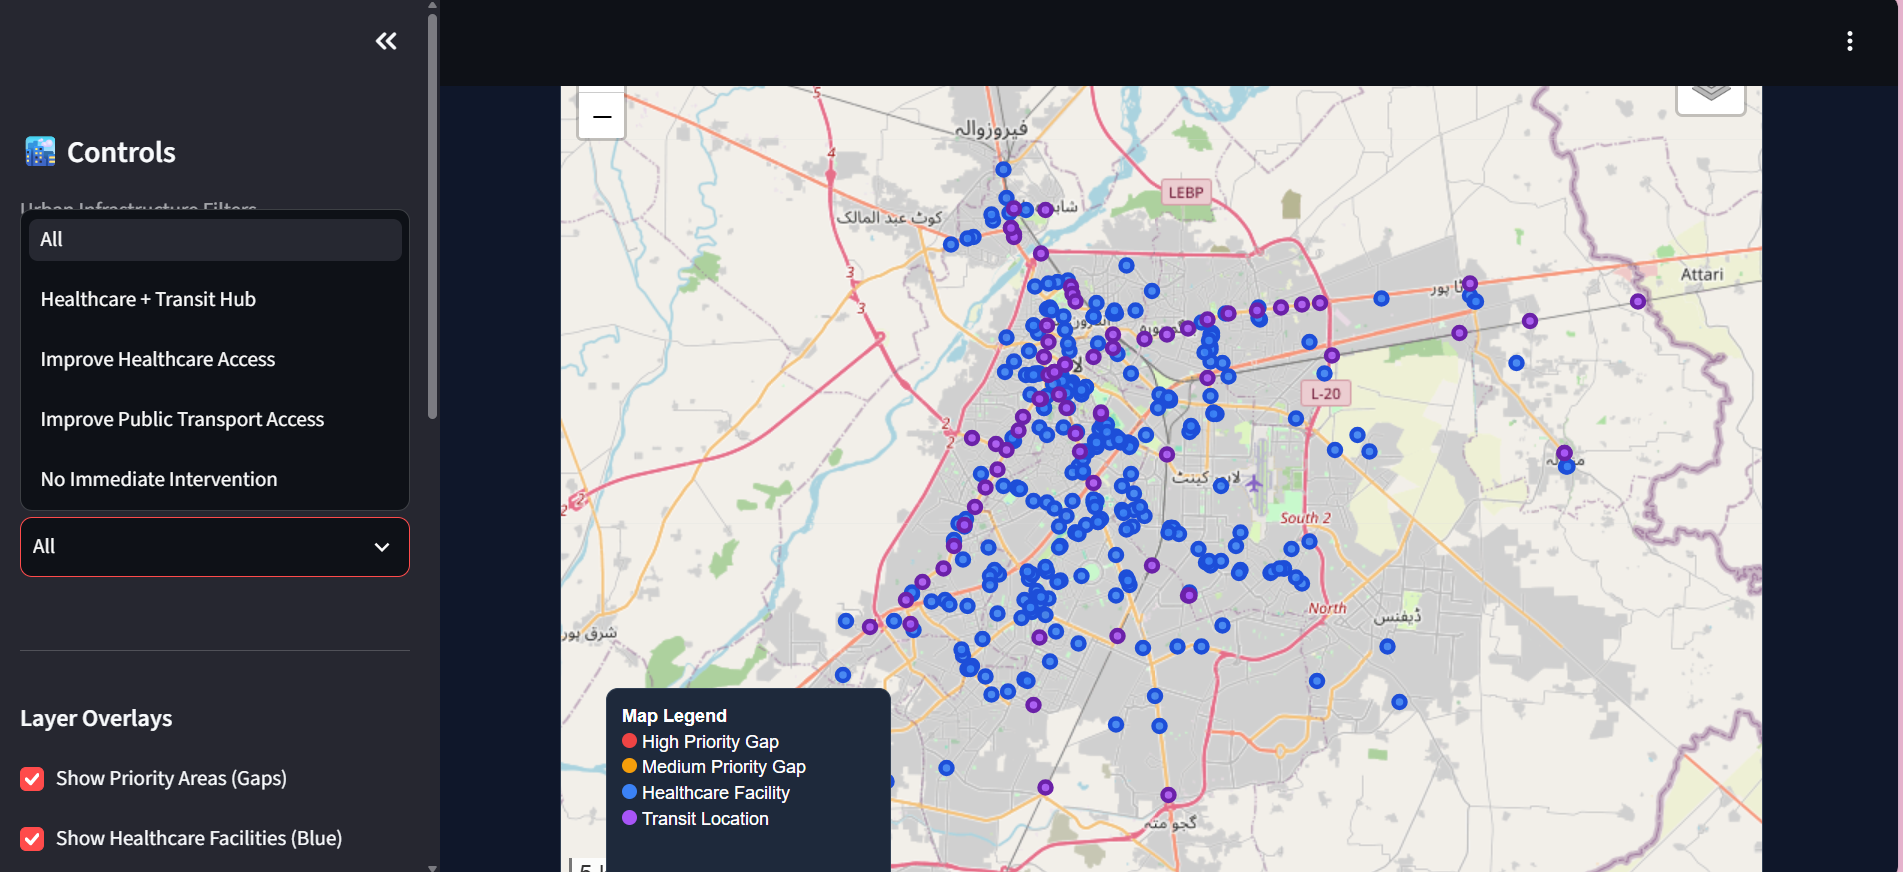
The system then classifies areas into priority levels and generates recommendations such as:
- Improve Healthcare Access
- Improve Public Transport Access
- Healthcare + Transit Hub
- No Immediate Intervention
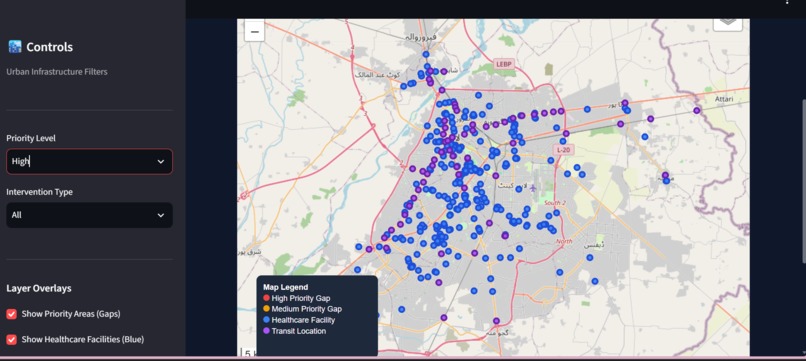
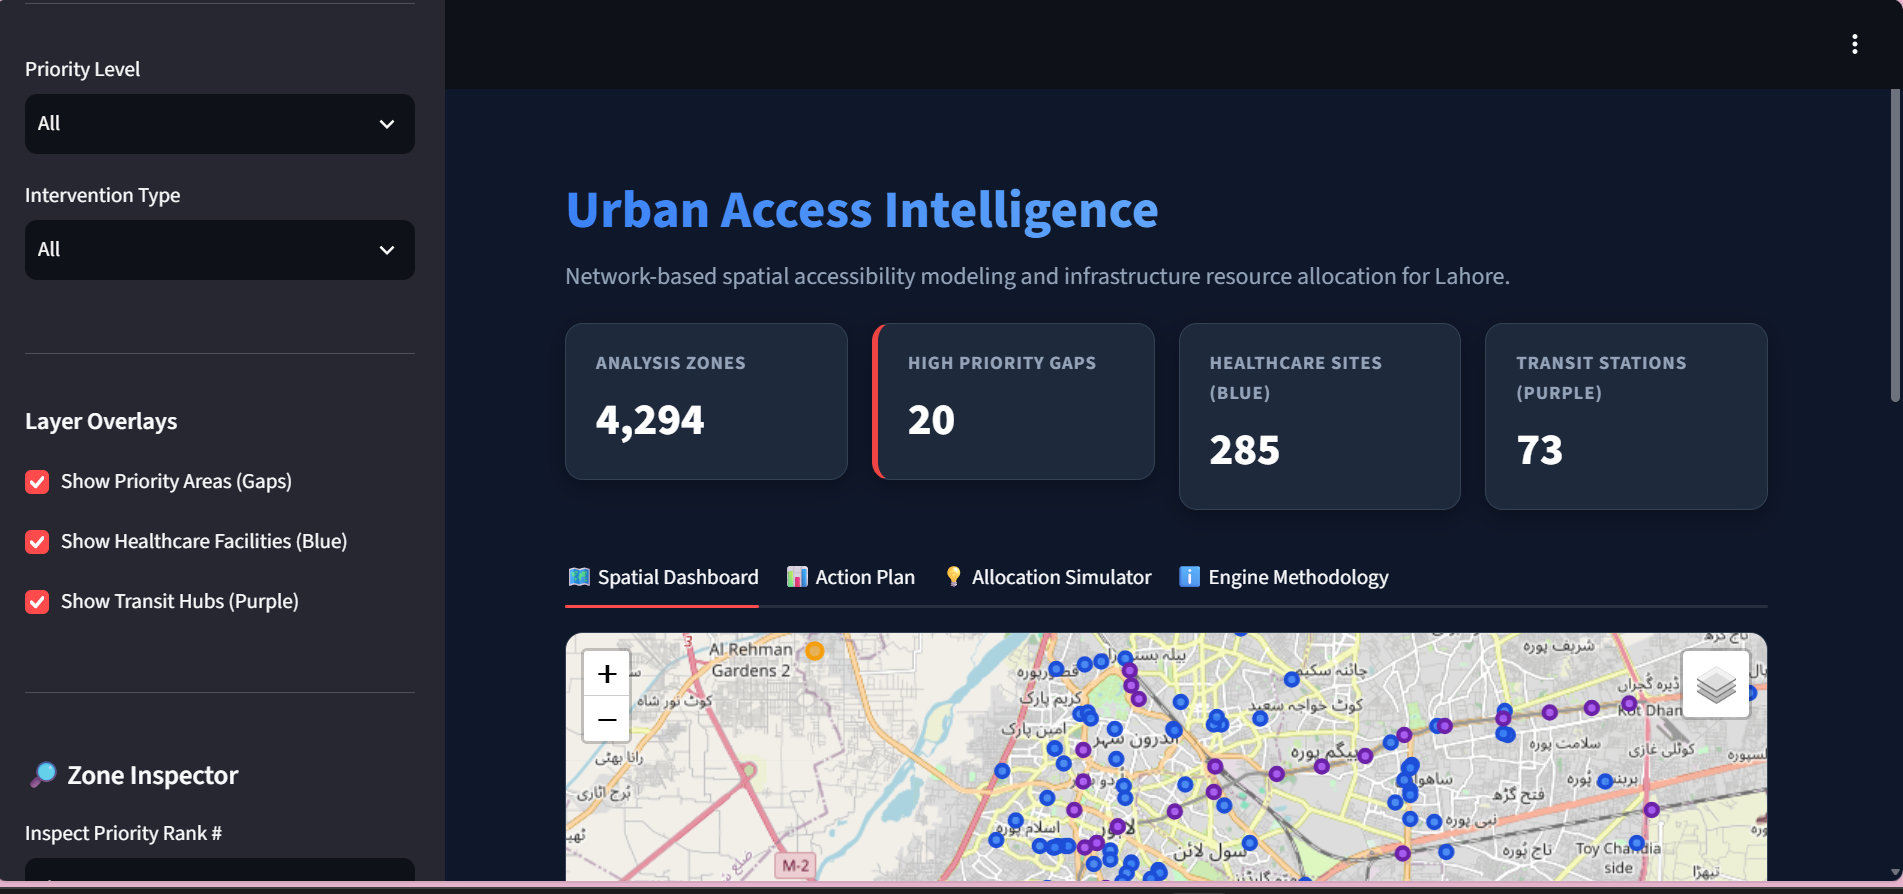
The final results are presented through an interactive Streamlit map.
How We Built It
The project was developed primarily in Python using a geospatial and network-analysis stack.
We used:
- GeoPandas and Shapely for geospatial processing
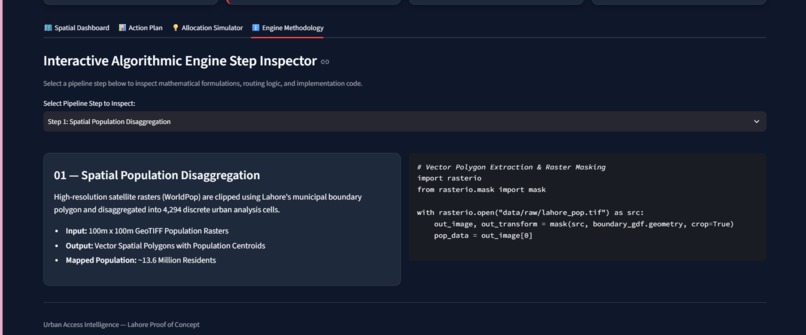
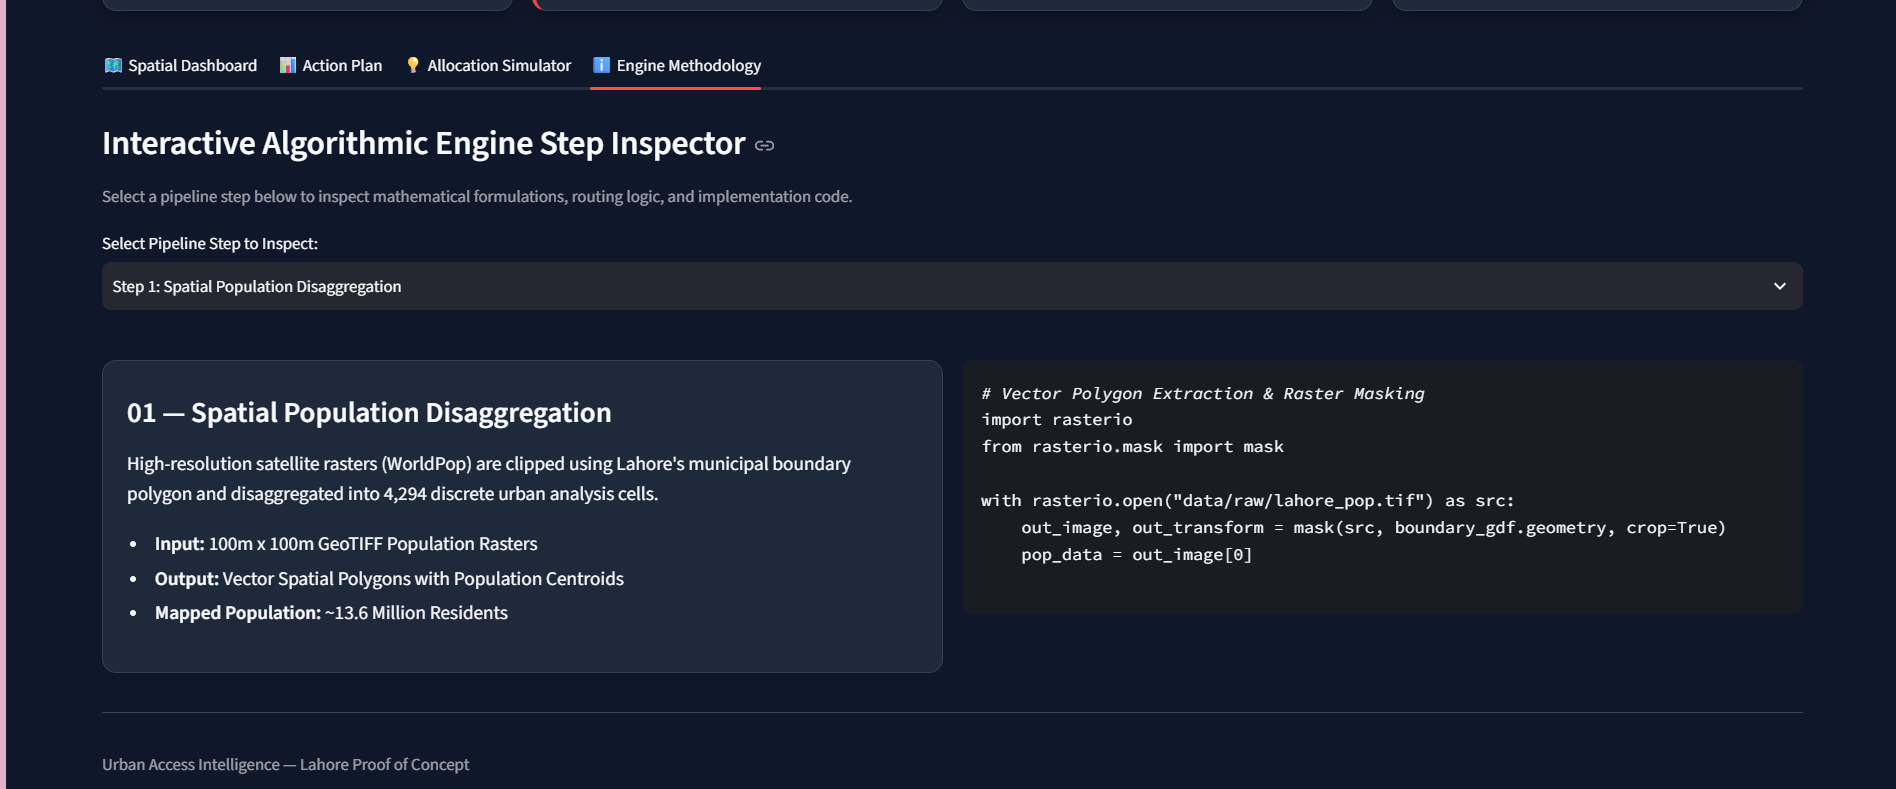
- Rasterio for population raster data
- OSMnx and NetworkX for the Lahore road network and shortest-path analysis
- SciPy for efficient spatial nearest-neighbor searches
- Pandas and NumPy for data processing
- Streamlit and Folium for the interactive dashboard
One of the biggest technical decisions was using the actual road network rather than relying on Euclidean distance. A location that appears close on a map may be significantly farther away when streets, road layouts, and network connectivity are considered.
To make the accessibility calculation scalable, we also used reverse shortest-path searches from healthcare and transit destinations instead of repeatedly calculating complete routes independently for every population zone.
What We Learned
This project taught us that building a geospatial system is not simply about putting points on a map.
The difficult part is turning messy real-world data into something that can support meaningful decisions.
We learned how to:
- Clean and standardize inconsistent geospatial datasets
- Handle healthcare facilities represented as different geometry types
- Convert population raster data into analysis zones
- Snap geographic locations to a road network
- Calculate shortest walking distances at scale
- Build population-weighted accessibility scores
- Convert analytical results into actionable recommendations
- Build an interactive geospatial interface around the results
We also learned an important lesson about data quality: a sophisticated algorithm cannot compensate for unreliable input data.
The Challenges
The project involved several unexpected challenges.
Our healthcare and transit datasets were messy and contained inconsistent geographic representations. Some facilities were stored as polygons rather than points, which initially caused geometry errors when calculating coordinates.
The accessibility calculation was another major challenge. Lahore's walking network contains approximately 171,000 nodes and 463,000 edges, making naive shortest-path calculations extremely expensive when thousands of population locations are involved.
We initially processed tens of thousands of population points, which took far too long for a hackathon workflow. We therefore introduced population analysis zones and optimized the network calculations using reverse shortest-path searches.
We also encountered several frontend and dependency issues while integrating Streamlit and Folium. These forced us to repeatedly test the entire pipeline from raw data to the final dashboard.
What Makes It Different
The core idea behind our project is the shift from:
"Where are the resources?"
to:
"Where are the people who need them most?"
The system combines population + existing resources + network accessibility + spatial analysis to produce a recommendation rather than simply a visualization.
Although our current MVP focuses on healthcare and transit, the architecture is designed to expand to schools, parks, emergency services, pharmacies, markets, and other urban resources.
Ultimately, we want to move from simply mapping cities to helping cities make better, data-driven decisions.
Our Current MVP
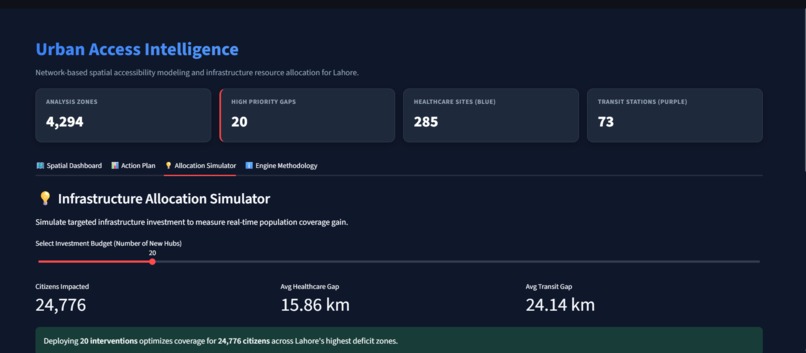
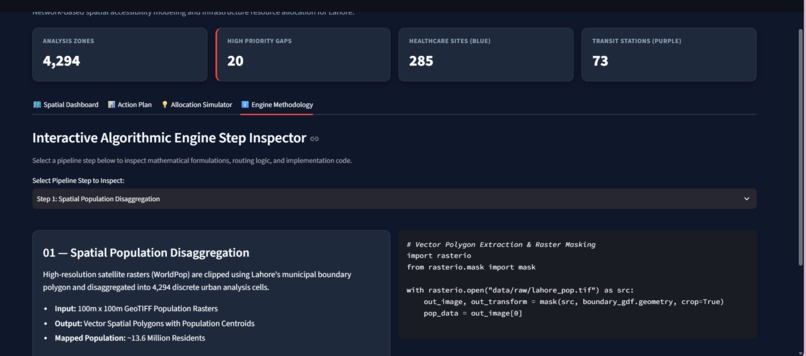
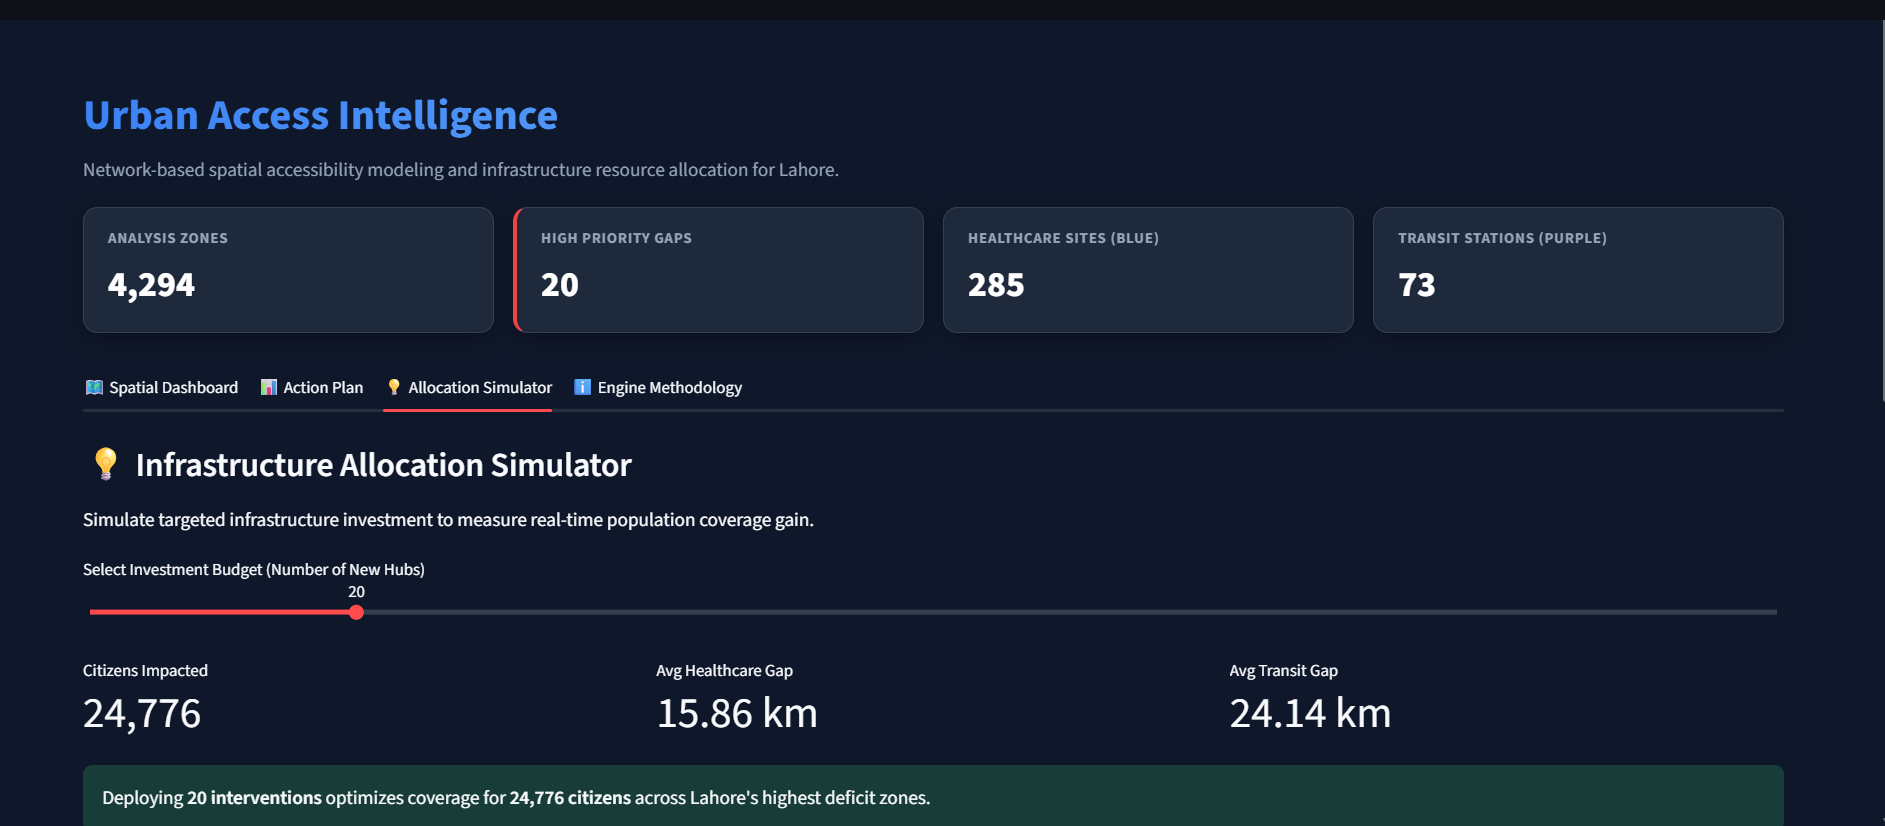
The current prototype analyzes 4,294 population analysis zones, 285 healthcare facilities, and 73 transit locations.
It identifies:
- 20 high-priority areas
- 559 medium-priority areas
- 3,715 low-priority areas
These results demonstrate the core concept of using geospatial accessibility analysis to identify potential urban resource gaps.
This is a hackathon prototype rather than an official planning system. The current datasets can contain incomplete, noisy, outdated, or unofficial information, so the recommendations should be treated as decision-support signals rather than final infrastructure decisions.
With authoritative government datasets, real-time transportation data, facility capacity information, and additional urban services, the same architecture could evolve into a much more comprehensive urban resource intelligence platform.


Log in or sign up for Devpost to join the conversation.