-
-
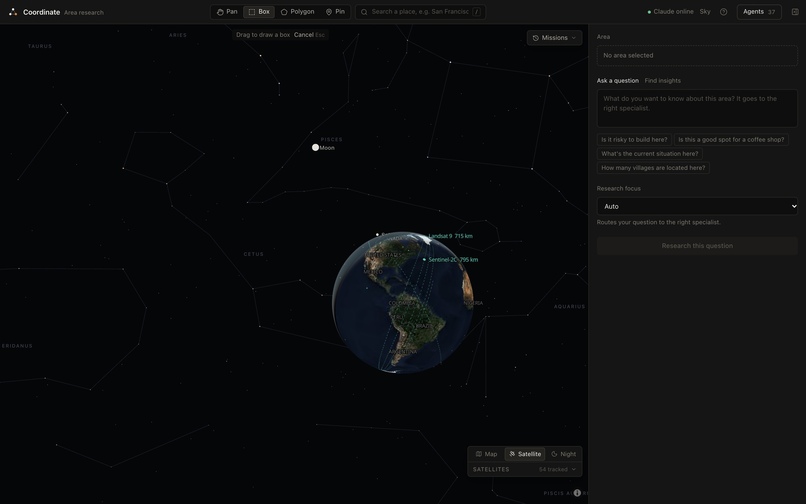
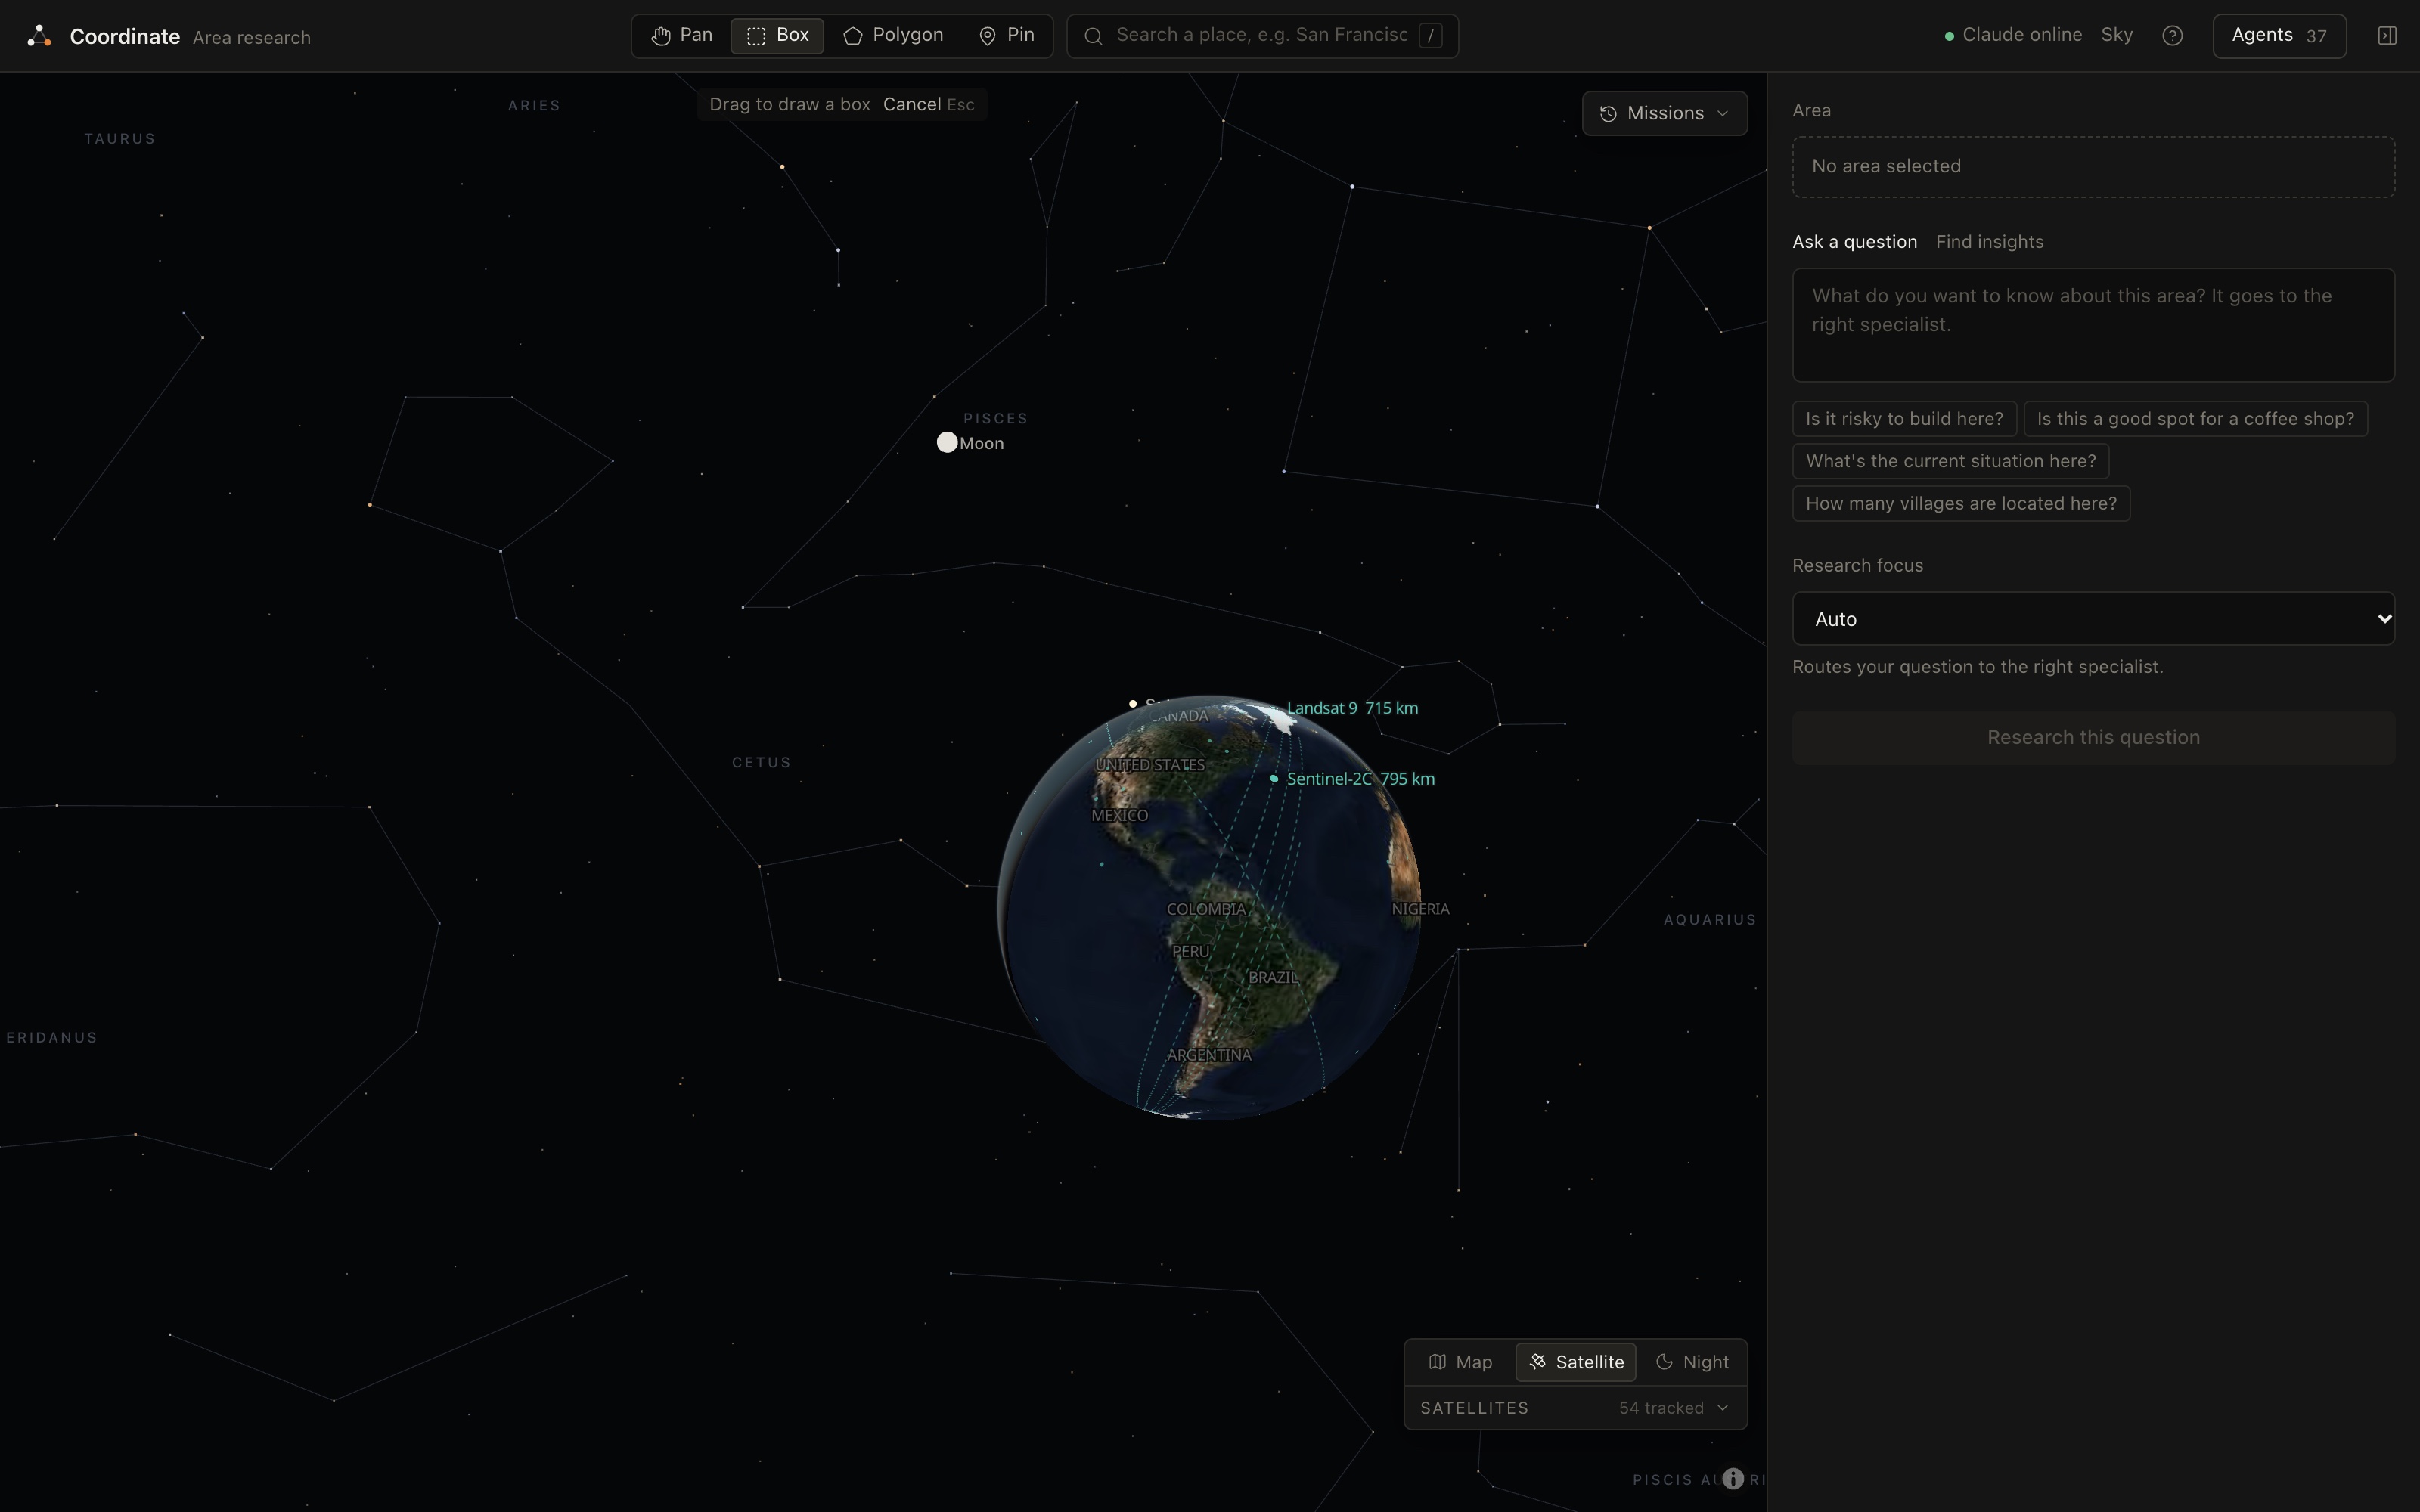
Zoom out: the globe with live satellites, the Moon and constellations
-
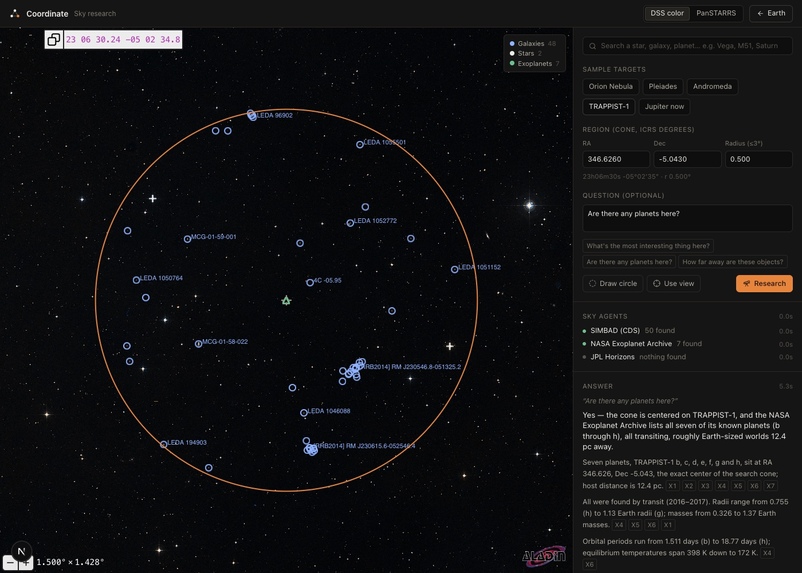
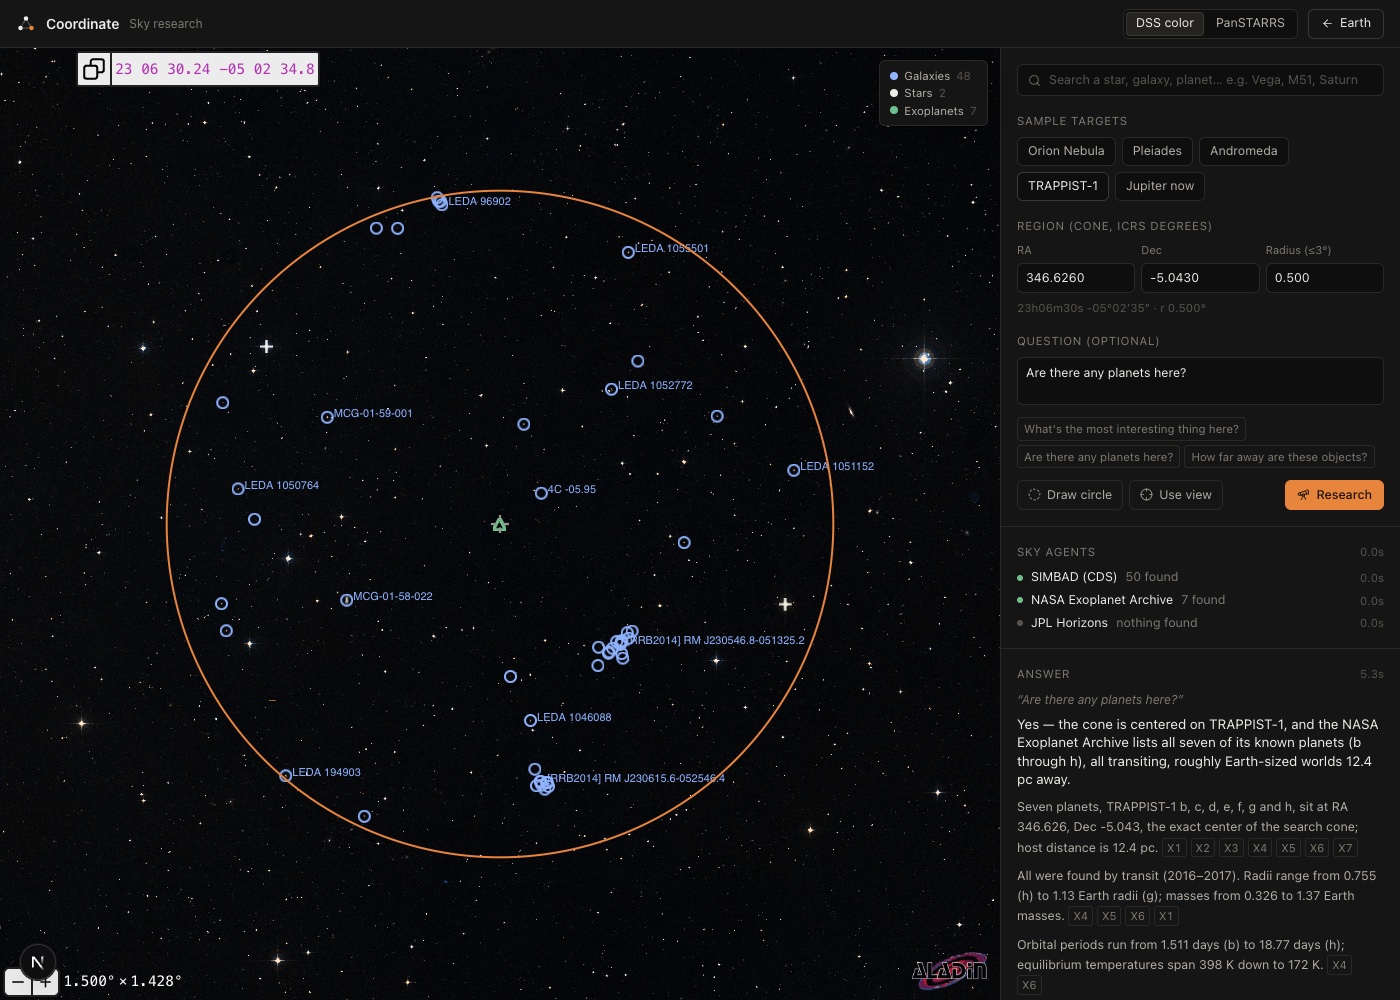
Sky mode: TRAPPIST-1's planets, with cited answers from NASA and SIMBAD data
-
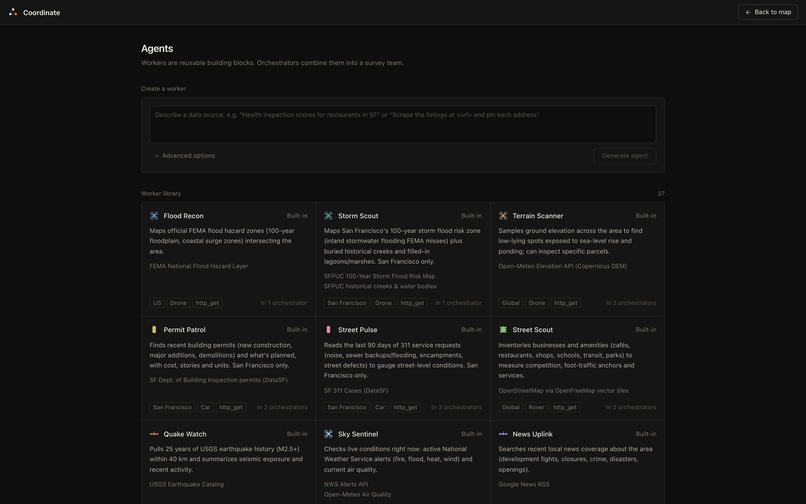
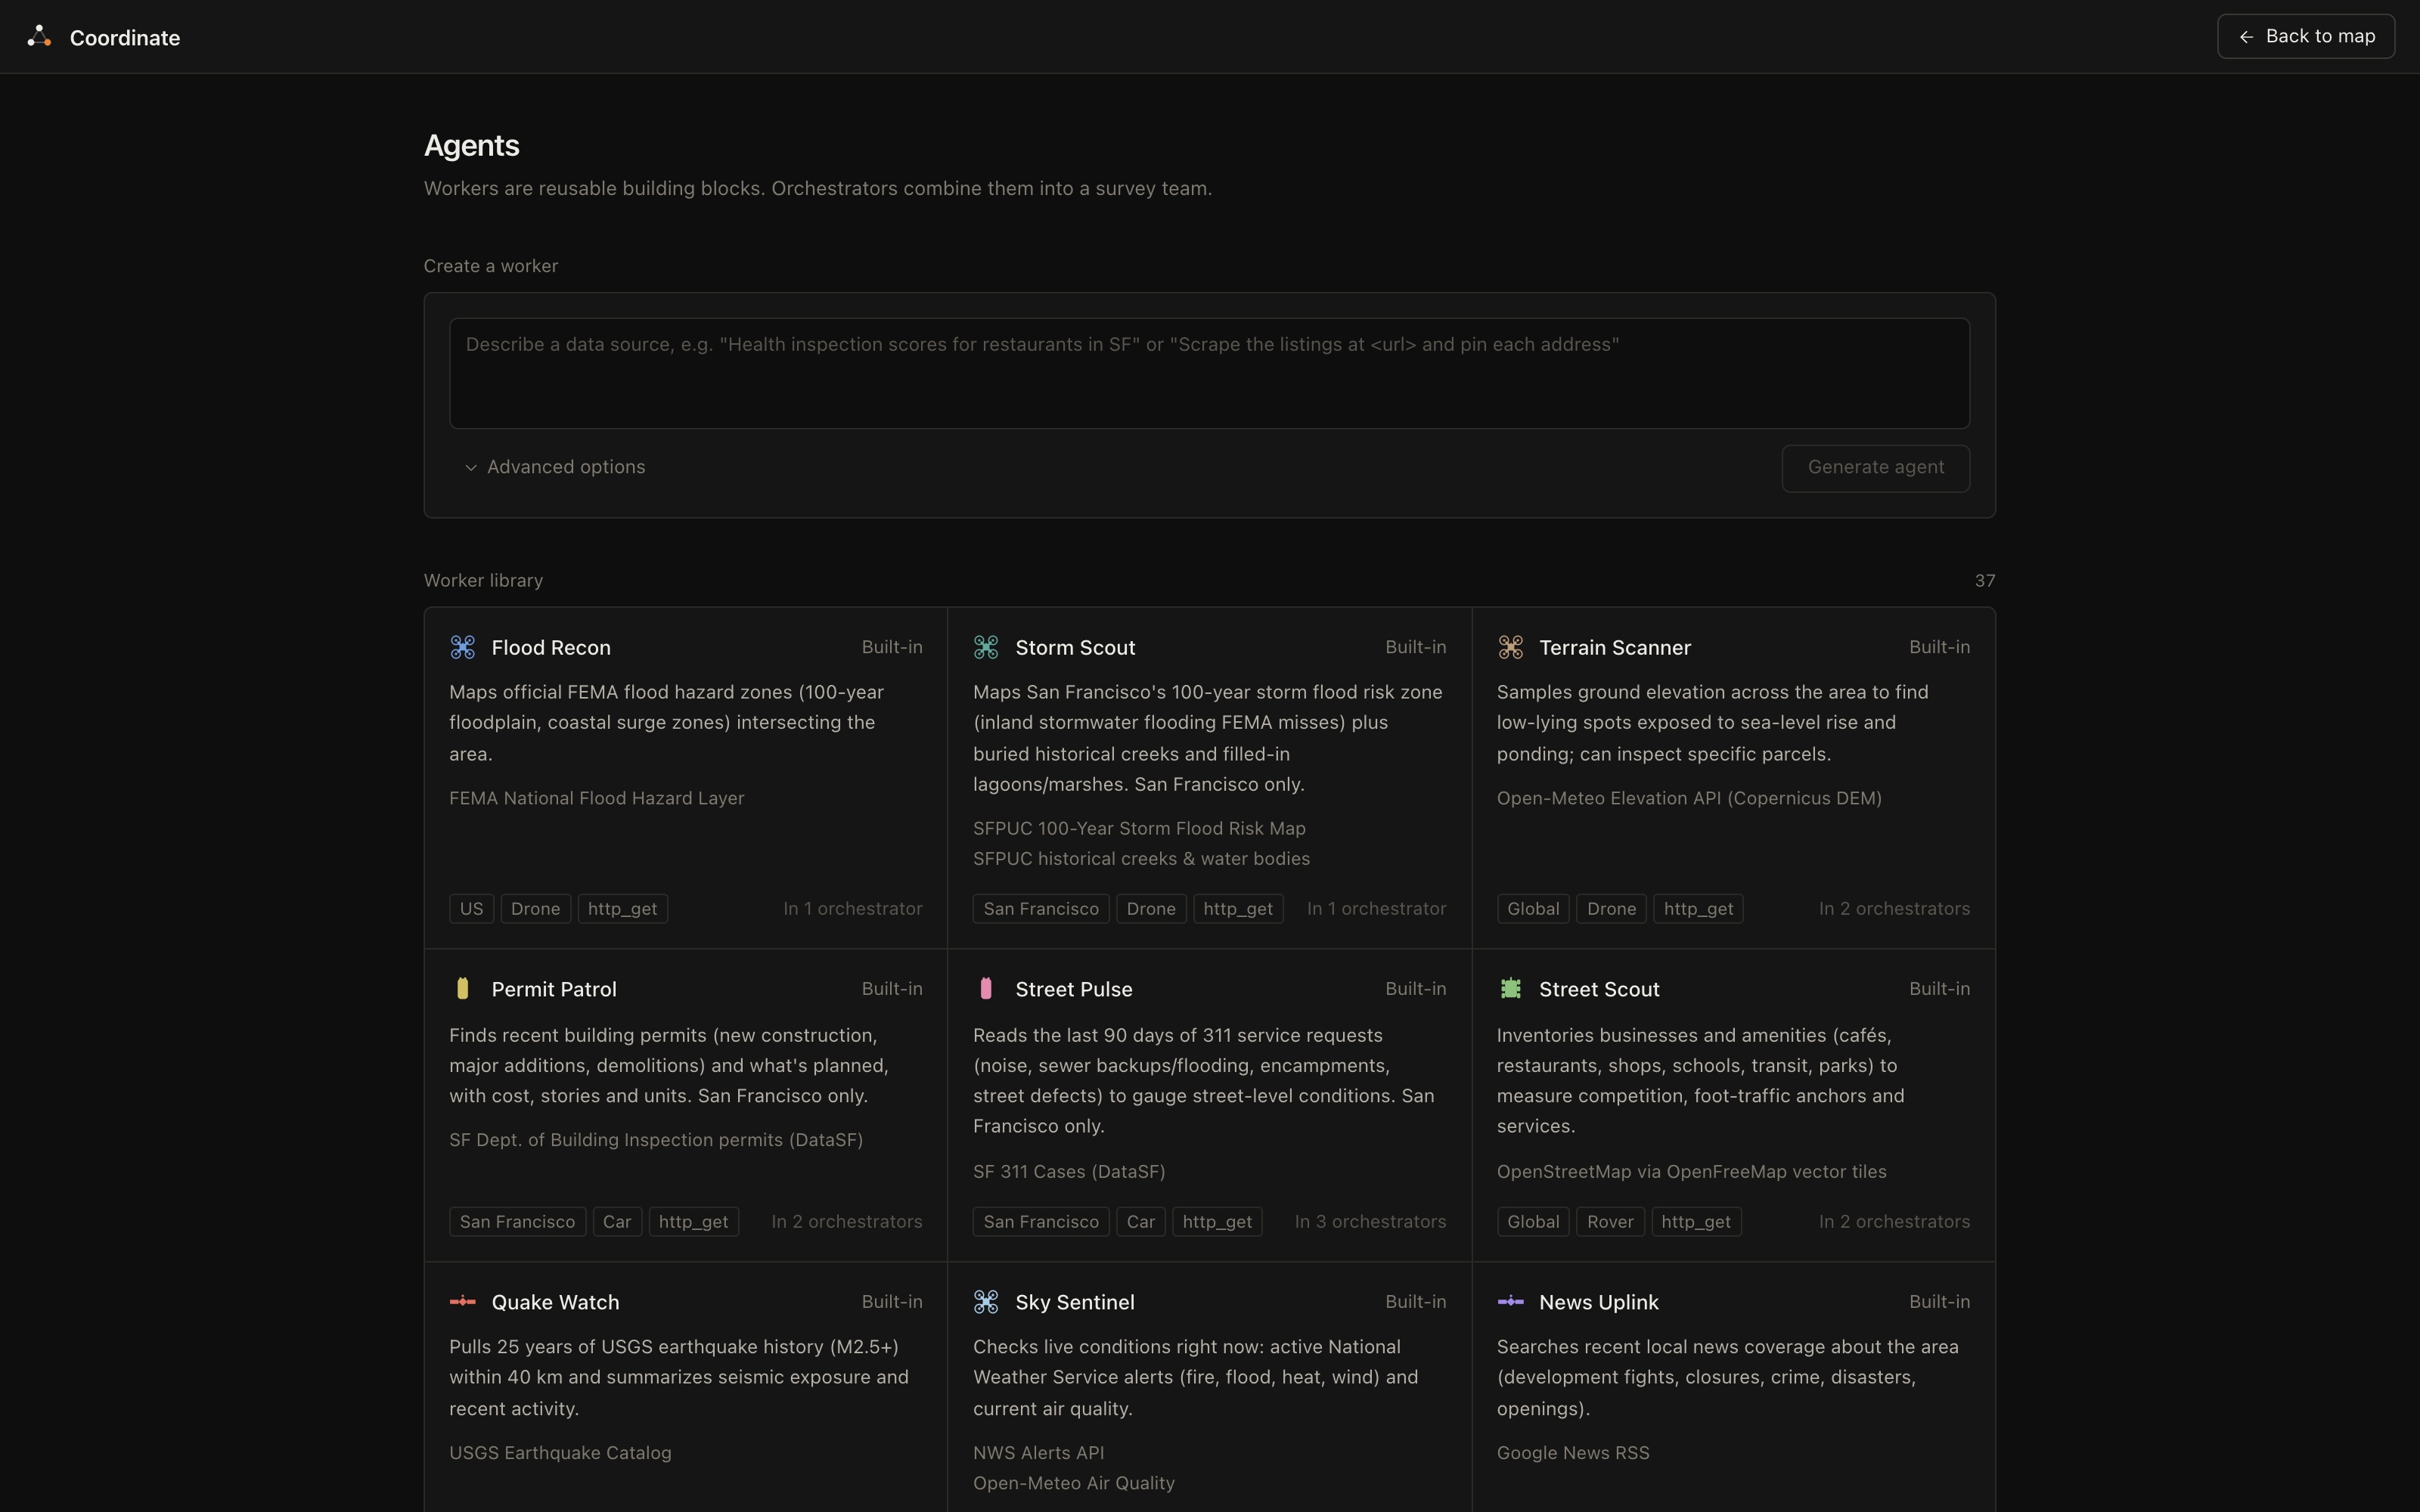
37 built-in agents, or describe a data source to make a new one
-
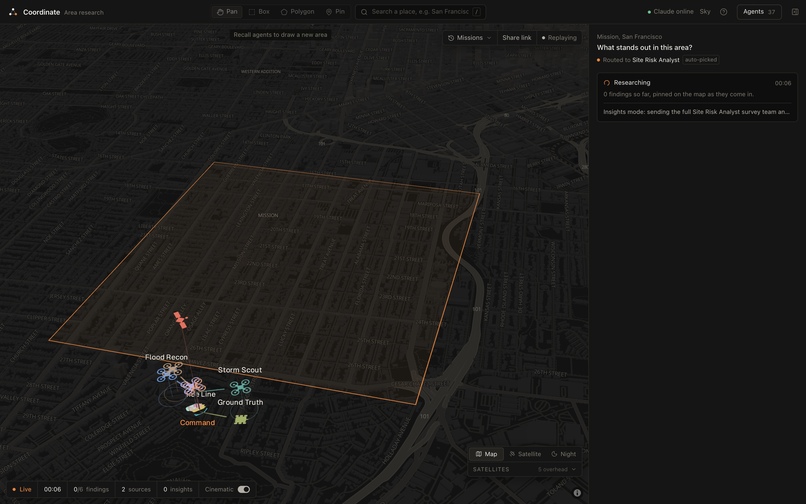
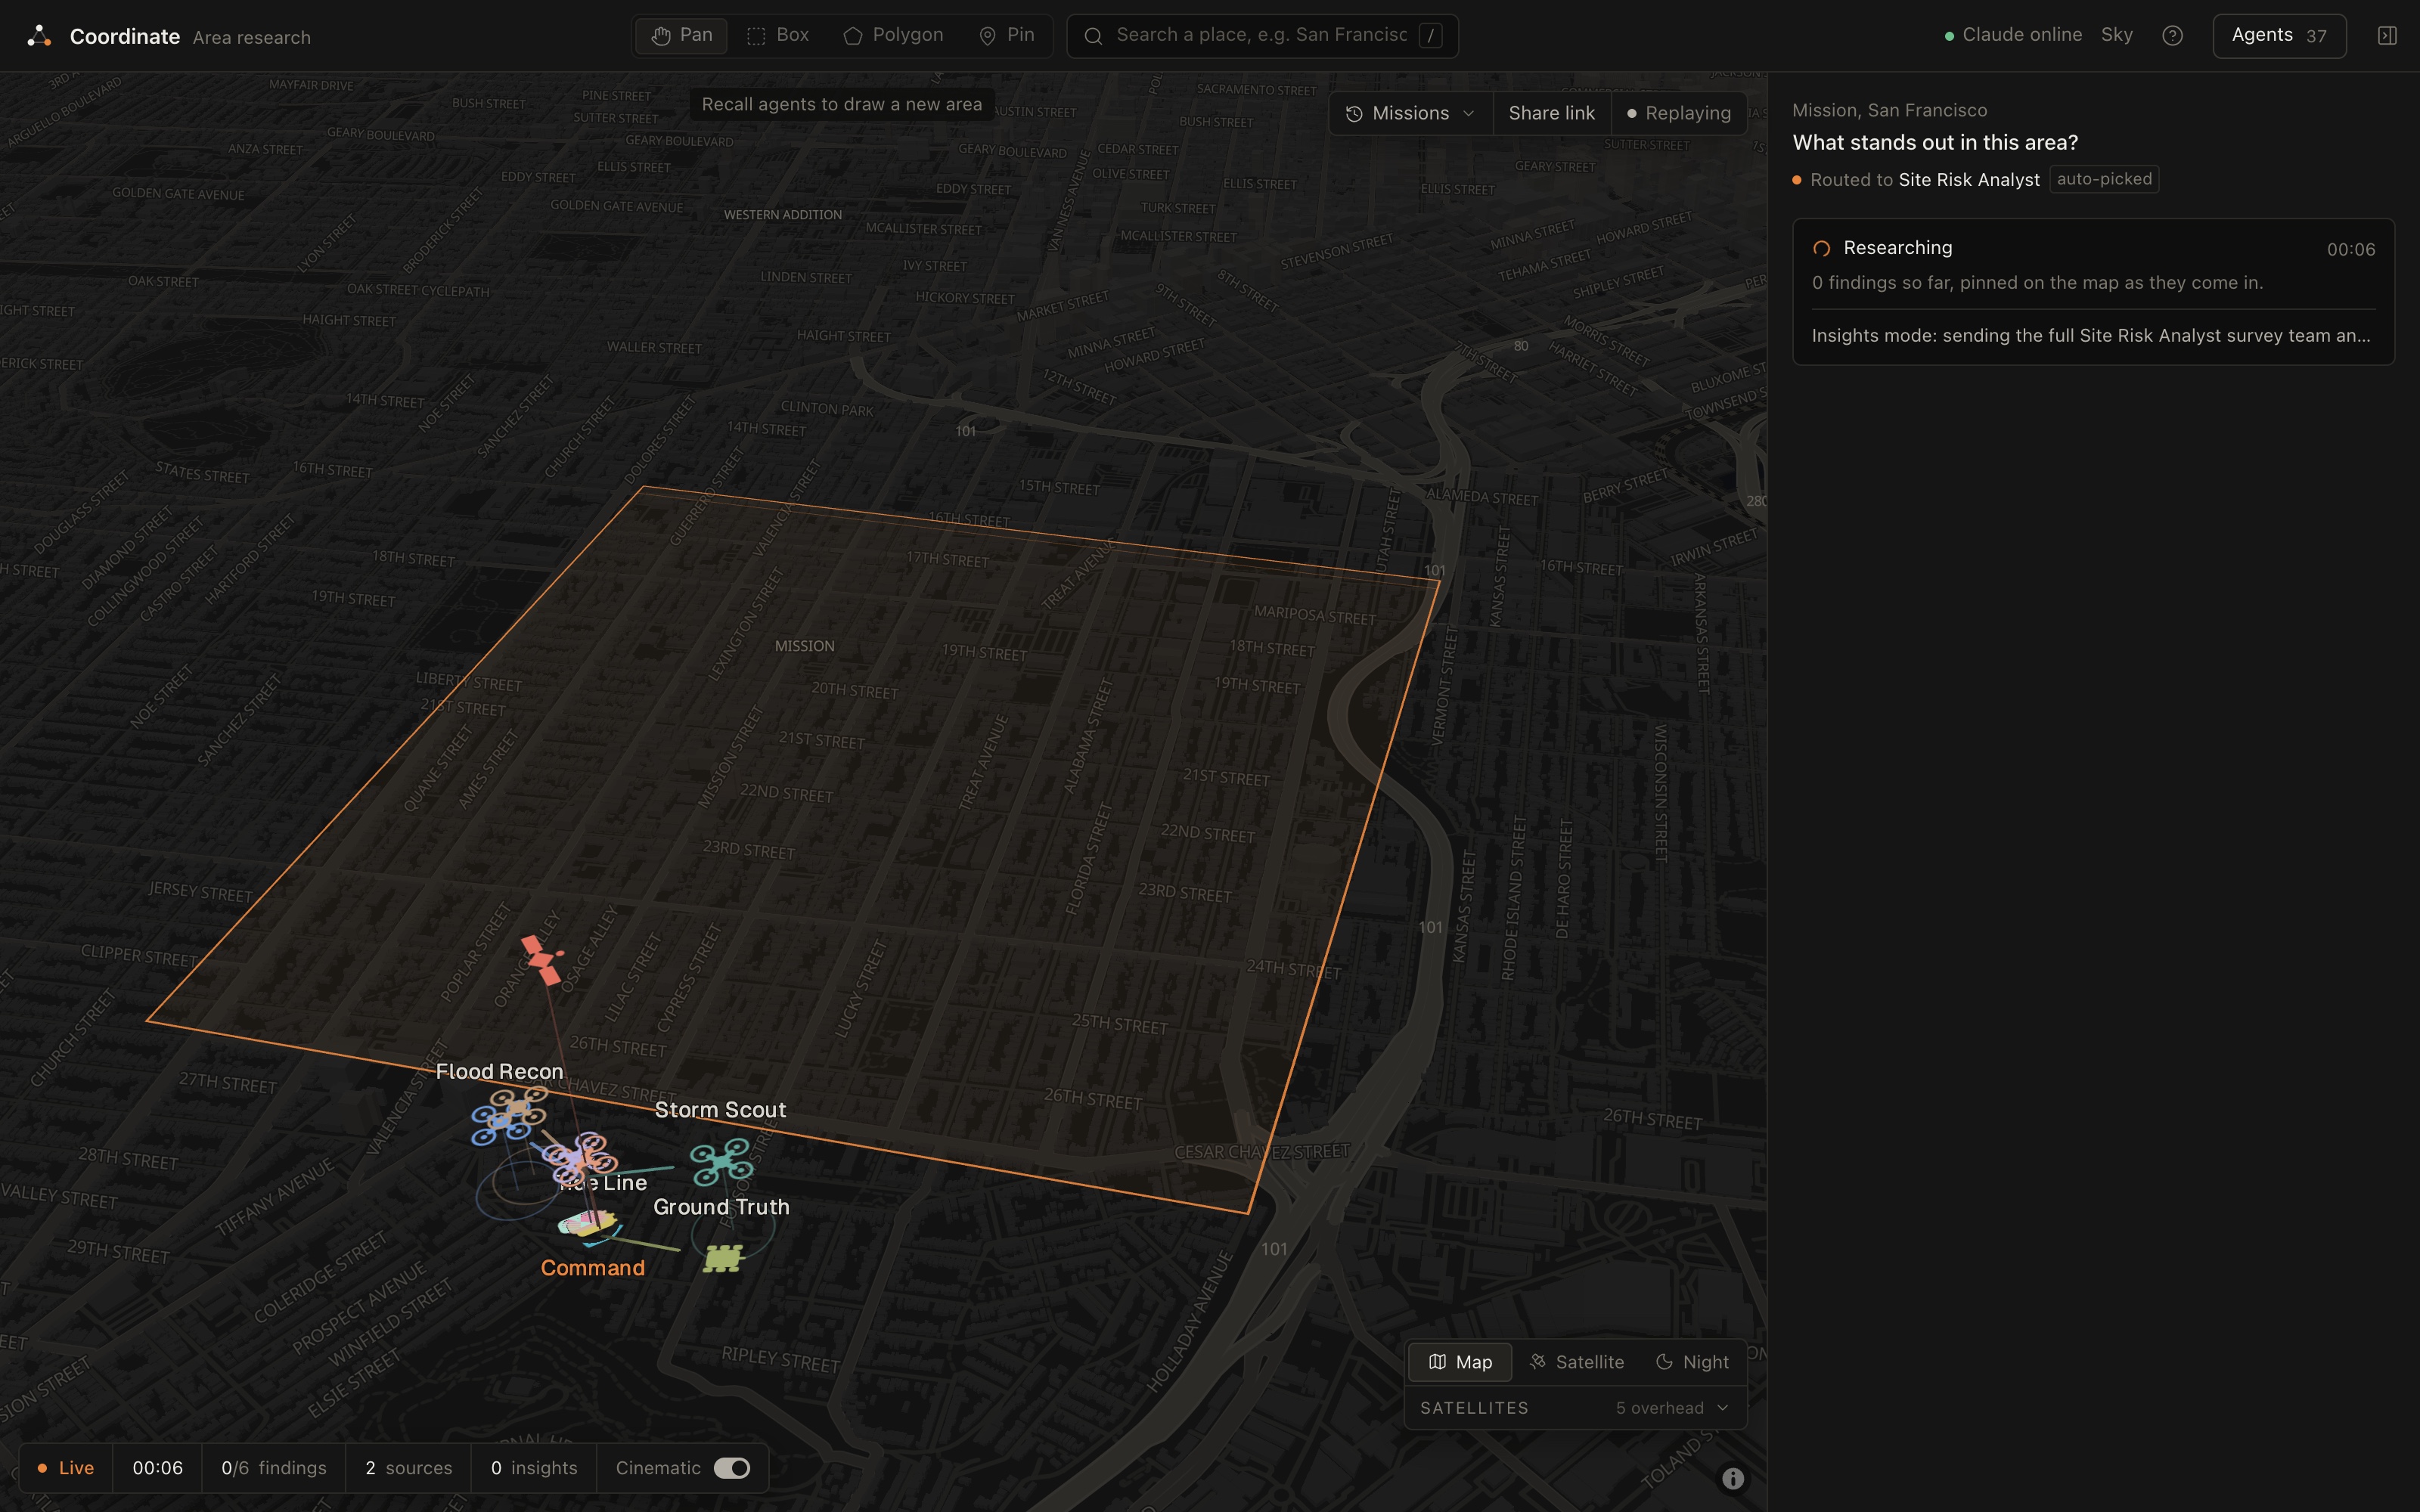
Agents heading out from Command at the start of a mission
-
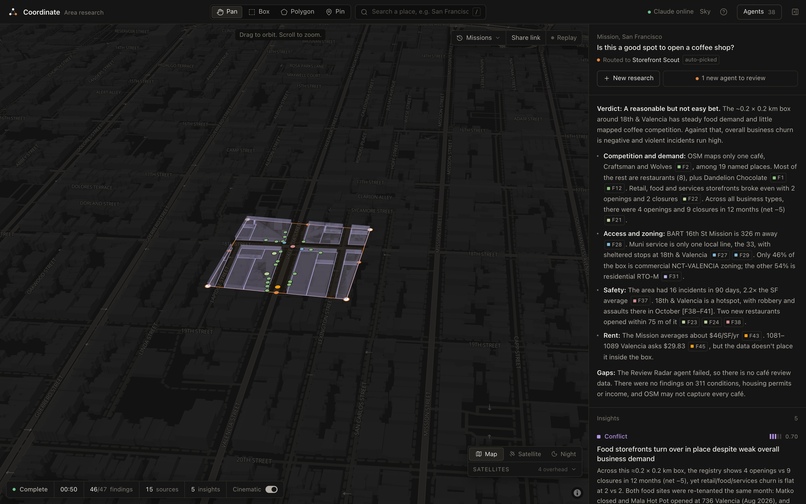
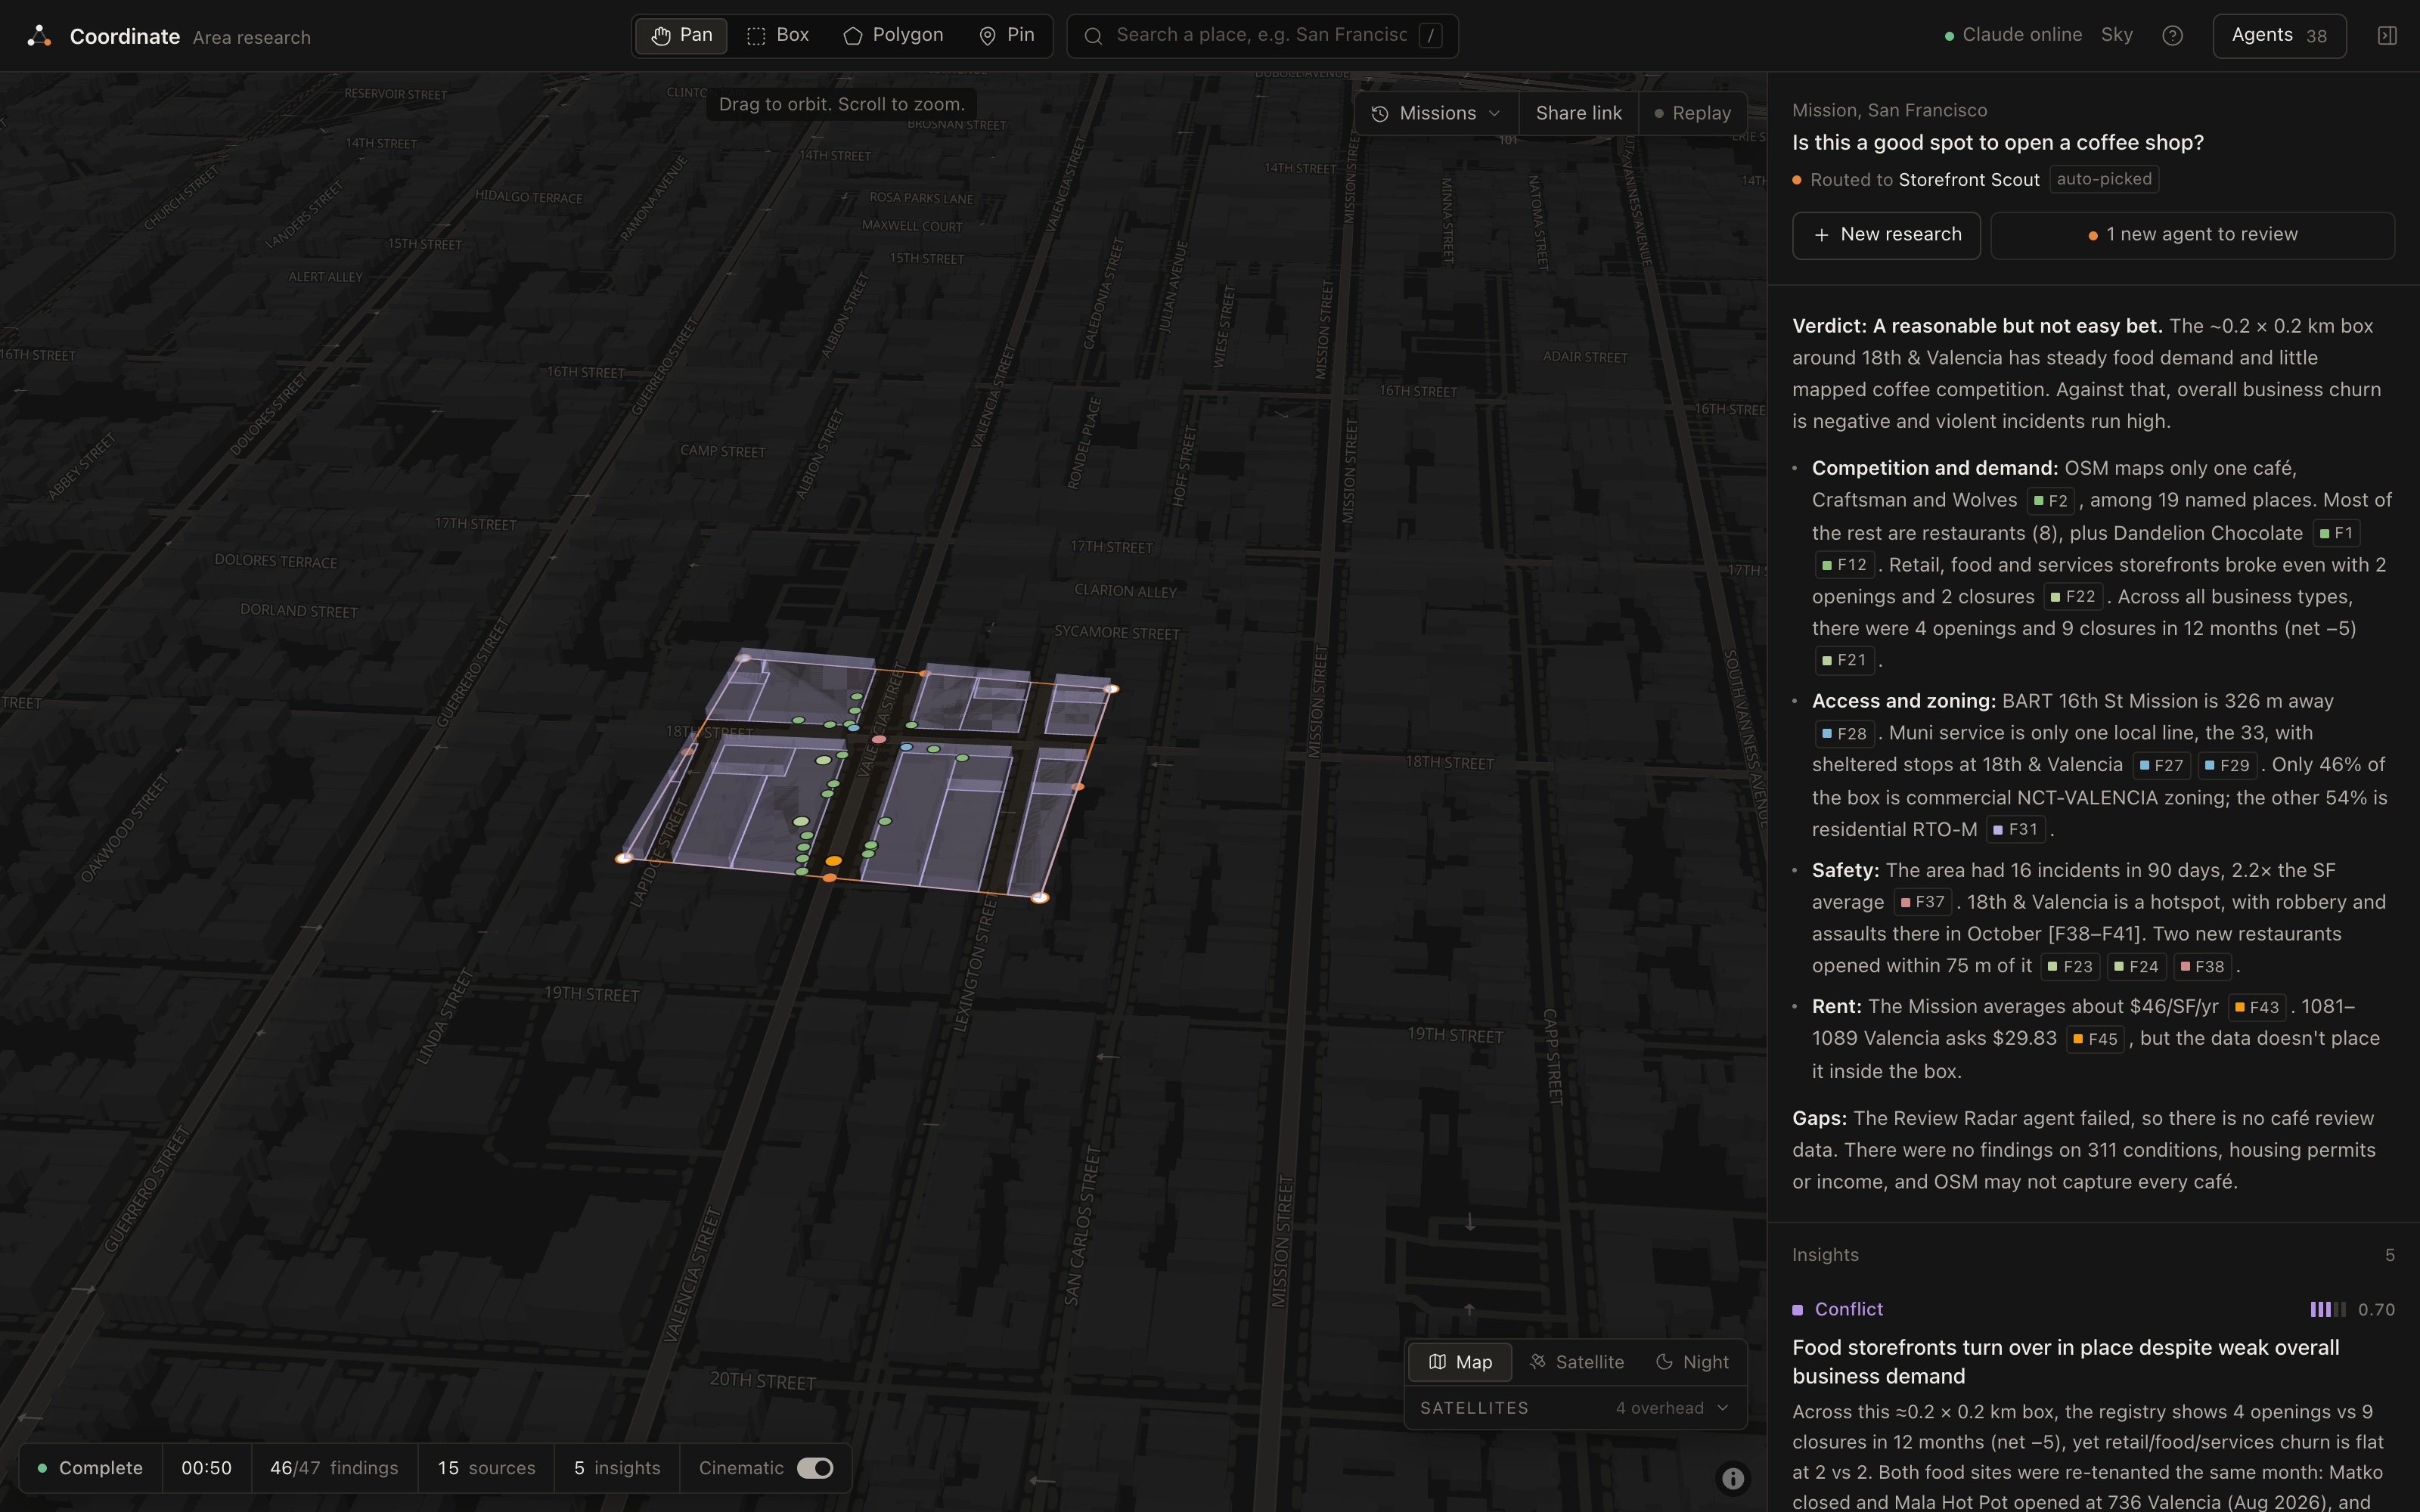
Ask about a coffee shop and get an answer that cites every claim
-
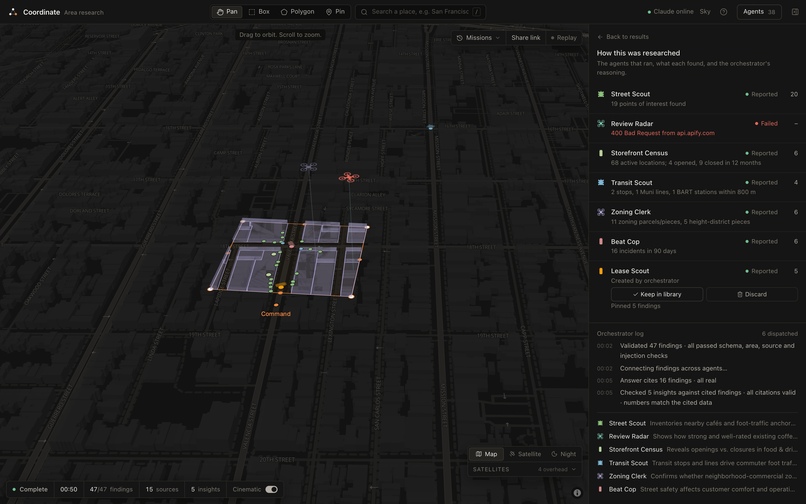
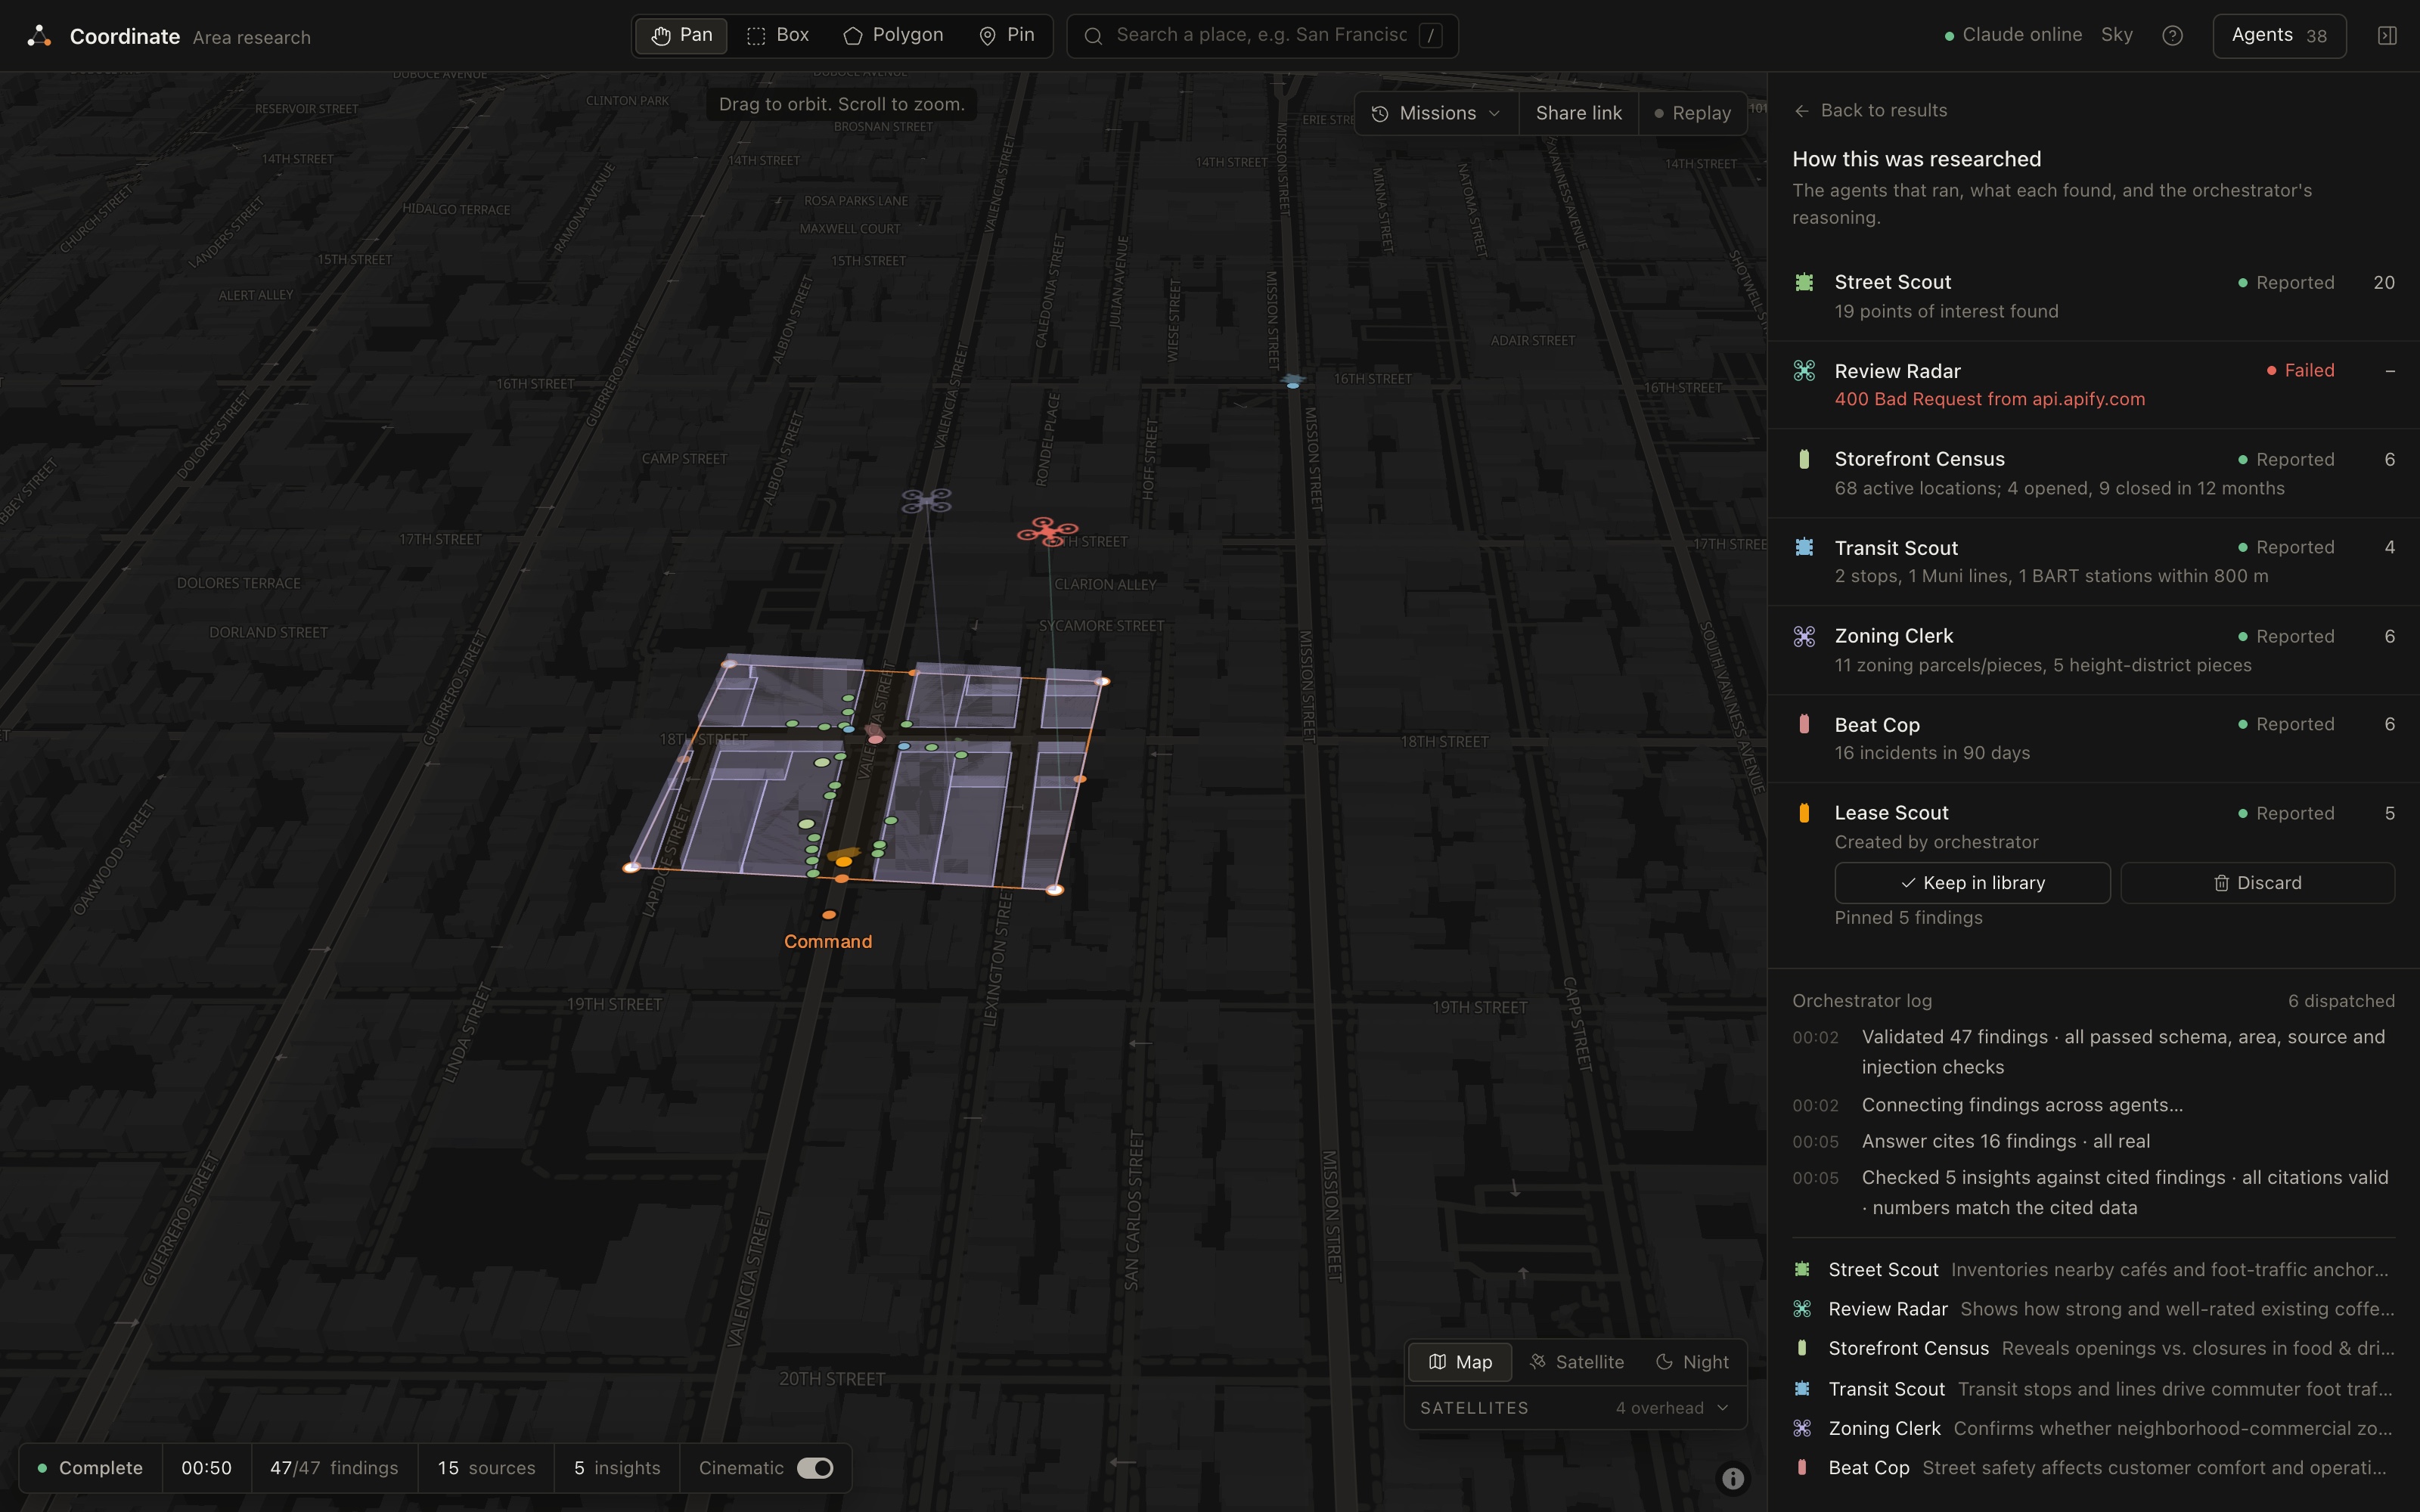
No agent covered retail rents, so the orchestrator made one mid-run
-
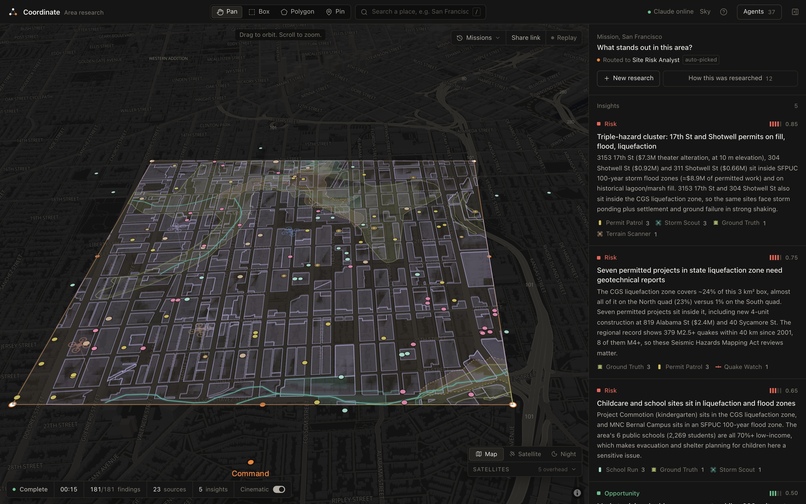
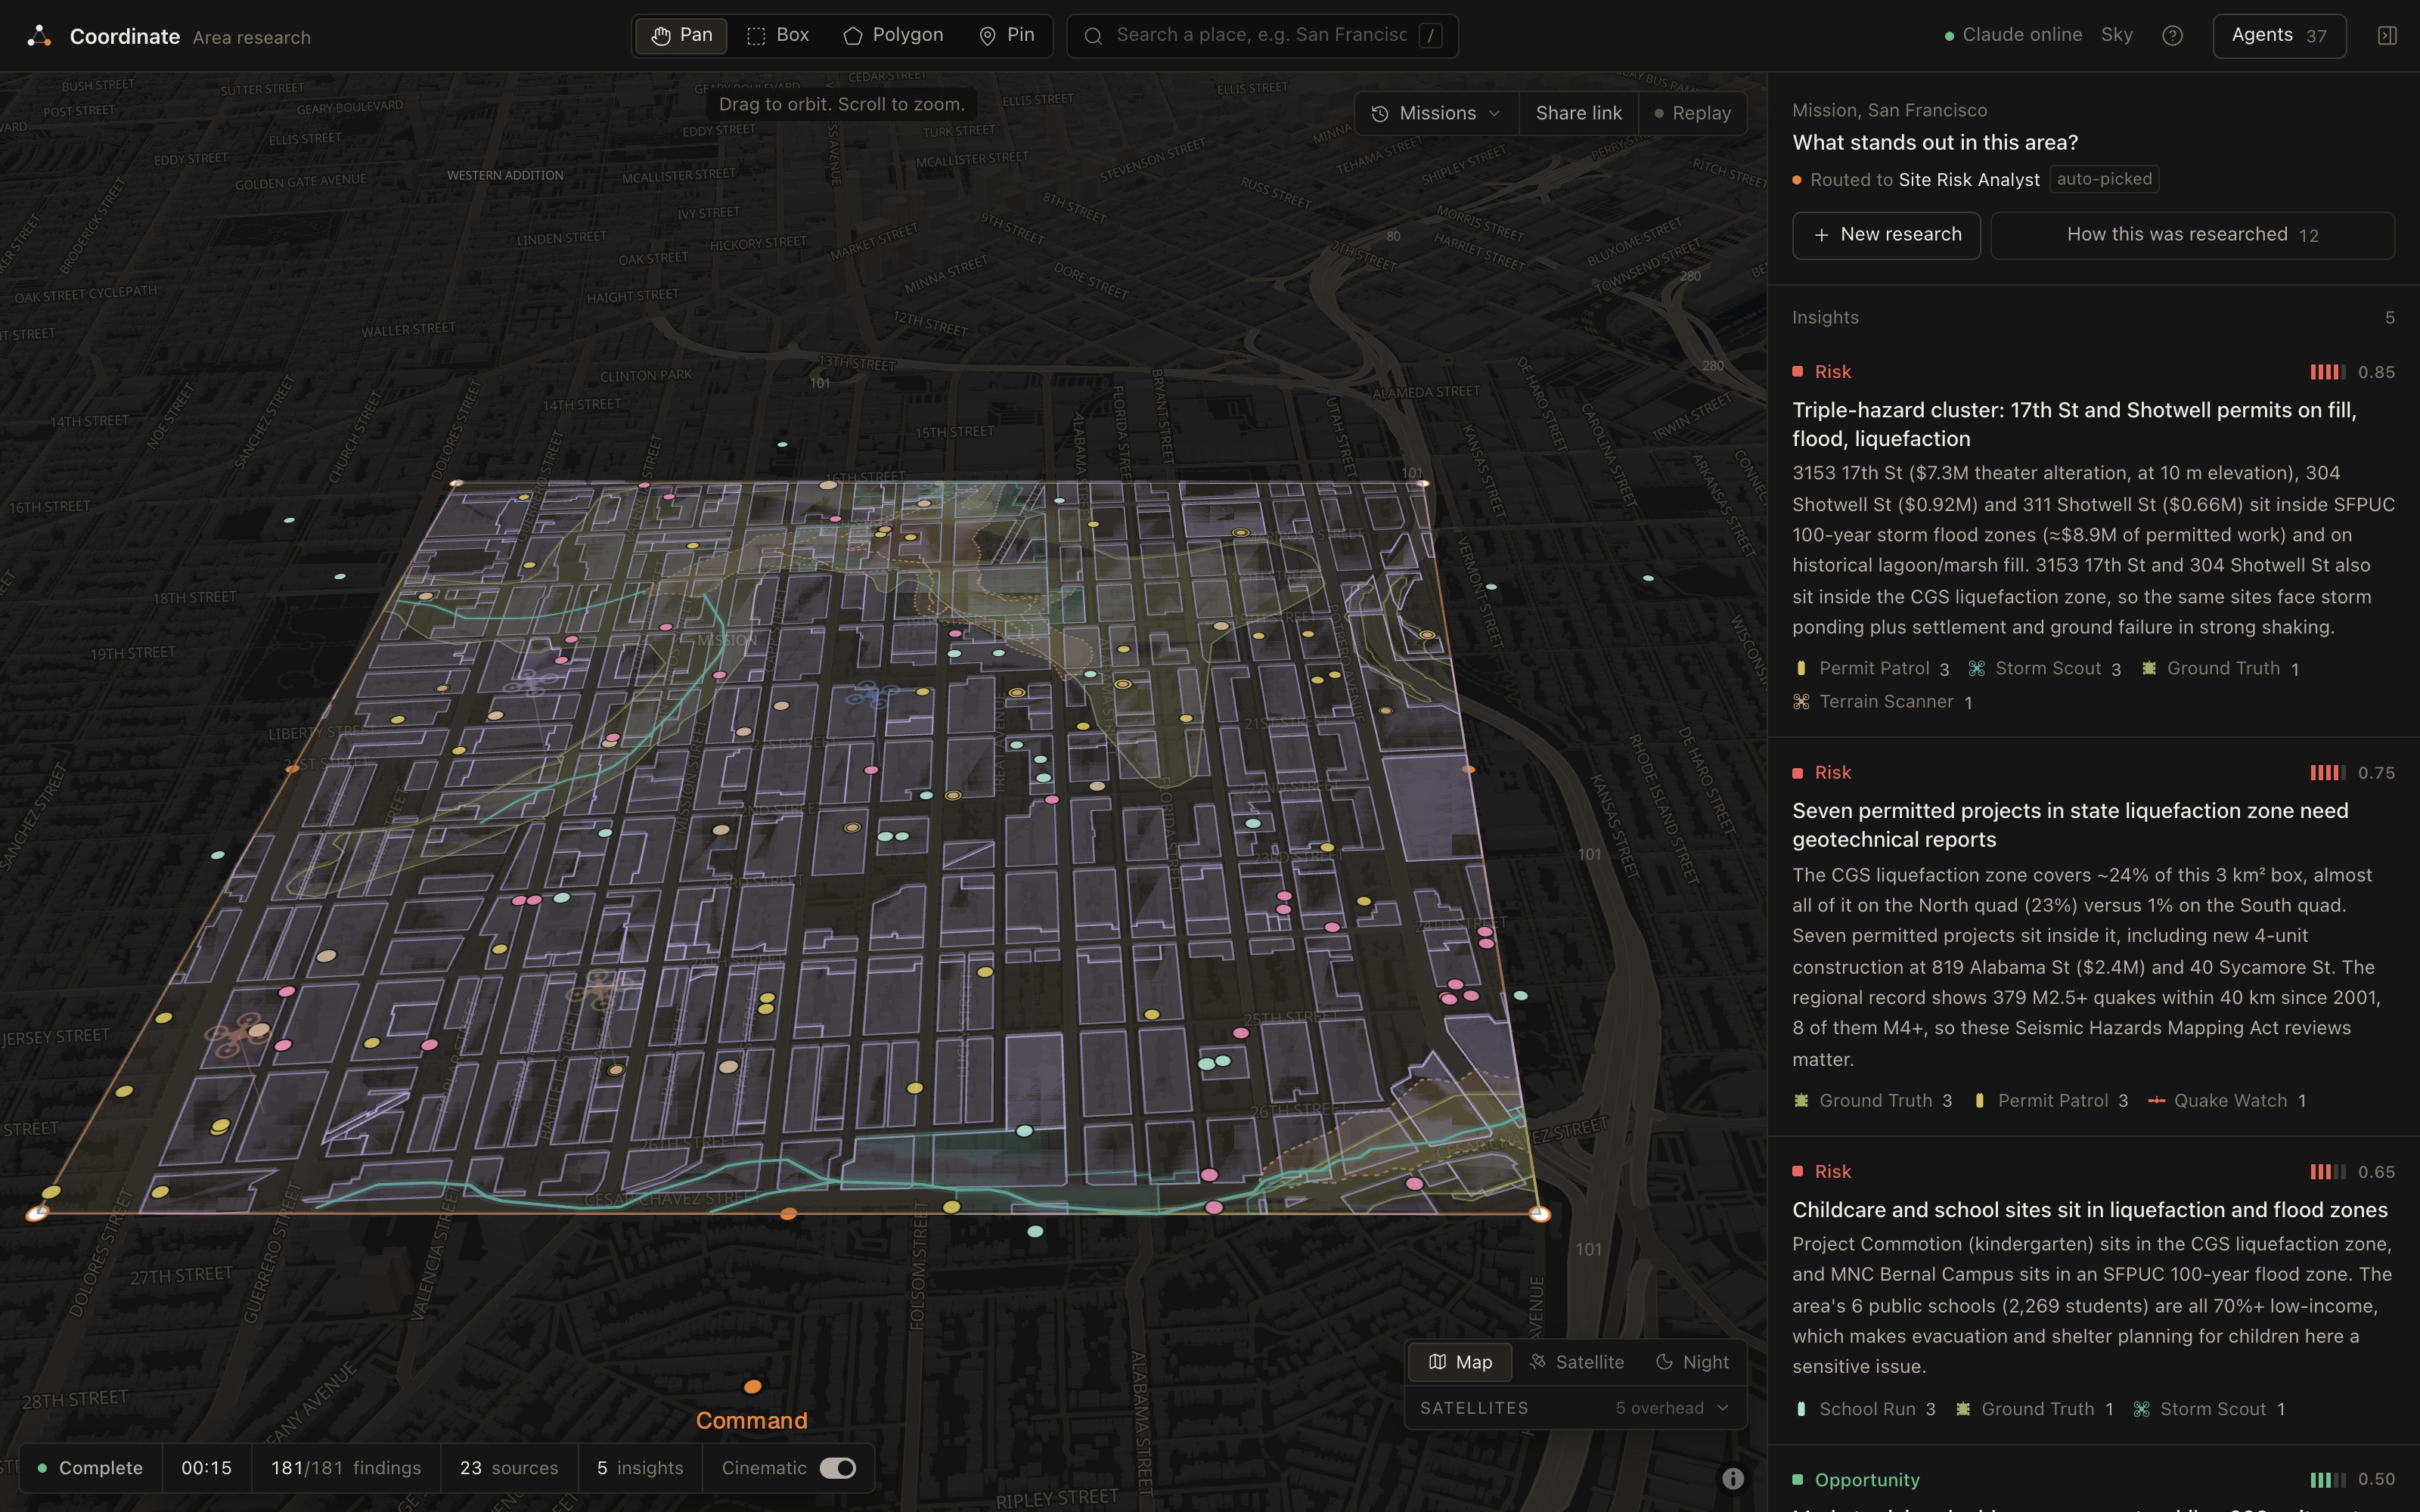
Mission District: 180 findings on one map, with three permits in flood, quake and fill zones
-
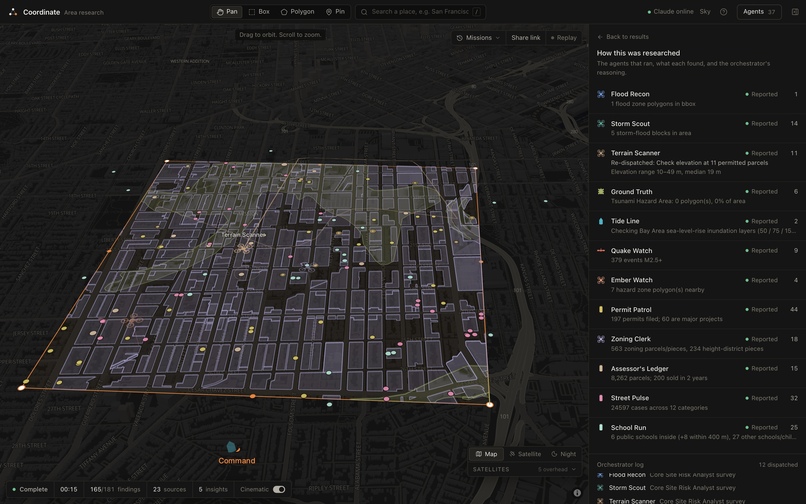
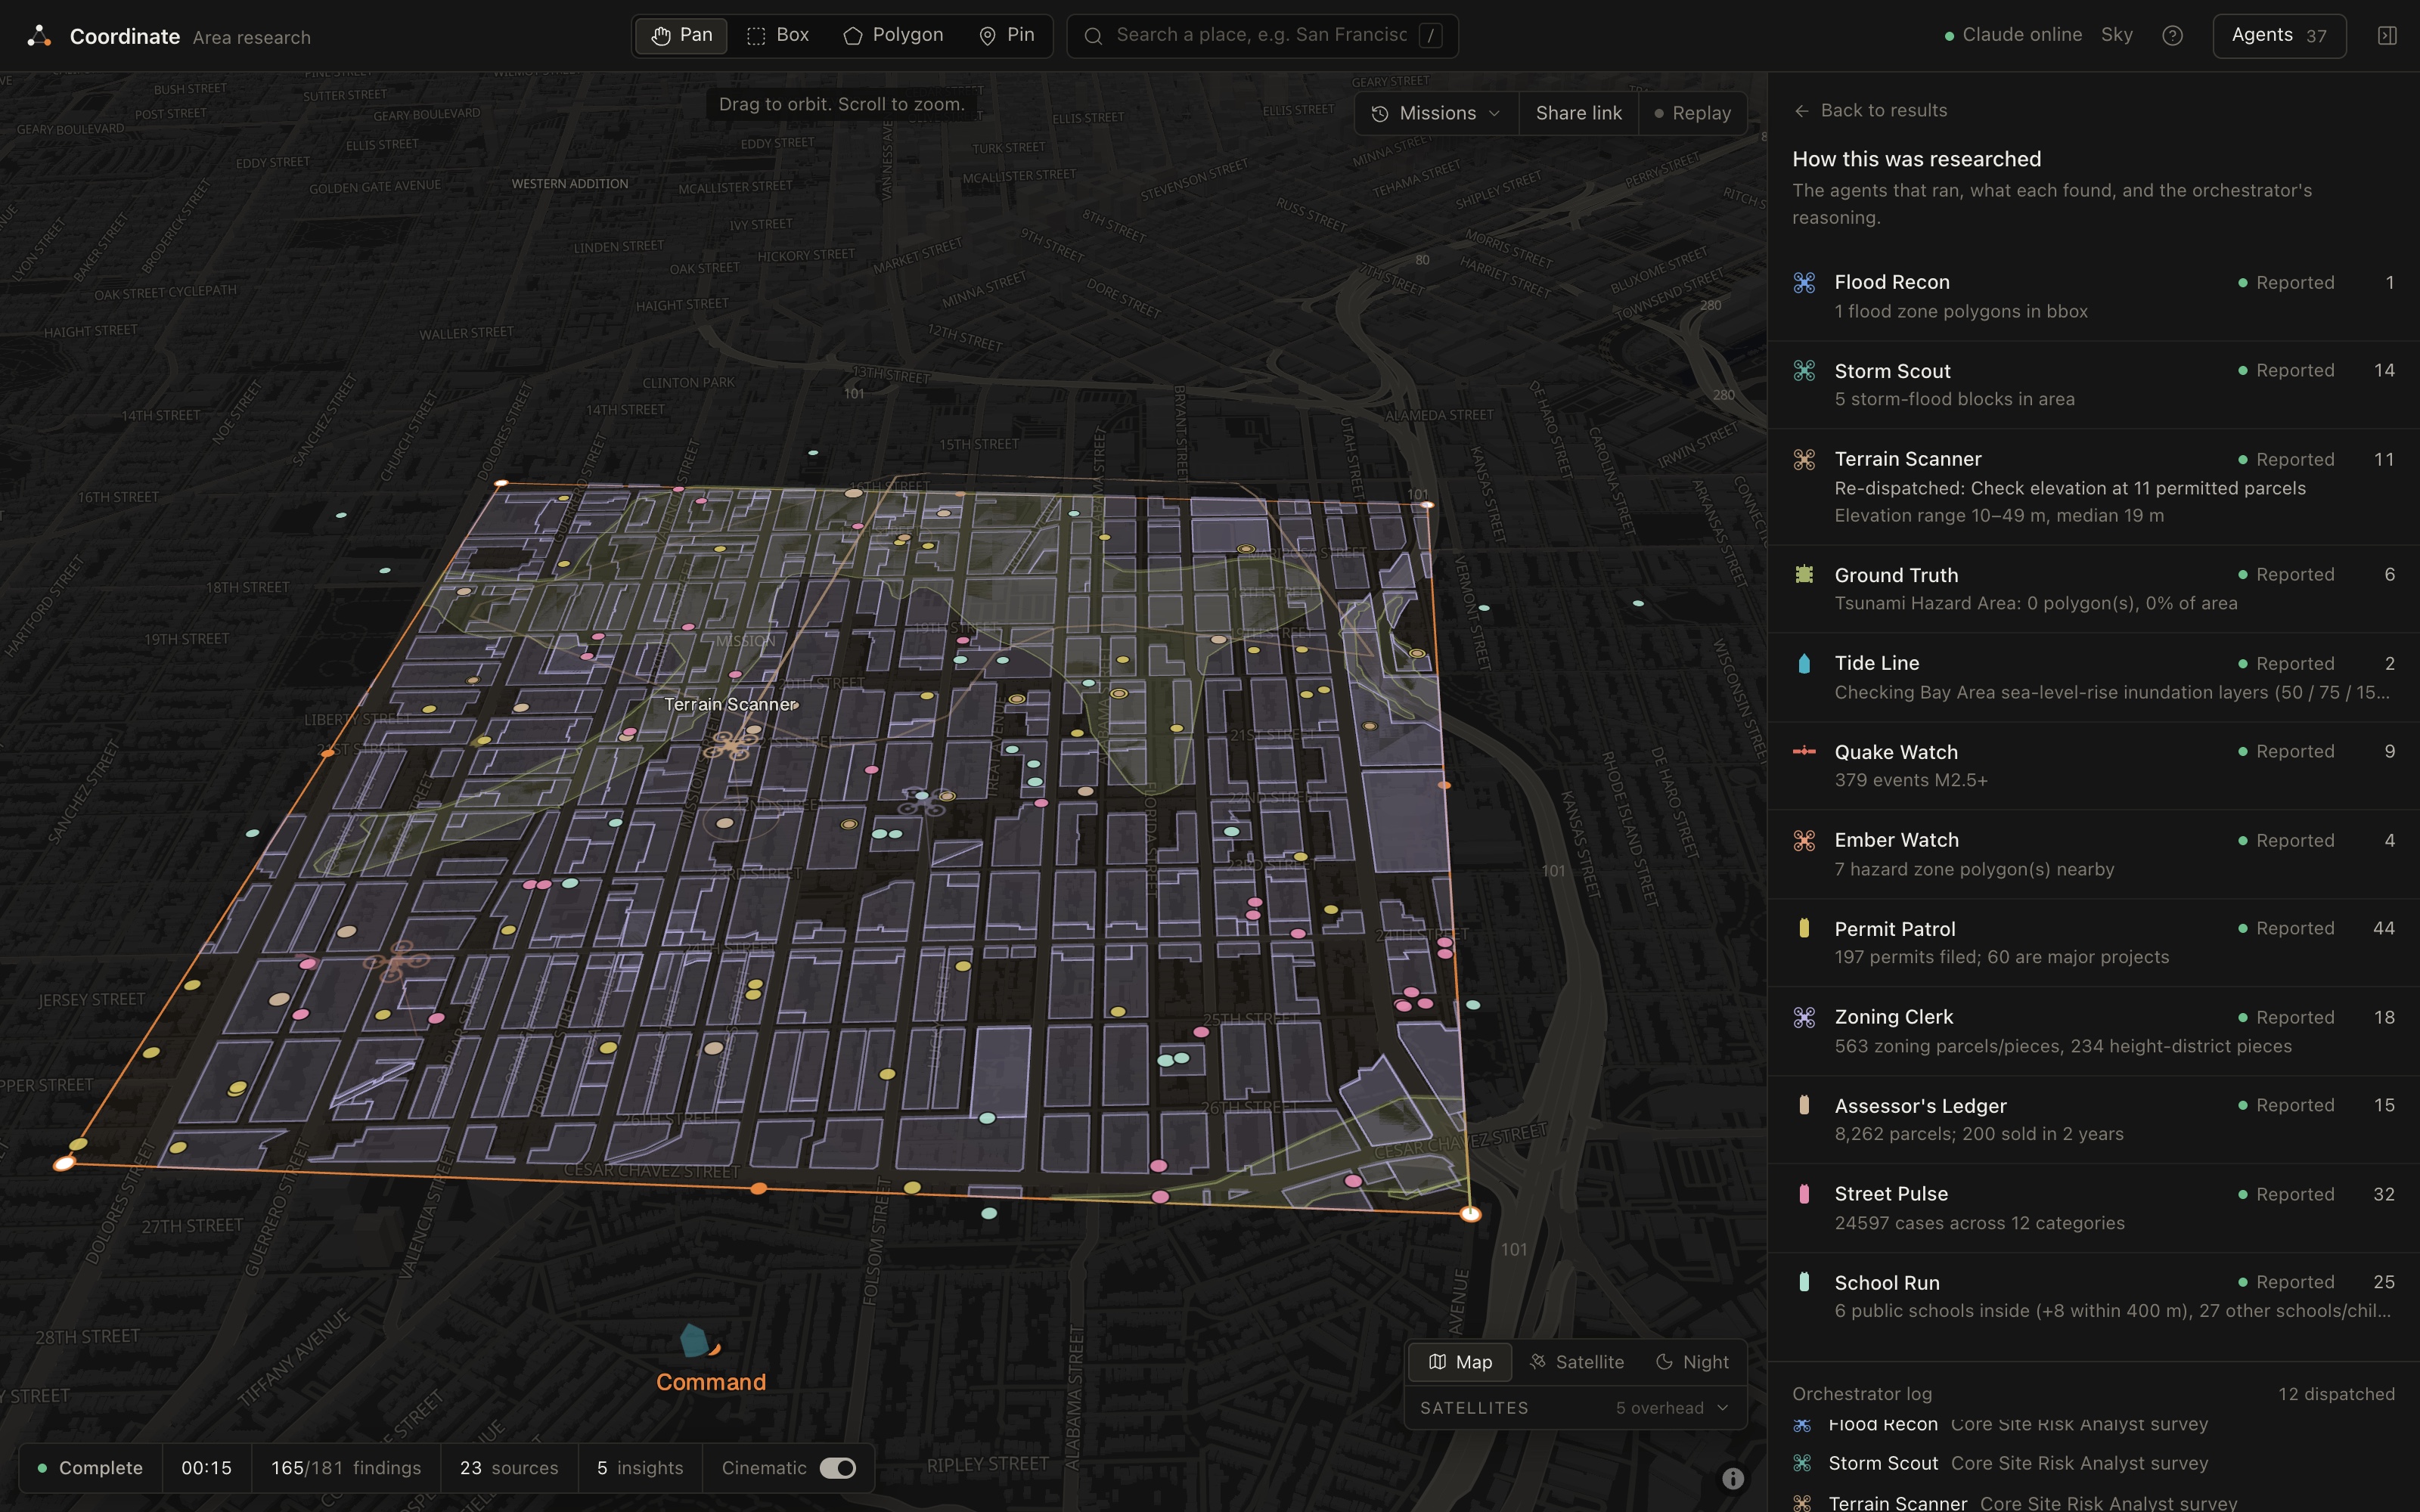
Every agent's findings, plus the drone sent back to check 11 parcels
Inspiration
A lot of the questions people ask about a place are simple to ask and difficult to answer. Is it risky to build here? What endangered species are in this forest? The answers are out there, but they're scattered across public datasets that are difficult to find and interpret.
We noticed this when we were poking around San Francisco's flood data for a class data science project. FEMA's flood map only covers the shoreline, so it says most of the Mission is basically fine. But the city has its own storm flood map that shows streets in the Mission flooding in a big storm, and the state has a separate map of liquefaction zones. Permits are on DataSF. Rents are on Craigslist. What people actually think of a block is on Reddit. The interesting stuff is almost always where two of those overlap, like a new building going up on old lagoon fill, and no single site will tell you that. And this is just one of the vast things our tool can answer.
So we built Coordinate to allow users who are interested in researching an area to simply select the area on a map, ask their question, and a number of agents go dig through all of it at once and present their findings to users in a concise and understandable manner.
What it does
You draw a box on the map (or drop a pin) and ask a question. Coordinate figures out what kind of question it is and hands it to the right specialist: a site risk analyst, a storefront scout, or a disaster response lead. You can also skip the question and just ask for insights about the area.
The orchestrator then picks which agents it needs out of a library of 37 and sends them out. You can watch them work on the map. They show up as drones, cars, rovers and satellites, and each one flies over to what it found before the pin drops, so you can see who found what. Every pin links back to the actual record it came from.
Once the agents report back, the orchestrator does the part we care about most. It looks for places where different sources overlap or disagree. When it finds permitted projects in a risky spot, it sends the terrain drone back out to check the elevation at those exact parcels. Then it writes up insights that cite the specific findings they're based on, and answers your question.
Some real results from the Mission District:
- 21 permitted projects sitting in a state liquefaction zone
- 6 permitted projects (about $3.1M of work) inside the city's 100-year storm flood zone
- FEMA rates the area as minimal flood hazard, while the city's own storm model floods about half a square kilometer of it
- For a storefront question on Valencia: 56 more businesses opened than closed in the last year, 30 nearby restaurants averaging 4.5 stars on Google Maps, and a median asking rent of about $4,500 across 78 live listings
If no agent covers what you asked about, it builds one on the spot. We asked whether a block was good for a café "factoring in health inspections." It didn't have an agent for that, so it created an Inspection Scout mid-run, which went and pinned real restaurant inspection scores. You can keep a new agent or toss it afterward.
Every mission is saved, so you can send someone a link and they'll watch the same run live on their phone.
How we built it
The frontend is Next.js with MapLibre for the map and deck.gl for everything moving on top of it: the vehicles, their trails and the arcs between related findings. It opens on a globe with real satellites (positions from CelesTrak) and flies down into the city.
The orchestrator runs in steps: plan, send agents out, send some back for a closer look, cross-reference, then write it up. Claude handles the parts that need judgment. One call picks the specialist and the agents at the same time. Then the insights and the answer are generated in parallel and streamed in. If Claude cites a finding that doesn't exist, we drop it.
We did the "what overlaps with what" part with plain geometry instead of asking the model. Point-in-polygon and distance checks between different agents' findings (permits vs. liquefaction zones, new storefronts vs. crime hotspots, schools vs. flood zones) give Claude a list of real connections to explain, instead of letting it guess.
All 36 agents return findings in the same format, so the map and the orchestrator don't care where a finding came from. That's also what lets Claude create new agents that plug right in.
SpacetimeDB holds the shared state for every mission: the event log, the findings, and the rate limits on Claude. Only our server can write to it, and every browser subscribes, which is how share links, live viewing on a second device, history and replays all work.
For scraping we used Bright Data and Apify. Bright Data pulls live rental listings and searches Google and Reddit for what locals are saying, and it also handles web fetching for agents that Claude creates. Apify pulls Google Maps reviews for nearby competitors. We also built our own Apify Actor during the hackathon that scrapes SF Planning's hearing notices and maps them.
The rest is a lot of public data: FEMA, the city's flood map, California's geological hazard maps, NOAA sea level and tides, CAL FIRE, USGS, DataSF (permits, 311, crime, evictions, businesses, crashes, zoning, property values and more), Sentinel-2 and Landsat imagery, NASA's natural events feed, Census, Inside Airbnb and Wikipedia. It's deployed on Vercel.
Challenges we ran into
Our first flood agent found nothing in the Mission, because FEMA just doesn't map most of inland SF. That's what pushed us to add the city's storm flood map and the state liquefaction zones, which ended up being where the most interesting findings came from.
Our first version of the orchestrator just summarized. We handed the model 150 findings and asked for insights, and got stuff that sounded smart but wasn't really grounded in anything. Doing the overlap checks with real geometry first and having Claude explain those made a huge difference.
Every data source breaks in its own way. Some are slow, some go down, some return weird formats. We gave every agent its own timeout so one bad source can't hold up the rest, and added caching so a flaky government API doesn't ruin a demo.
Live data is messy too. Craigslist has a lot of fake listings priced way too low, so we filter out anything under 40% of the local median. Google searches with a date filter took around 35 seconds through the proxy, which was too slow, so we dropped the filter.
Accomplishments that we're proud of
Everything you see is real data pulled live. Nothing is mocked or hardcoded.
It finds things no single map shows, like the projects on liquefiable ground in the Mission, or FEMA and the city disagreeing about flood risk on the same blocks.
You can ask a plain question and it figures out who should answer it and which agents to send.
It builds a new agent mid-mission when nothing in its library fits.
We built and published our own Apify Actor during the hackathon.
You can hand a judge your phone with a share link and they'll watch the same mission running live.
What we learned
The useful information is in the overlap between datasets, not in any one of them.
Splitting the work helped a lot: plain geometry figures out what overlaps, and the language model explains what that means for the person asking. That worked much better than asking the model to do both.
Official maps lag behind reality, and showing where they disagree is useful on its own.
Using a real-time database as the event log meant sharing, history and replays mostly came for free.
What's next for Coordinate
About half the agents already work anywhere in the US or the world, and most big US cities publish permits and 311 data the same way San Francisco does. So expanding past SF is mostly adding a few city-specific agents.
We'd also like to add exportable reports for a specific address that a buyer, lender or community group could actually use, with every claim linked to its source. And a watch mode, where you save an area and get a ping when a new permit, hearing or flood report shows up there.
Built With
- anthropic
- apify
- bright-data
- census
- claude
- datasf
- deck.gl
- esri
- fema
- github
- maplibre
- nasa
- next.js
- noaa
- openstreetmap
- react
- socrata
- spacetimedb
- tailwindcss
- turf.js
- typescript
- usgs
- vercel
- zod

Log in or sign up for Devpost to join the conversation.