-
-

landing page
-
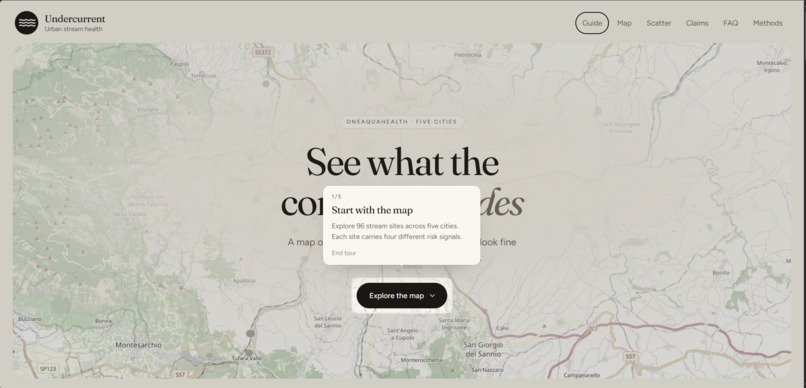
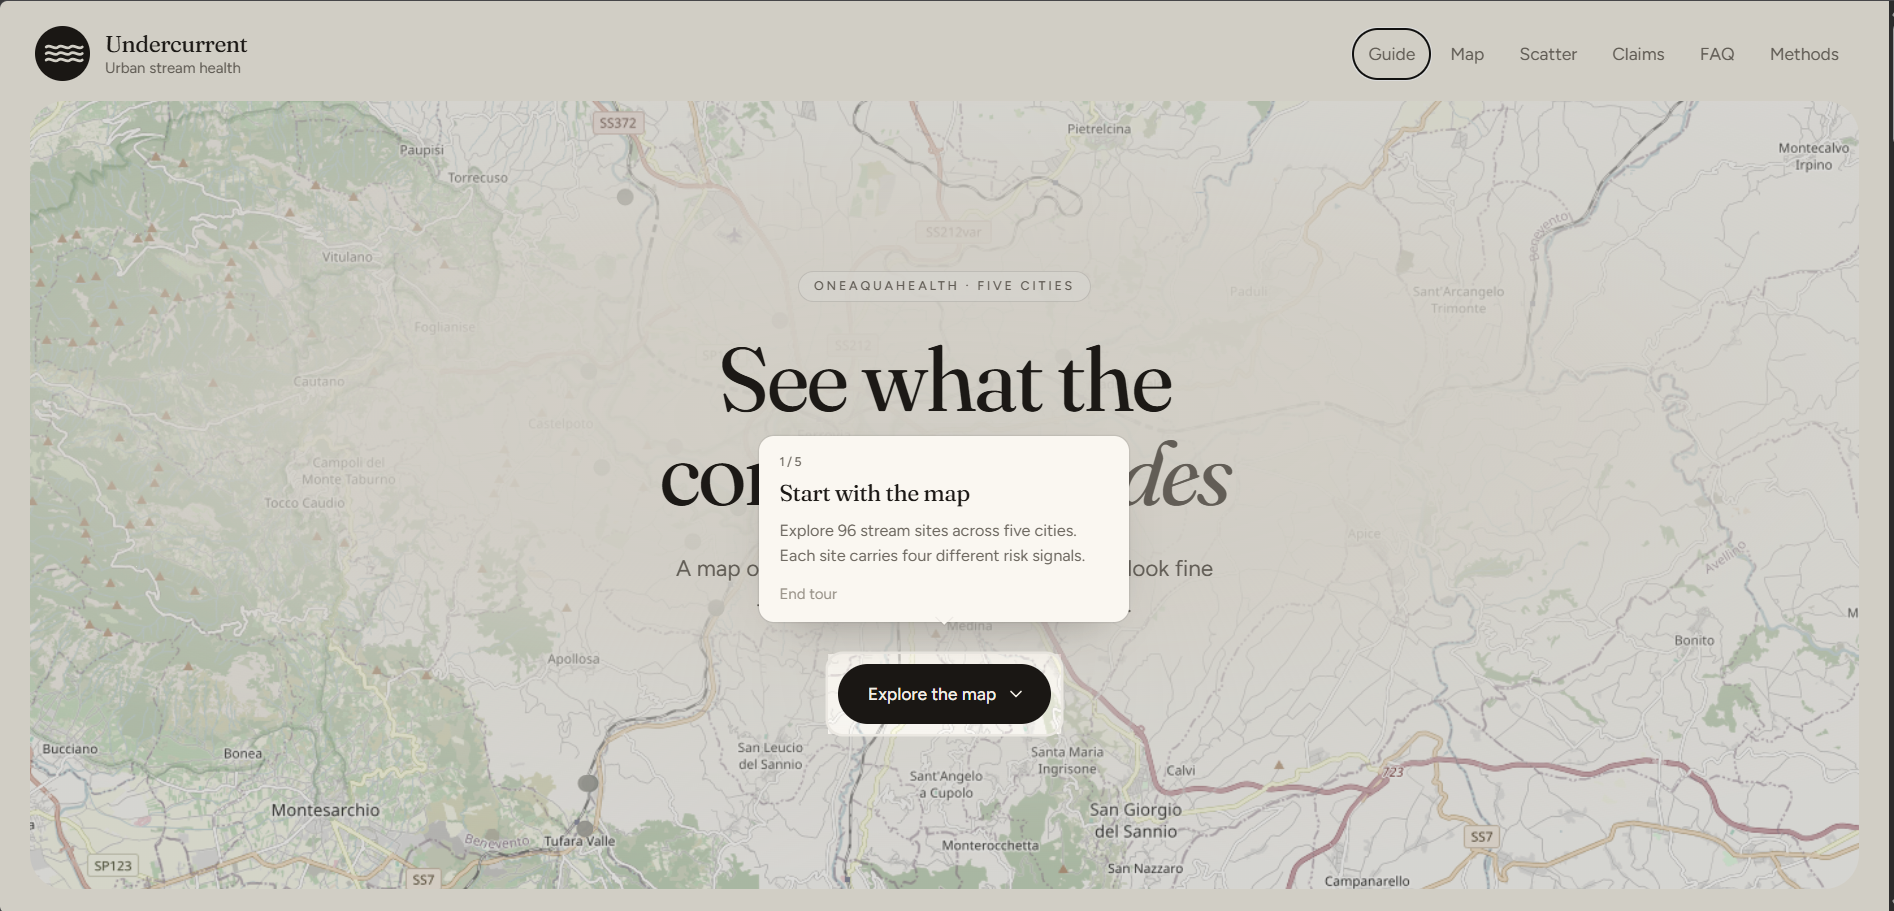
guided tour of functionalities
-
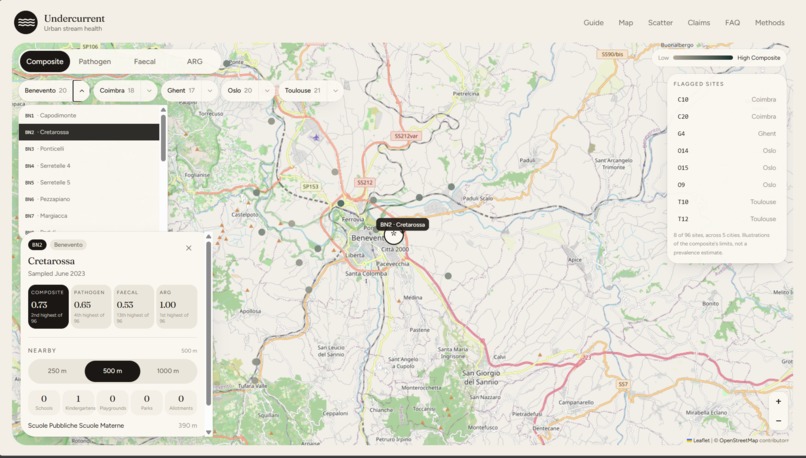
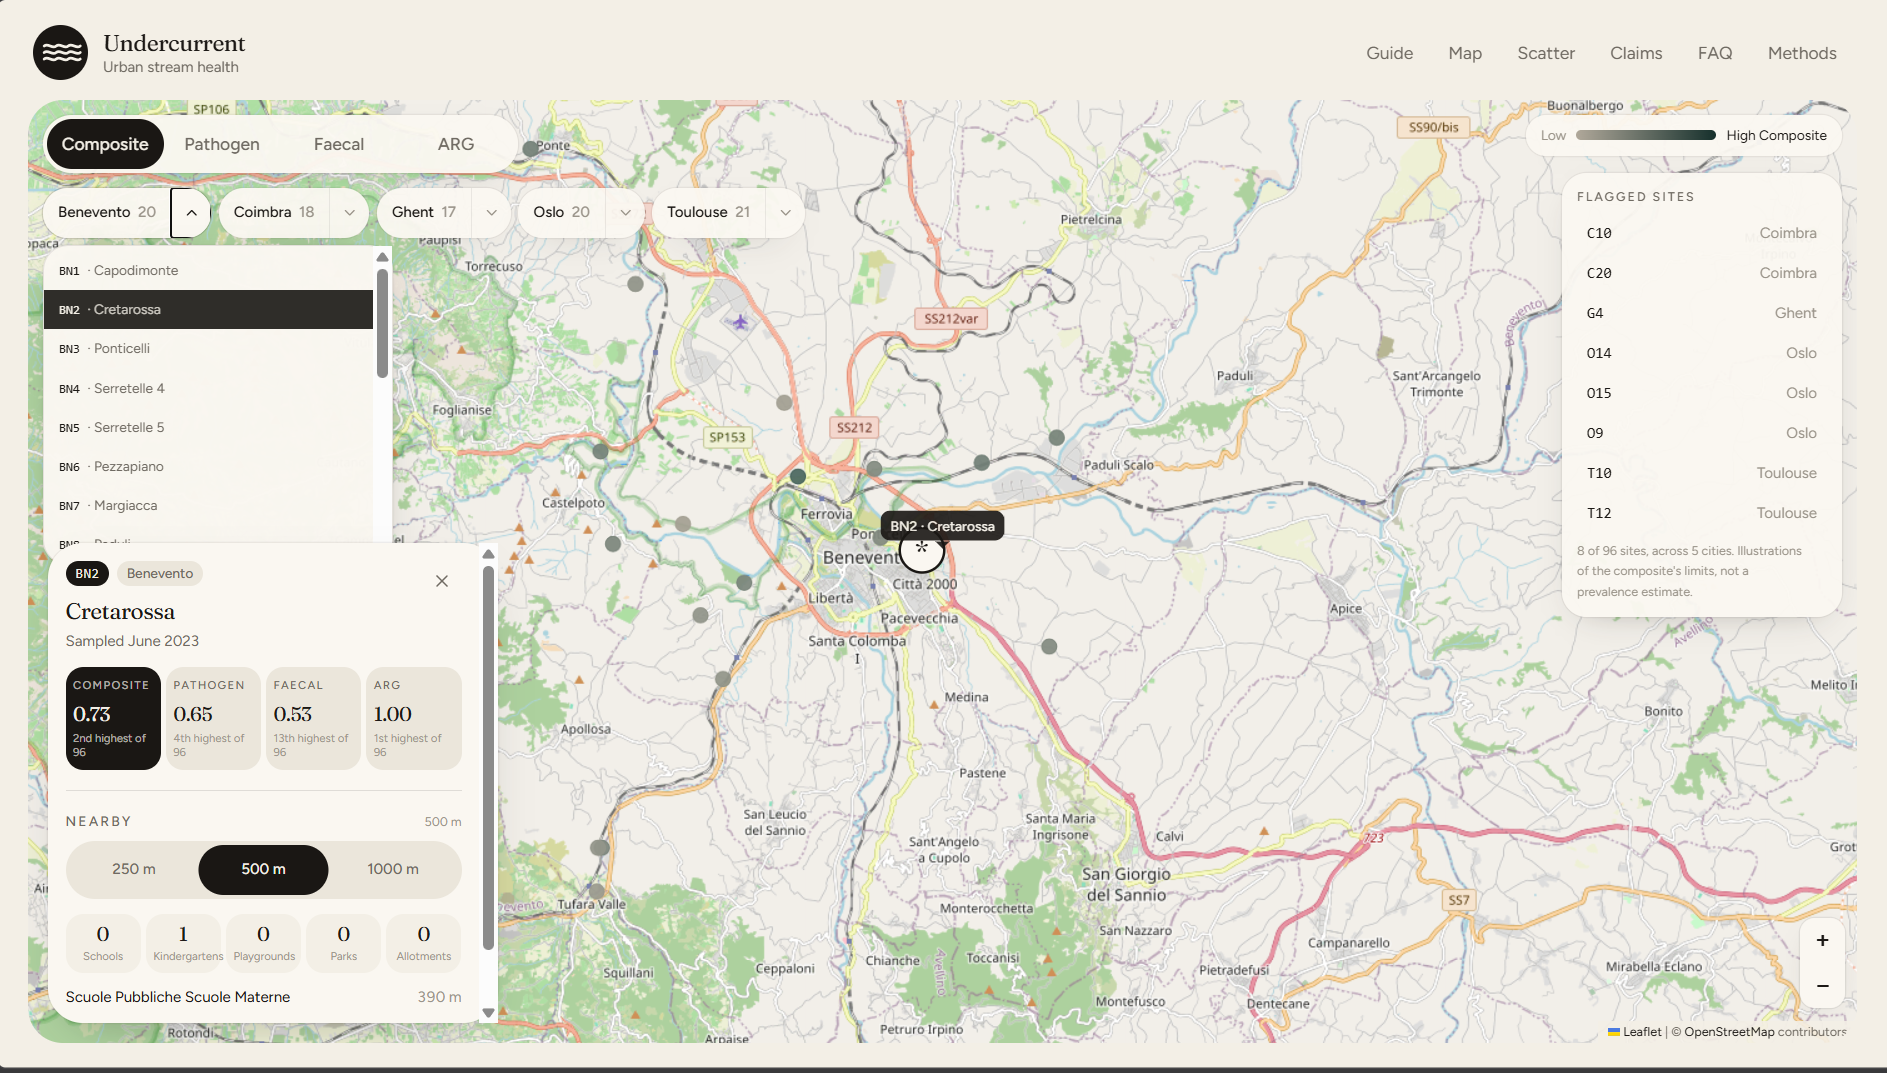
Inspect individual sites, compare four risk signals, and explore nearby environmental context.
-
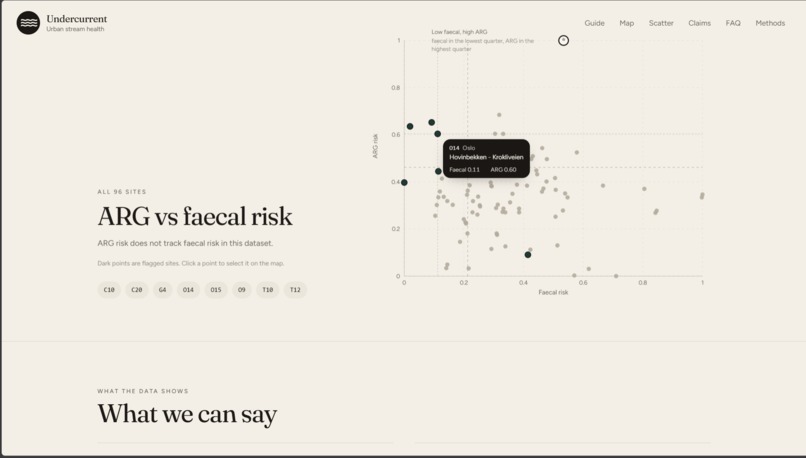
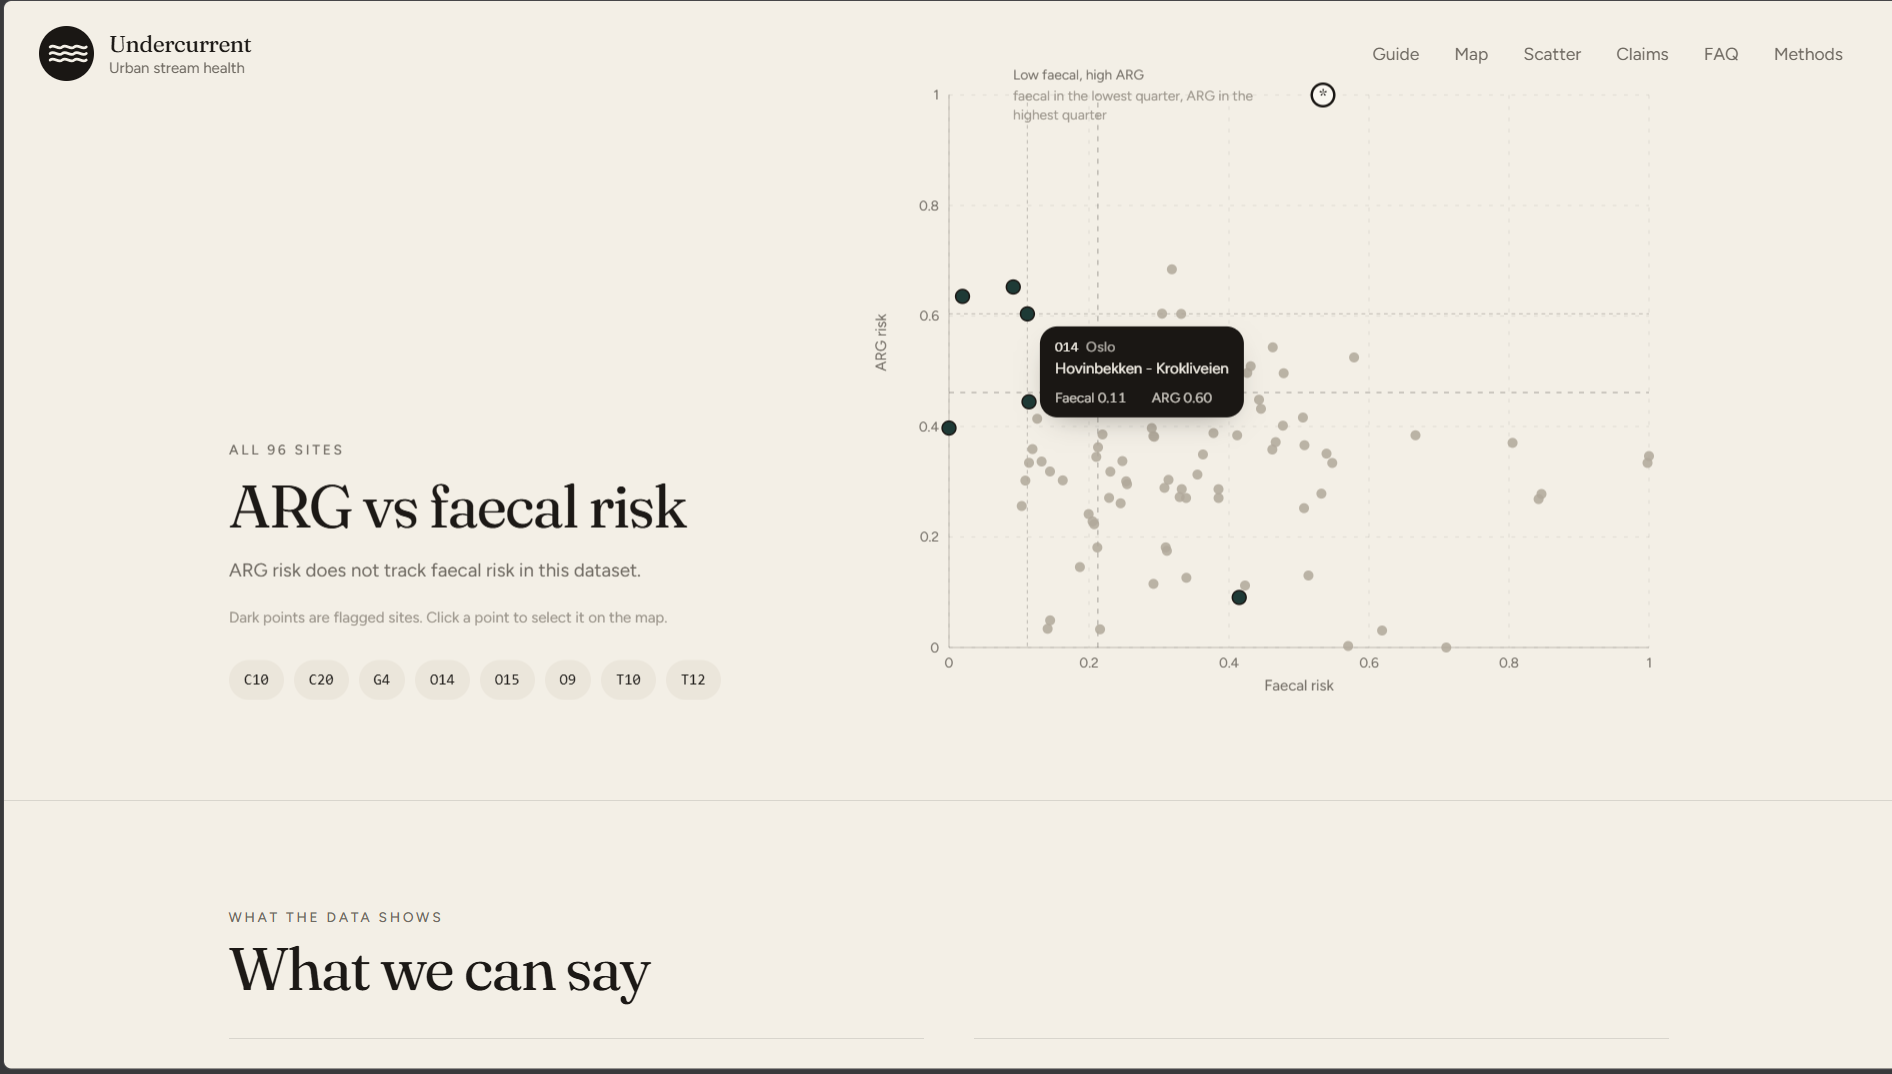
ARG vs Faecal Risk
-
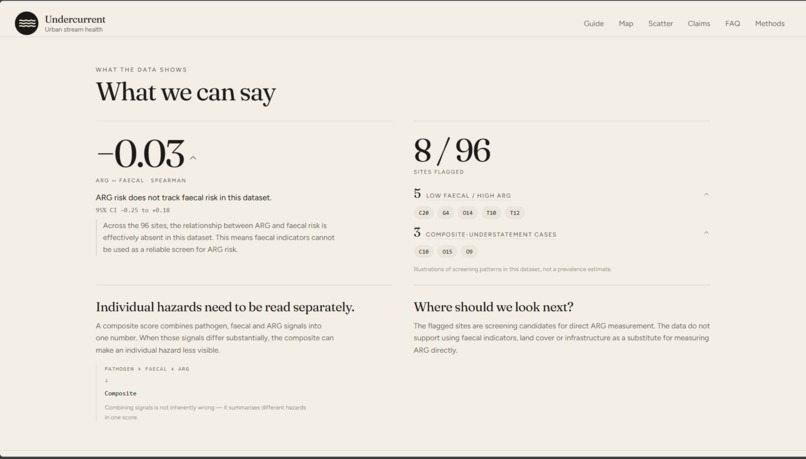
Key findings from the dataset
-

A simple guide to the key terms and statistical concepts used throughout Undercurrent.
-
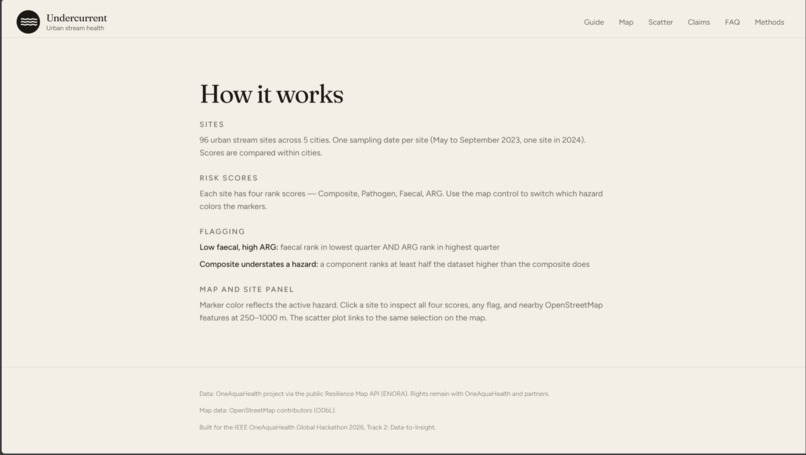
An overview of Undercurrent’s data, risk scores, screening rules, and interactive map.


Inspiration
Urban streams are where cities, wildlife and people meet, which is exactly the space the One Health idea cares about. Antimicrobial resistance is a major global health threat, and the environment is one of the places it spreads and persists. OneAquaHealth's Resilience Map condenses three hazards at each stream site (pathogens, faecal contamination and antimicrobial-resistance genes, "ARG") into one composite score. A single number is convenient. We wanted to know what it averages away.
One site answered the question for us. At T10 in Toulouse, faecal risk is the 2nd lowest of 96 sites, yet ARG risk is the 4th highest. Its composite ranks only 61st highest, so on the composite it looks unremarkable. Clean on the surface, resistant underneath. That gap is what inspired Undercurrent, and the hackathon's theme, turning stream data into actionable One Health intelligence, told us what to do with it.
Our first idea was an "action radius": find the distance from a stream at which surrounding land use drives resistance risk, so a city would know how far from the bank to act. We decided to let the data decide. It did not support that idea, and what it showed instead turned out to be more useful.
What it does
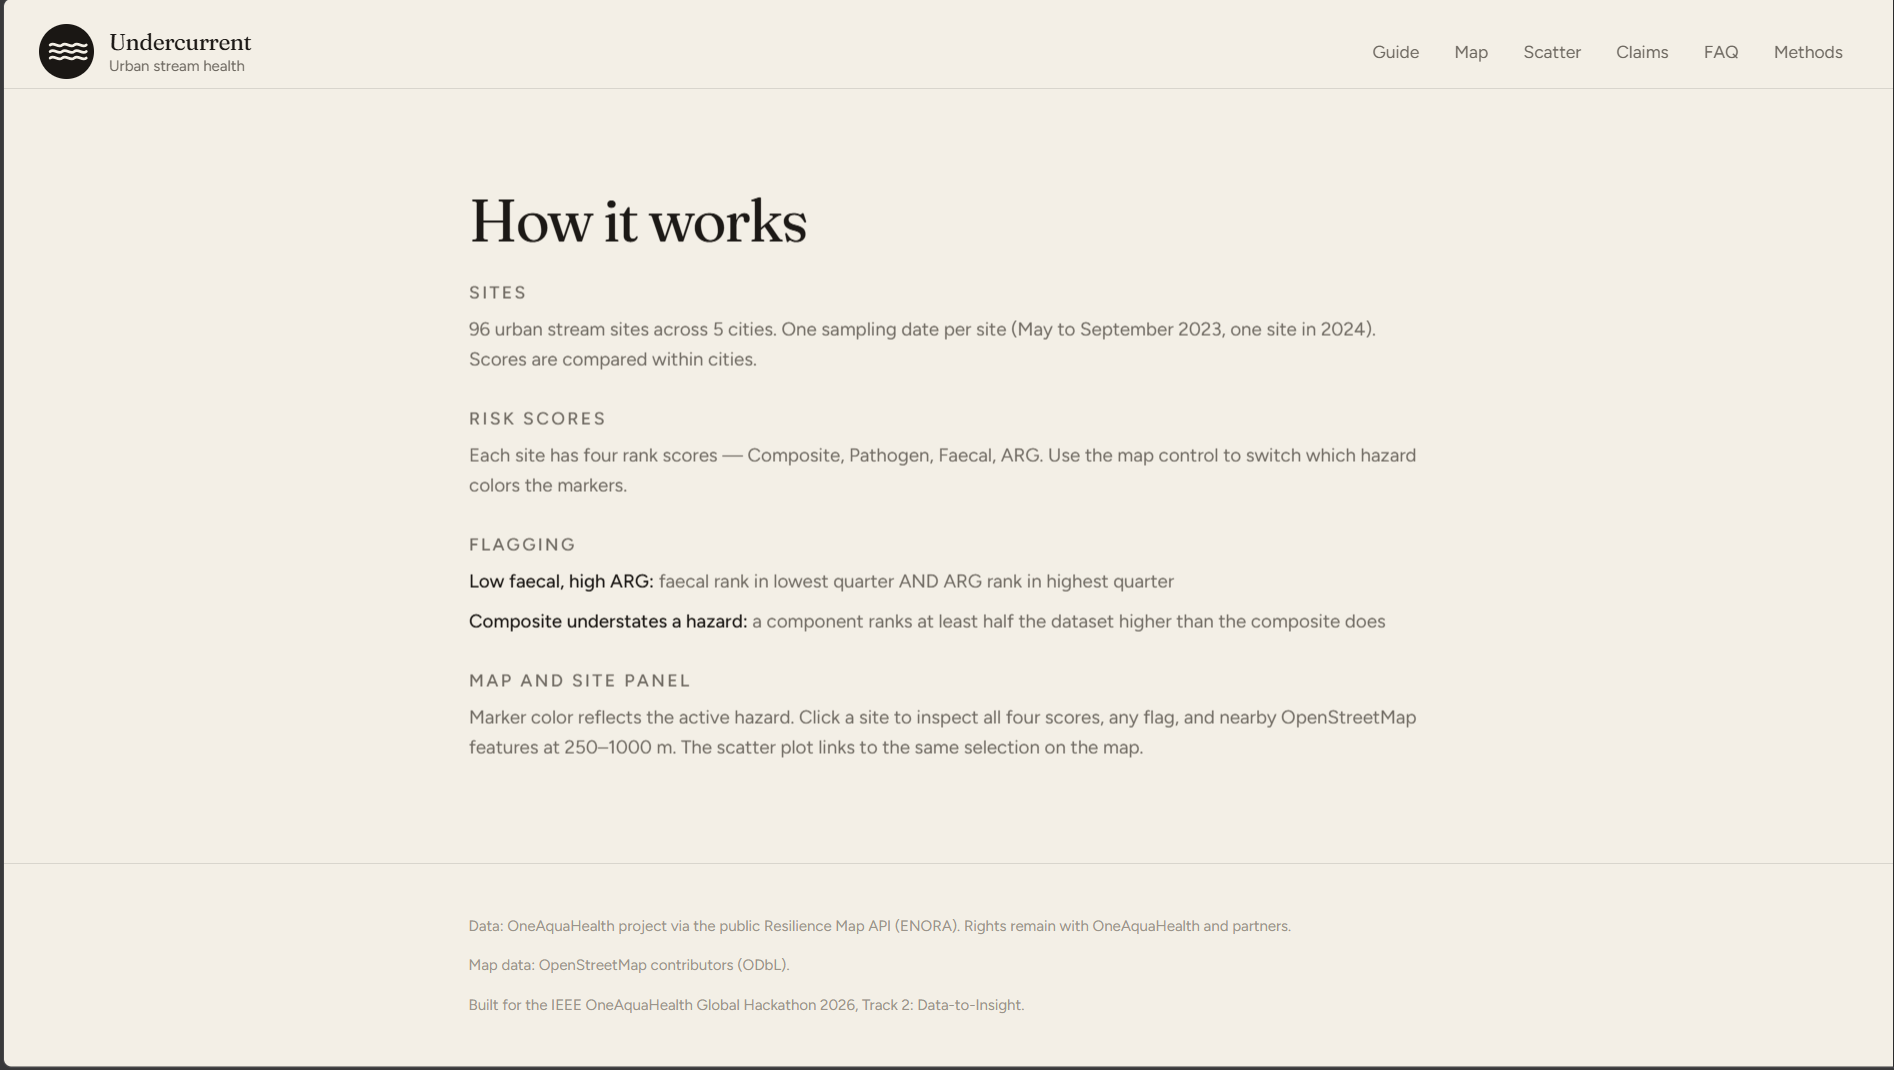
Undercurrent is an interactive map of 96 urban stream sites in Benevento, Coimbra, Ghent, Oslo and Toulouse that shows which hazard the composite hides.
- Switch the map from Composite to ARG and watch the picture change.
- Open any site for its ranks on every hazard, a plain-language sentence, and the schools, playgrounds, parks and allotments nearby.
- See all 96 sites on an ARG-versus-faecal scatter plot, linked to the map.
- Read what the data supports, with a guided tour and glossary for non-specialists.
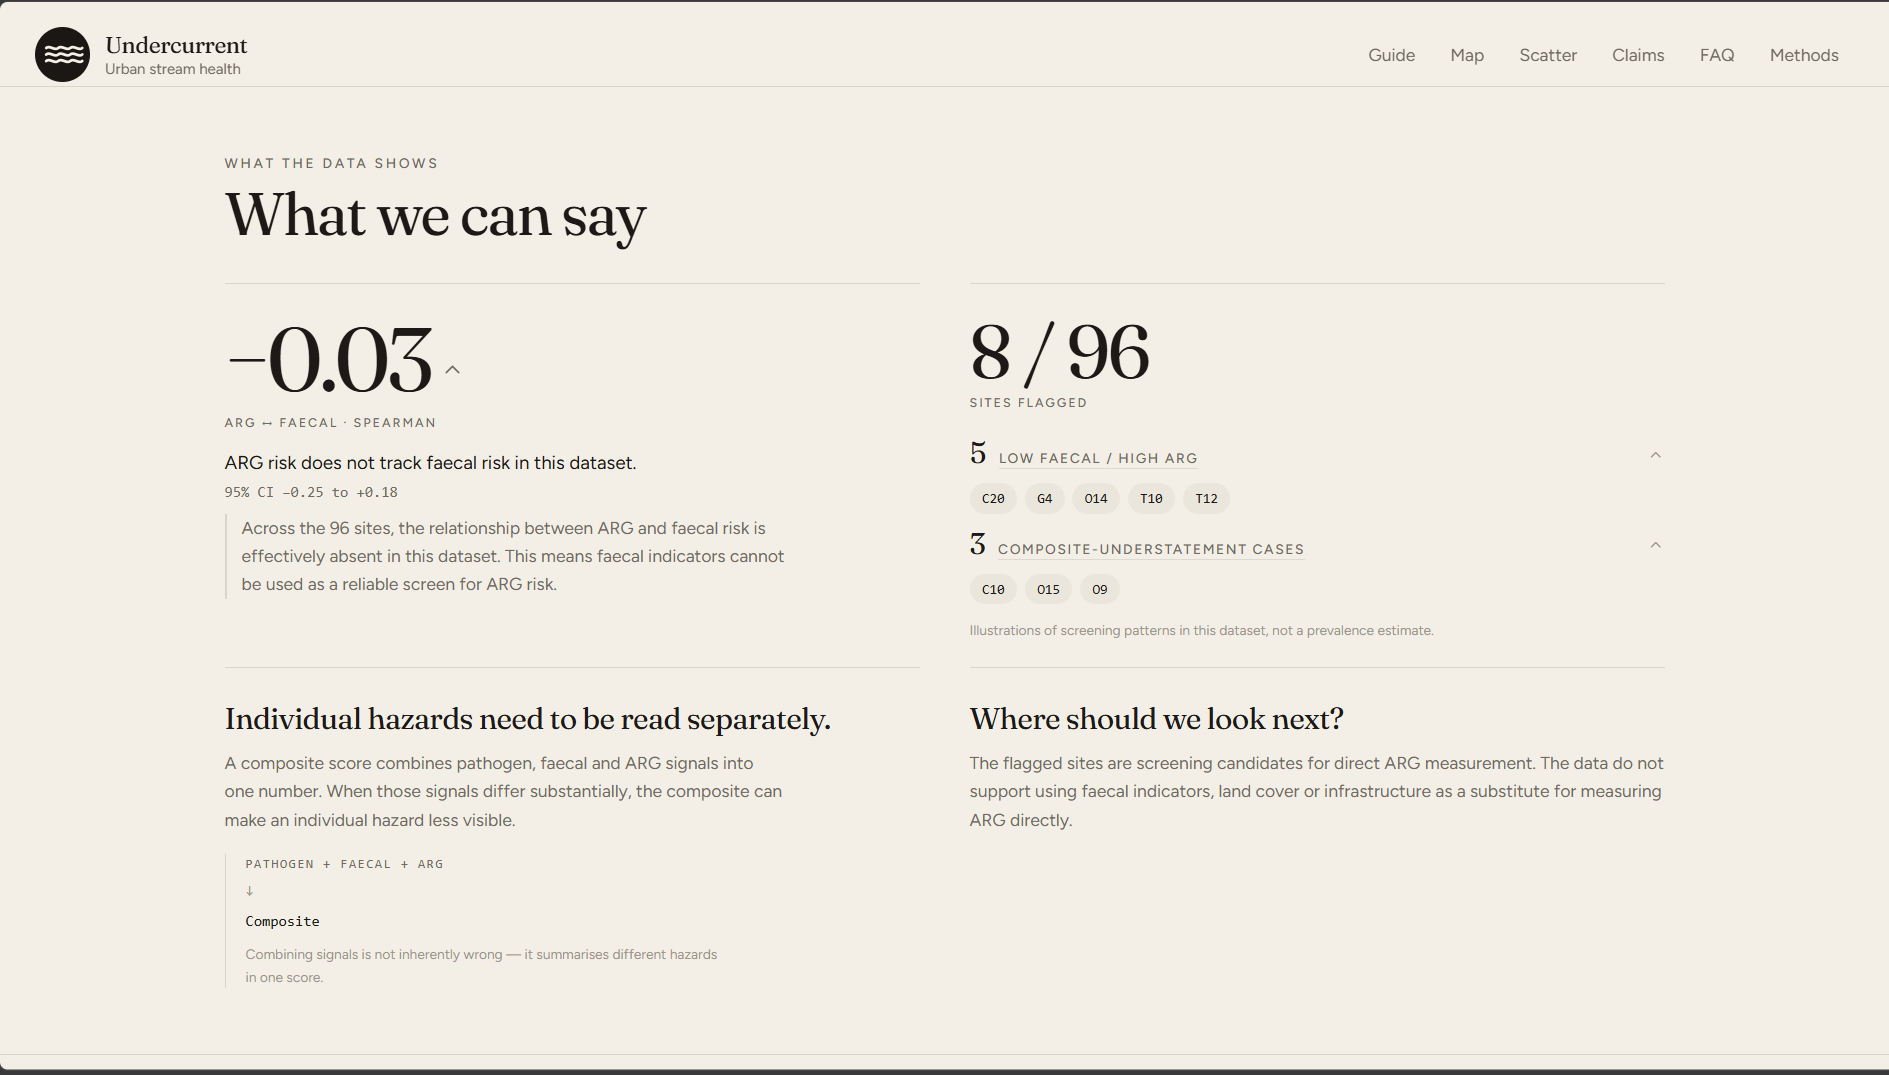
The central finding is that faecal and pathogen risk move together (within-city Spearman $\rho = +0.69$), so they dominate the average, while ARG moves independently of faecal risk ($\rho = -0.03$, 95% CI $[-0.25,\,+0.18]$). The consequence for cities: resistance risk needs its own measurement, and Undercurrent shows which sites to look at first. Eight sites are flagged, in four of the five cities.
How we built it
Data. We pulled the OneAquaHealth Resilience Map API once, saved it unchanged with SHA-256 hashes, and added nearby schools, playgrounds and parks from OpenStreetMap. The site never calls a live API.
Analysis, in a Python pipeline that uses only the standard library:
- The composite is the plain mean of the three scores, $C_i = \tfrac{1}{3}\,(P_i + F_i + A_i)$, which we verified in the data.
- Because city and sampling season overlap, every comparison is within city: scores are ranked inside each city and centred, so differences between cities cannot drive a result, $$\rho_w = \frac{\sum_i \tilde a_i\,\tilde b_i}{\sqrt{\sum_i \tilde a_i^{2}}\;\sqrt{\sum_i \tilde b_i^{2}}}.$$
- For each landscape metric we tested 8 nested buffer radii $R={50,\dots,2000}$ m. Picking the best of eight overlapping radii inflates false positives, so significance comes from a permutation test of the maximum statistic $T=\max_{r\in R}\lvert\rho_w(r)\rvert$, followed by Benjamini-Hochberg correction. We added bootstrap confidence intervals and leave-one-city-out checks.
- Flags are rank rules: a site is flagged when its faecal rank is in the lowest quarter and its ARG rank in the highest quarter, or when a component ranks at least half the dataset above the composite.
- Before trusting the pipeline, we tested it on synthetic data: it recovered a planted effect at the right radius, and on pure noise it produced no supported findings.
Product. React and TypeScript with TanStack Start, Tailwind, Leaflet and Recharts, reading a single static results.json produced by the pipeline.
Challenges we ran into
- Letting go of our first idea. Across 24 distinct tests, no landscape or infrastructure variable explained ARG after correction (smallest $q \approx 0.67$ for ARG). We rebuilt the project around the finding the data supported.
- Small samples. With 96 sites, only correlations of about $r_{\min}=\tanh!\big(\tfrac{z_{0.975}+z_{0.8}}{\sqrt{n_\mathrm{eff}-3}}\big)\approx 0.29$ or larger can be detected, so we report what we can exclude and what we cannot.
- City confounding. Pooled analysis can flip a sign: pathogen risk against vegetation cover is about $-0.13$ pooled but $+0.30$ within cities. That is why every result is within-city.
- Making a flag mean something. If faecal and ARG were independent, we would expect $\dfrac{n_F\,n_A}{n}=\dfrac{24\times 25}{96}=6.25$ sites to show the low-faecal, high-ARG pattern by chance, and we observed 5. The pattern is a consequence of independence, not a set of odd sites, so we present it that way.
- Uneven map data. OpenStreetMap coverage differs sharply by city (about 0.6 mapped features within 500 m of a Benevento site against 13.6 in Oslo), so nearby counts are never compared across cities.
- Tooling. A Windows policy blocked compiled data libraries on our machine, so we rewrote the pipeline in the standard library. As a side effect, anyone can reproduce it with no installs.
Accomplishments that we're proud of
- A concrete, checkable insight with a practical consequence for how cities monitor resistance.
- Statistics that hold up: within-city, multiple-testing-corrected, with uncertainty shown.
- A fully reproducible project: hashed snapshot, fixed seeds, open code and a methods document.
- A pivot we made because the evidence told us to.
What we learned
- A null result is still a result. Finding no landscape signal for ARG told us something a city can use: land cover cannot stand in for measuring resistance directly.
- Aggregation hides structure, and so does pooling. The composite hides ARG, and pooling across cities flipped the sign of an association.
- Looking many times has a price. Testing 8 overlapping radii across many metrics produces convincing-looking patterns by chance, which is why we used a maximum-statistic permutation test and corrected across tests.
- A pattern needs a baseline. Five "low faecal, high ARG" sites sounds notable until you compute that about six are expected by chance when the hazards are independent.
- Honesty is a design choice. For non-specialists, plain-language sentences, a glossary and a guided tour made the findings readable without overstating them.
- Constraints can help. Being forced onto the standard library made the project easier for anyone else to reproduce.
What's next for Undercurrent
- Pair flagged sites with direct ARG measurements and repeated sampling to test whether the pattern persists.
- Bring citizen-science observations alongside these research-grade snapshots using the same screening workflow.
- Add cities: a new city needs site coordinates and scores, an OpenStreetMap run for its bounding box, and a rebuild.
Data: OneAquaHealth project via the public Resilience Map API (ENORA). Rights remain with OneAquaHealth and partners. Map data: OpenStreetMap contributors (ODbL).
Built With
- css
- openstreetmap
- python
- typescript
- vercel
- vite

Log in or sign up for Devpost to join the conversation.