-
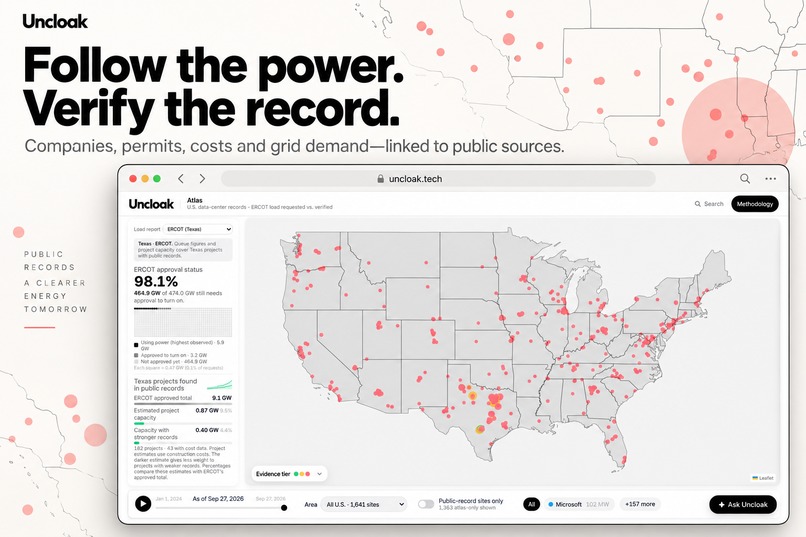
Uncloak Thumbnail
-
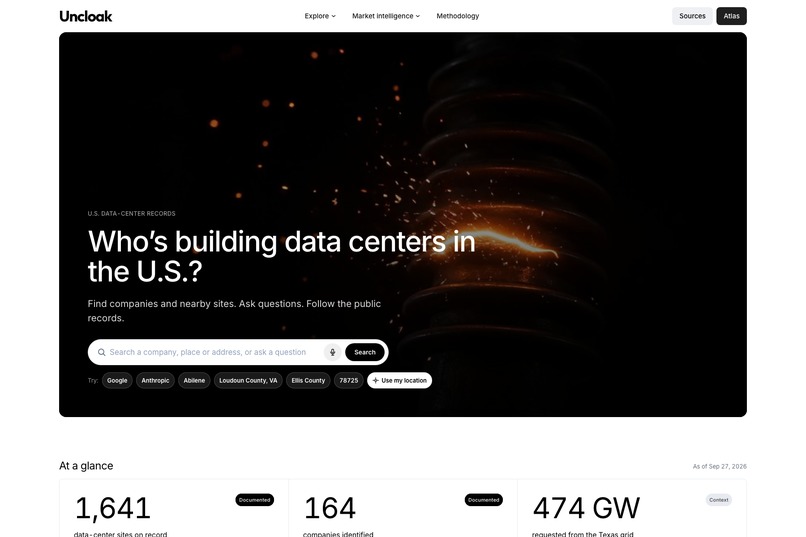
Main site page
-
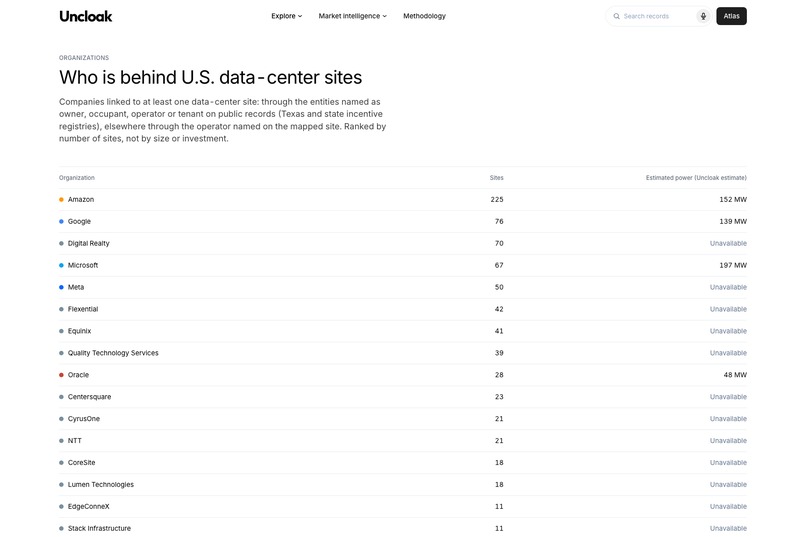
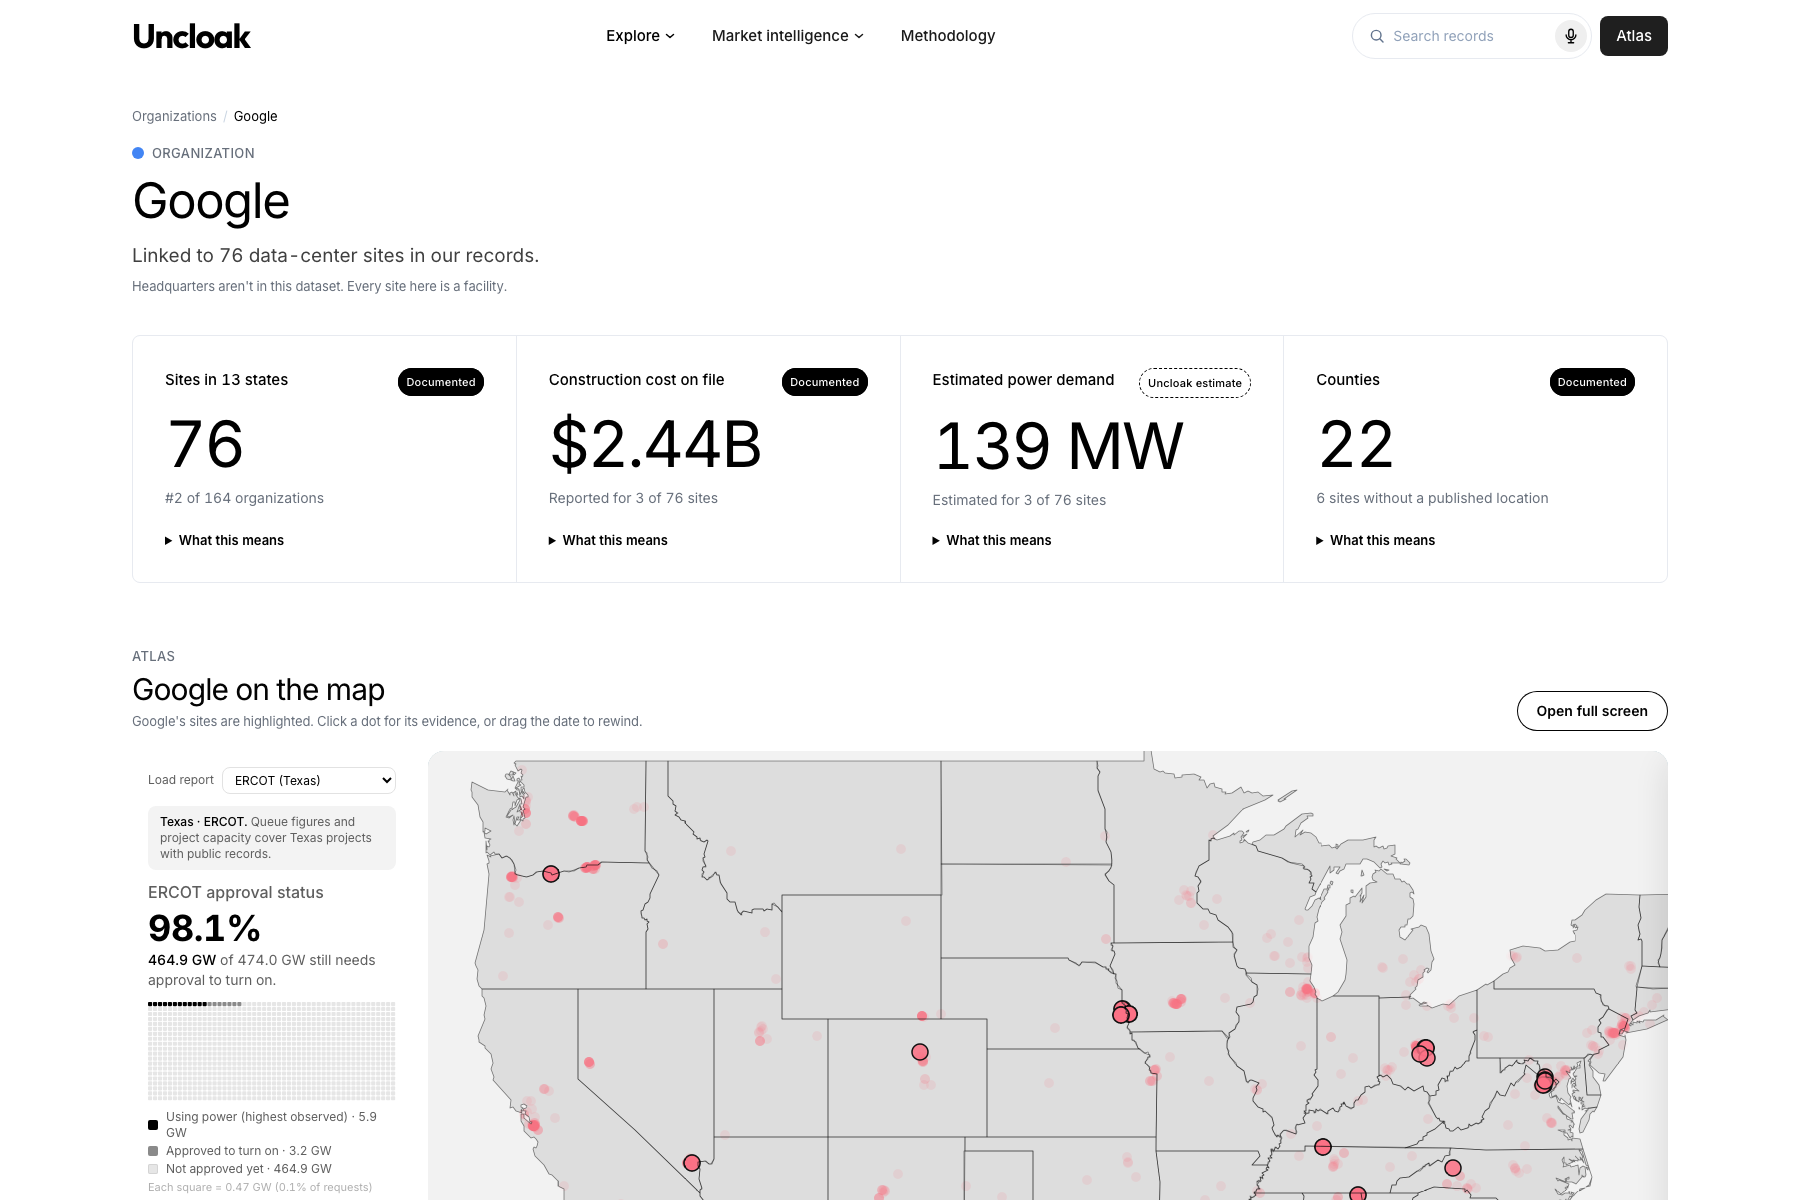
Companies behind data centers
-
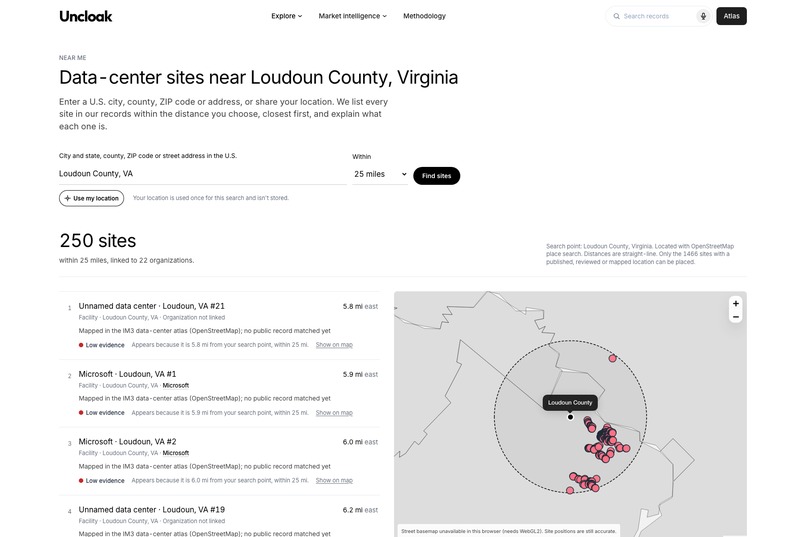
-
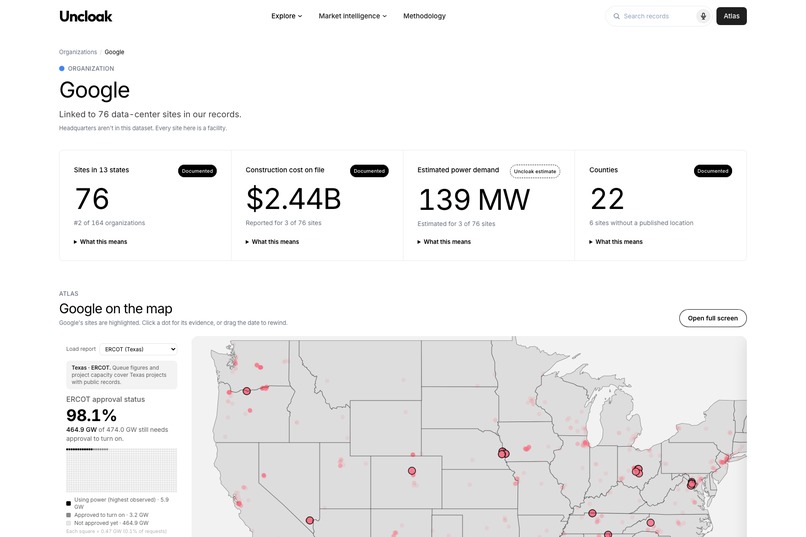
Google's data centers
-
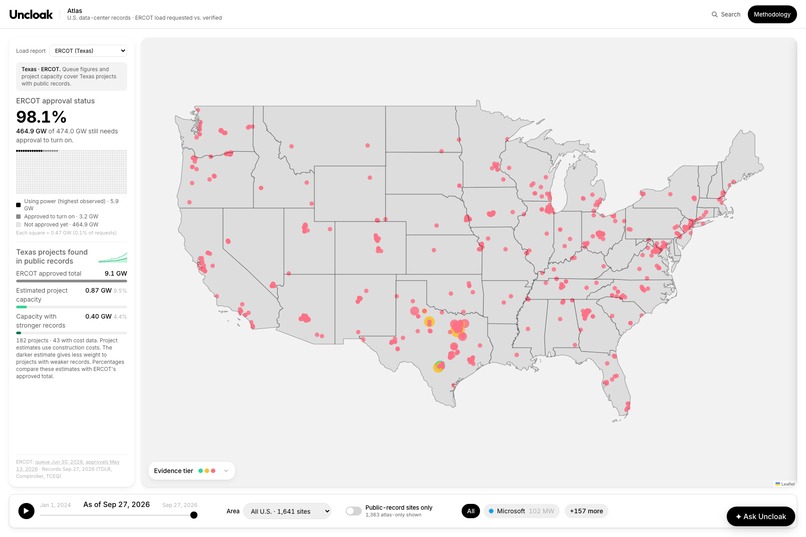
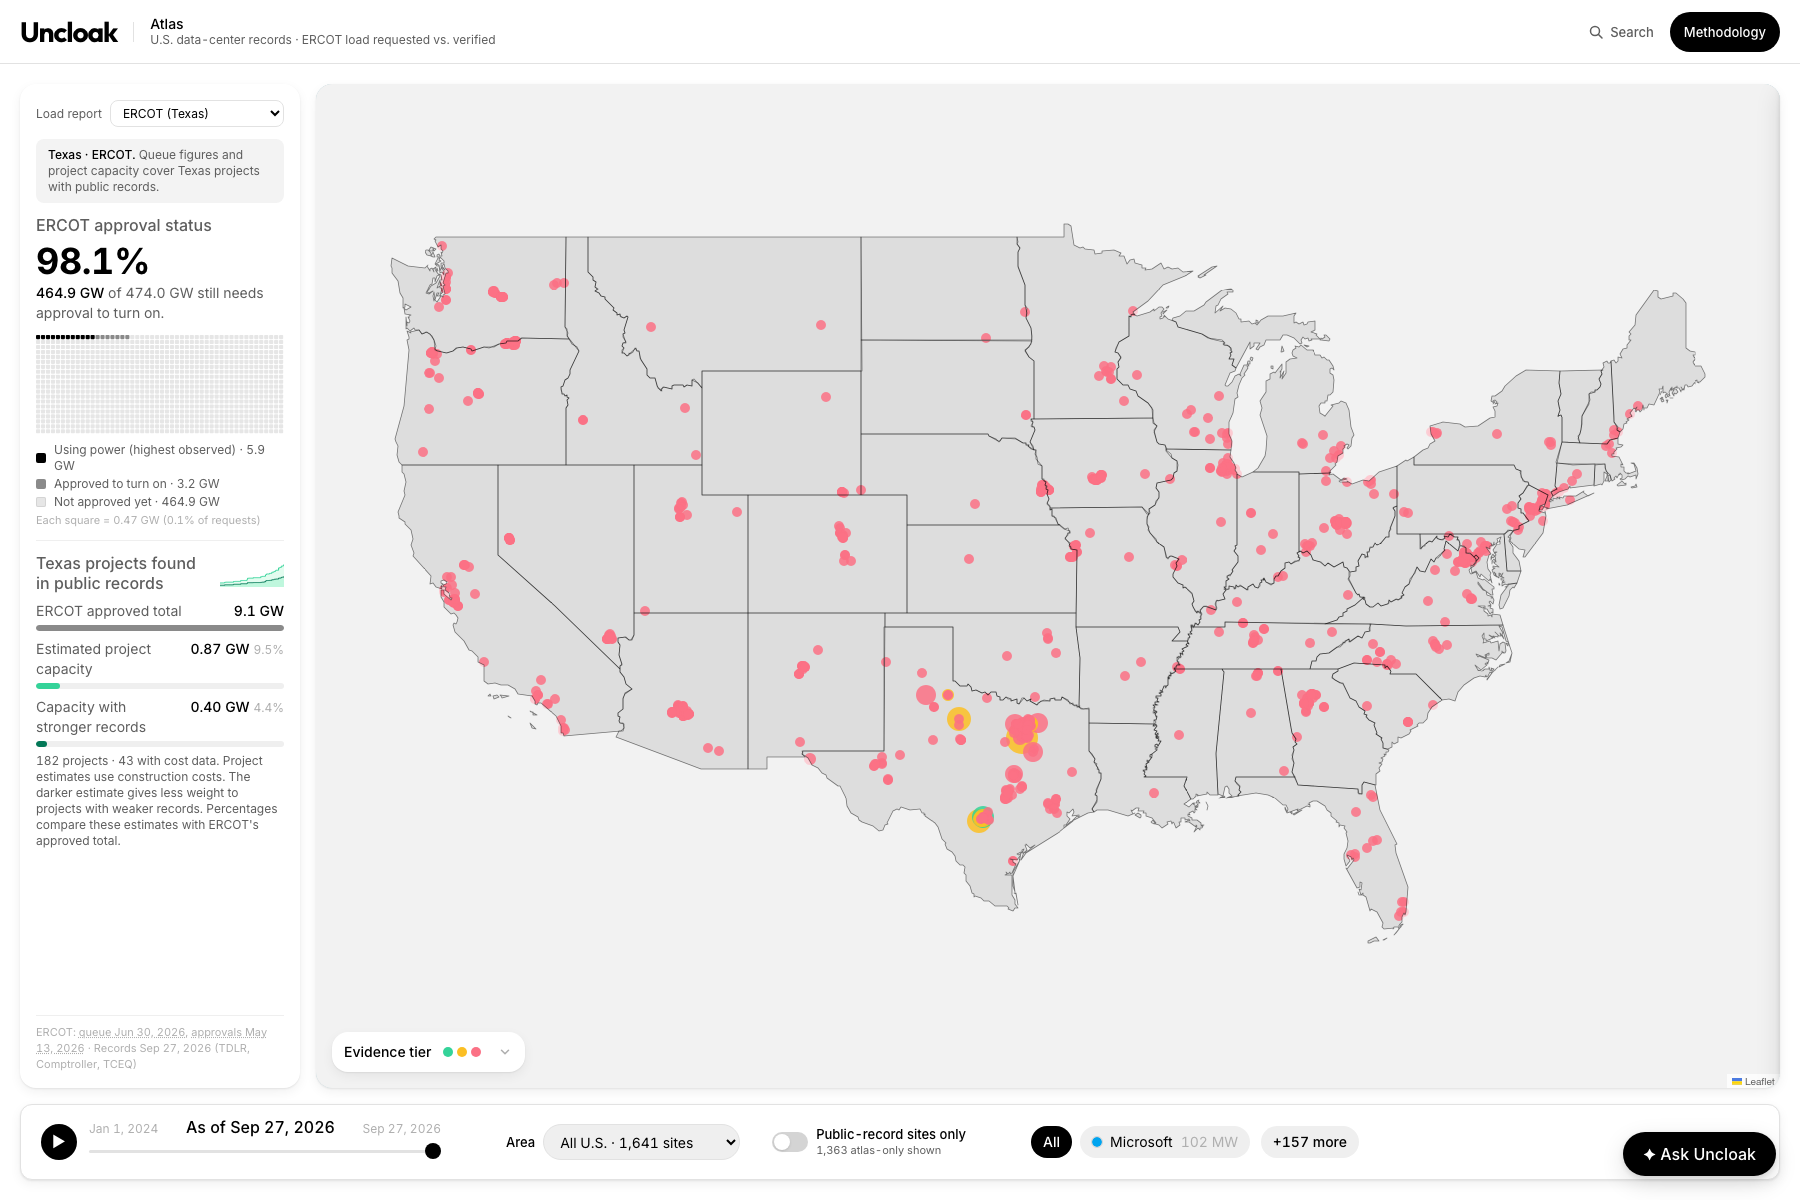
USA map
-
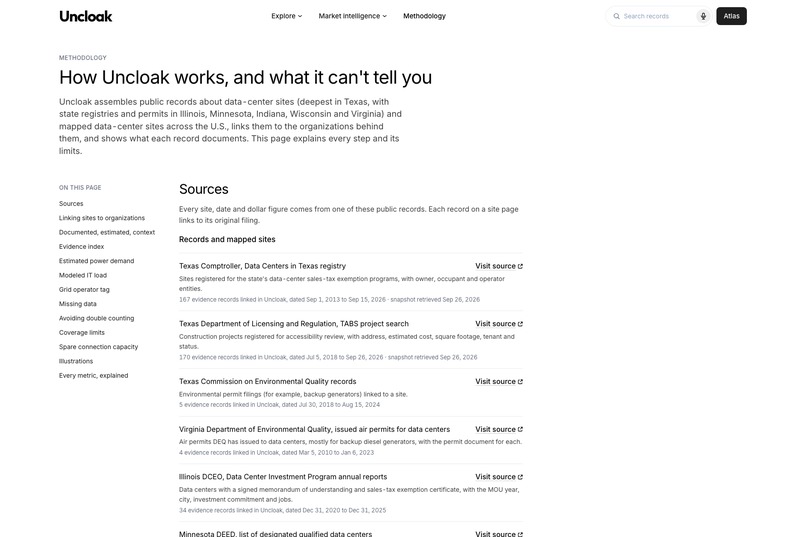
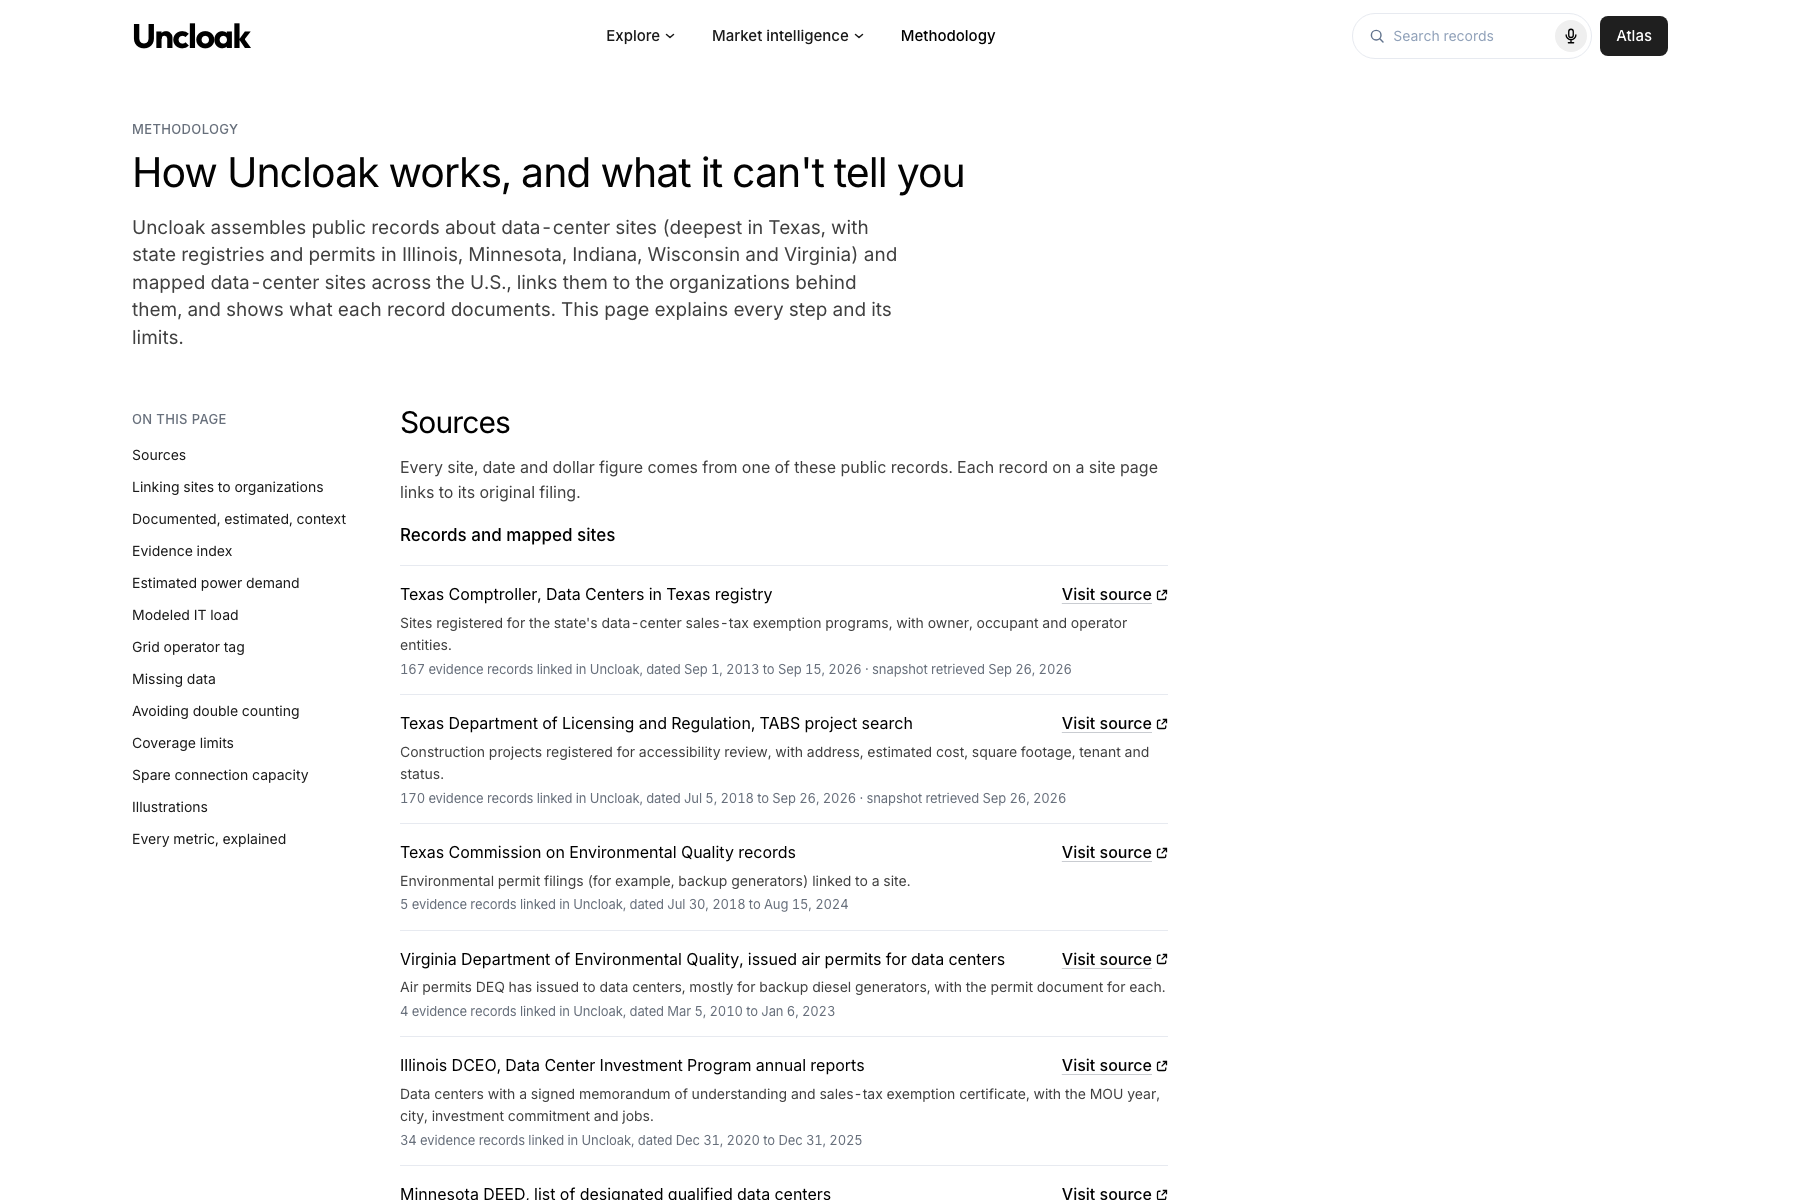
Our methodology
-
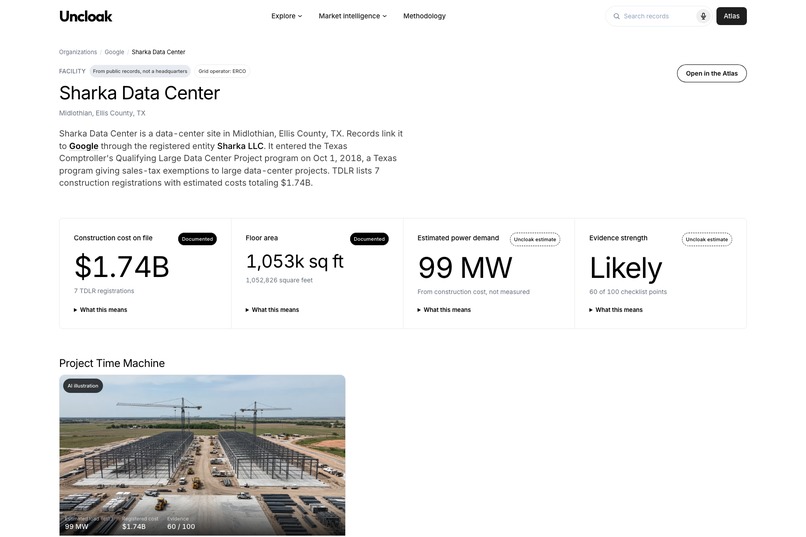
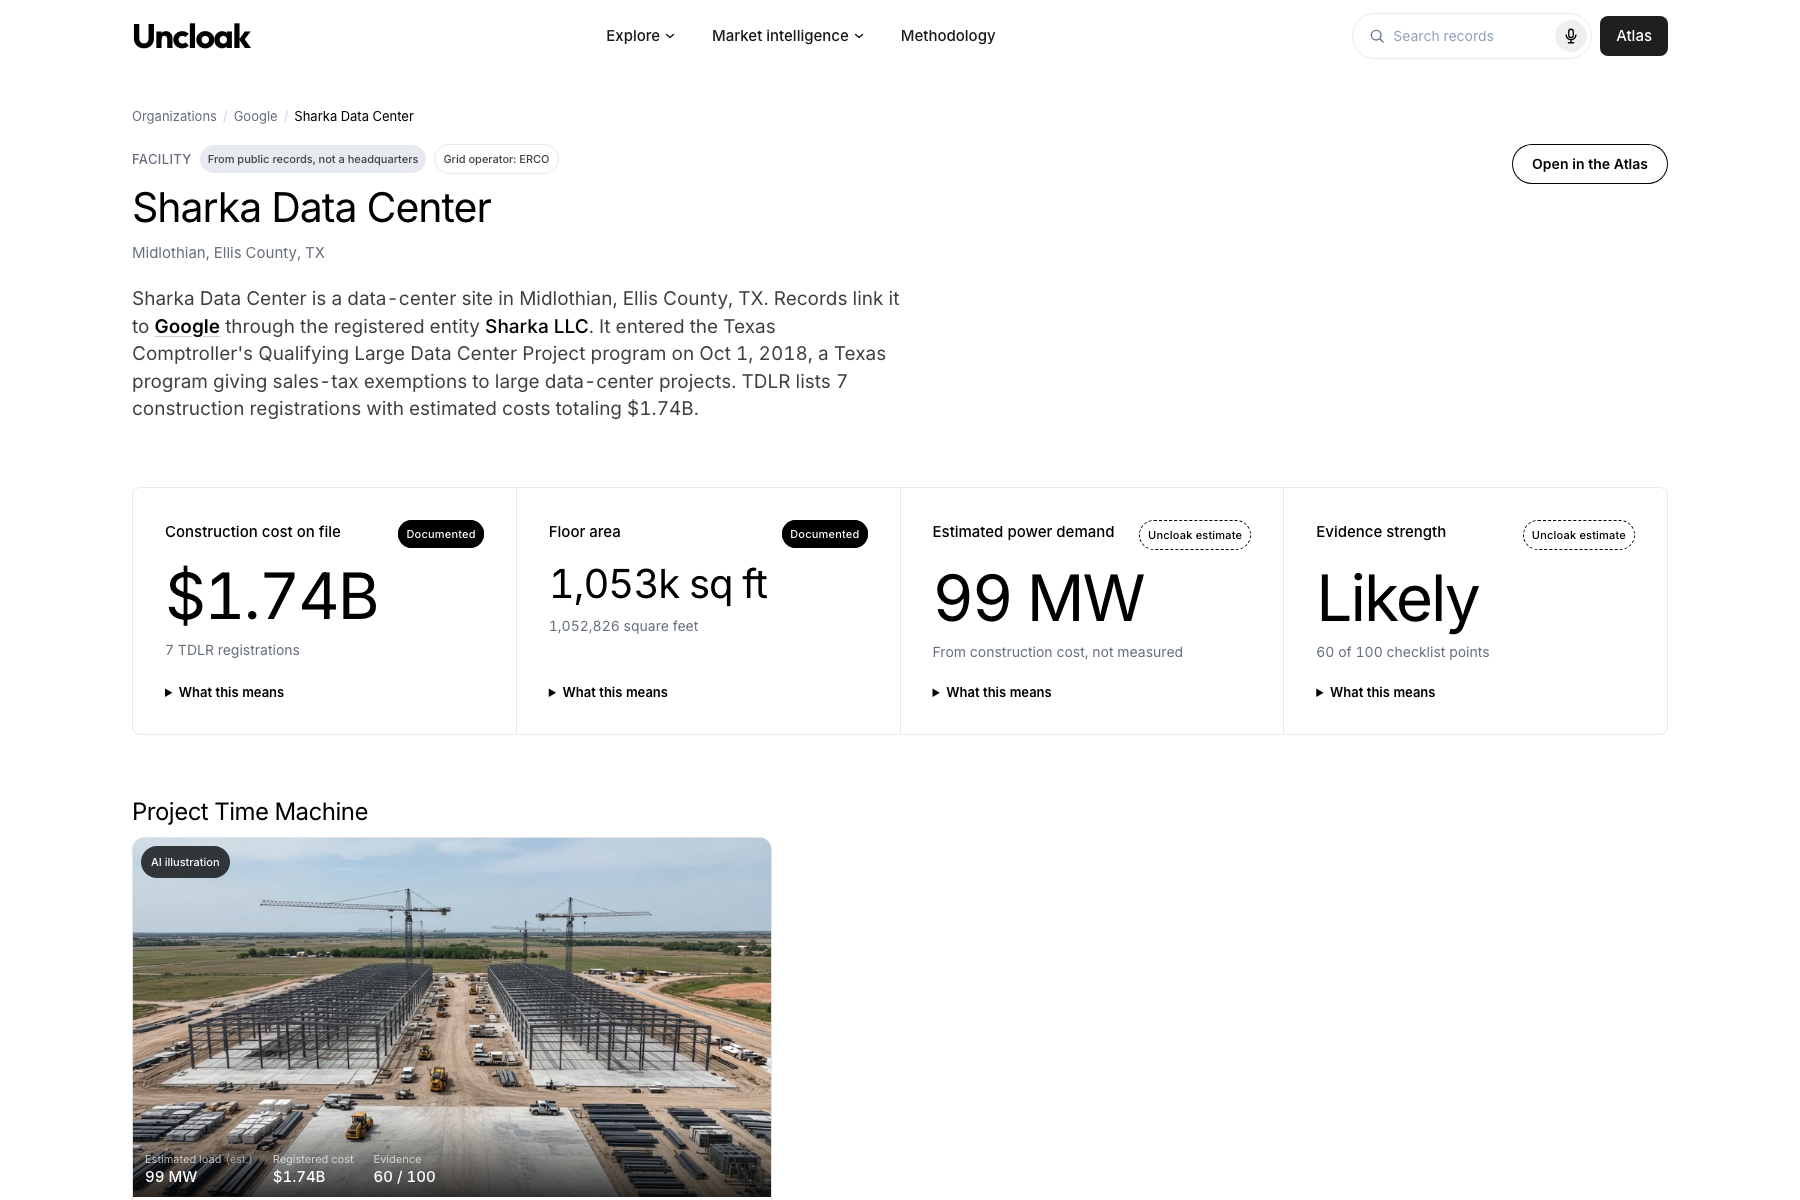
Specific Data Center
Inspiration
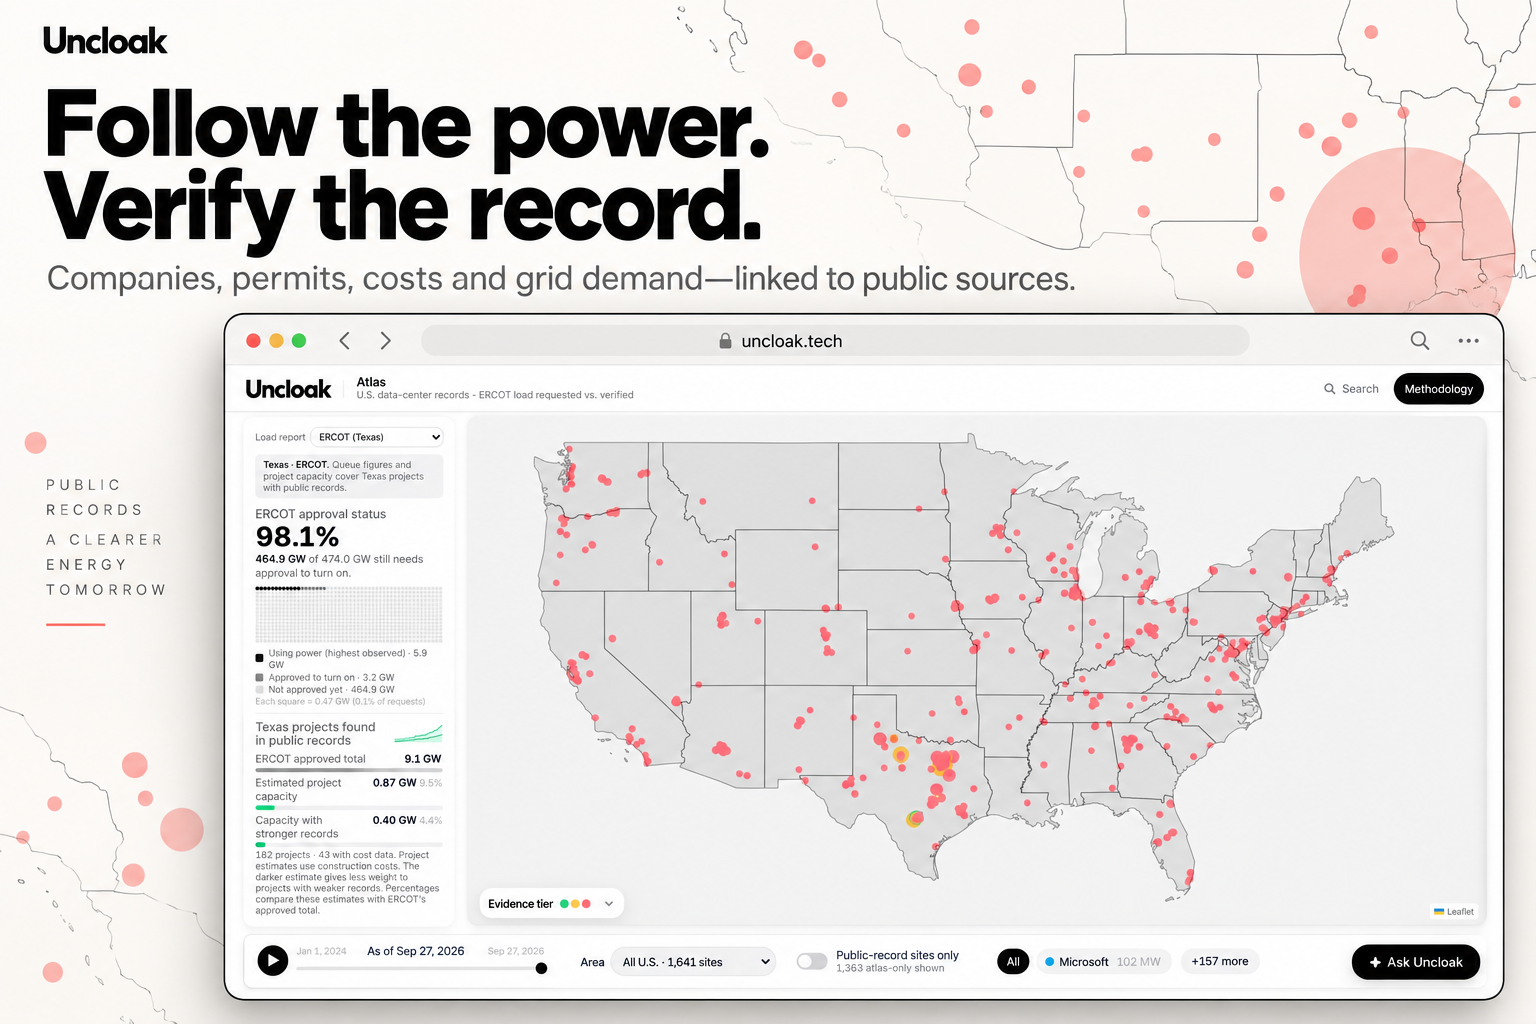
In what many are describing as a 21st century gold rush America's power grid is currently being swarmed by an AI boom. Companies are now demanding utilities and grid operators for ammounts of energy than the grid has ever carried. Large users have requested over 474 GW in Texas more than 5 times the peak that Texas has ever been able to provide for. Comically, only about 2% of this massive number has even been approved to connect. A similar pattern is being seen accros the country, PJM, a grid serving 13 states and DC claims that data centers will be a major driver in it's peak demand growth through 2031. Regulators in Georgia recently found that data centers were the driver of 65% of announced load later dropped from their largest utility pipeline.
This can create major set backs for local businesses. Small businesses, developers, and manufacturers have to wait for years for power, something which many cannot afford to wait as many run on very thin margin. The cruelty does not end here as many are shoveled in underneath thousands of speculative or "fake" requests which never become buildings. This is not only troublesome for the everyday business owner but also the utilities as they plan power plants and transmission lines around these forecasts which customers help pay for.
One of the main issues that is propogated from this is the lack of visibility to the public of clean and understandable data regarding utilitiy energy demand. Data centers frequently try to mask the larger corporation that they are serving by filing with completely random and unrelated dummy names like "Sharka LLC". In addition many of these corporations make an effort to scatter evidence of what's being built across state tax registries, construction filings, environemtnal permits, and utility reports. As the AI boom continues to redefine technology and cause one of the biggest infrastructure buildouts in decades we wanted to give the public, business owners, and policy markers a clear answer of who is behind the data center boom and how much of it is real?
What it does
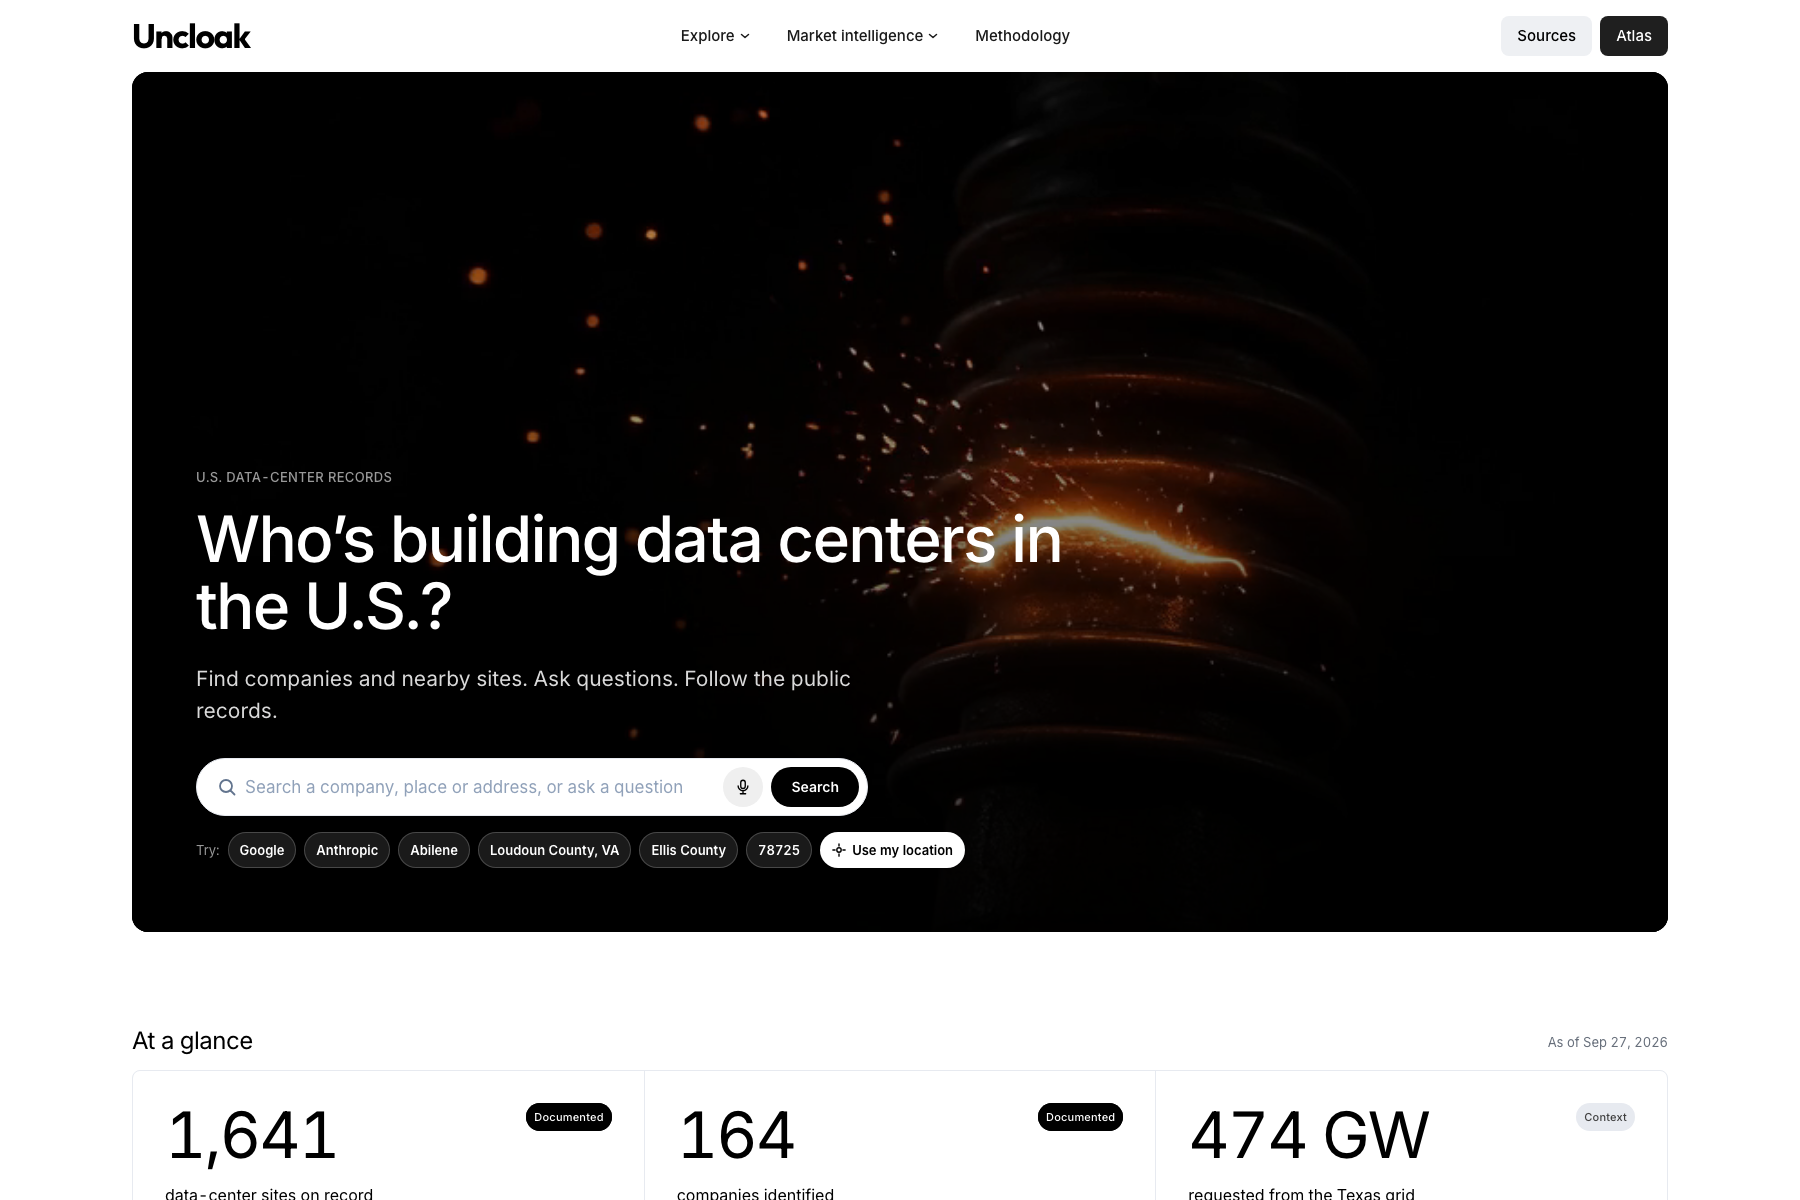
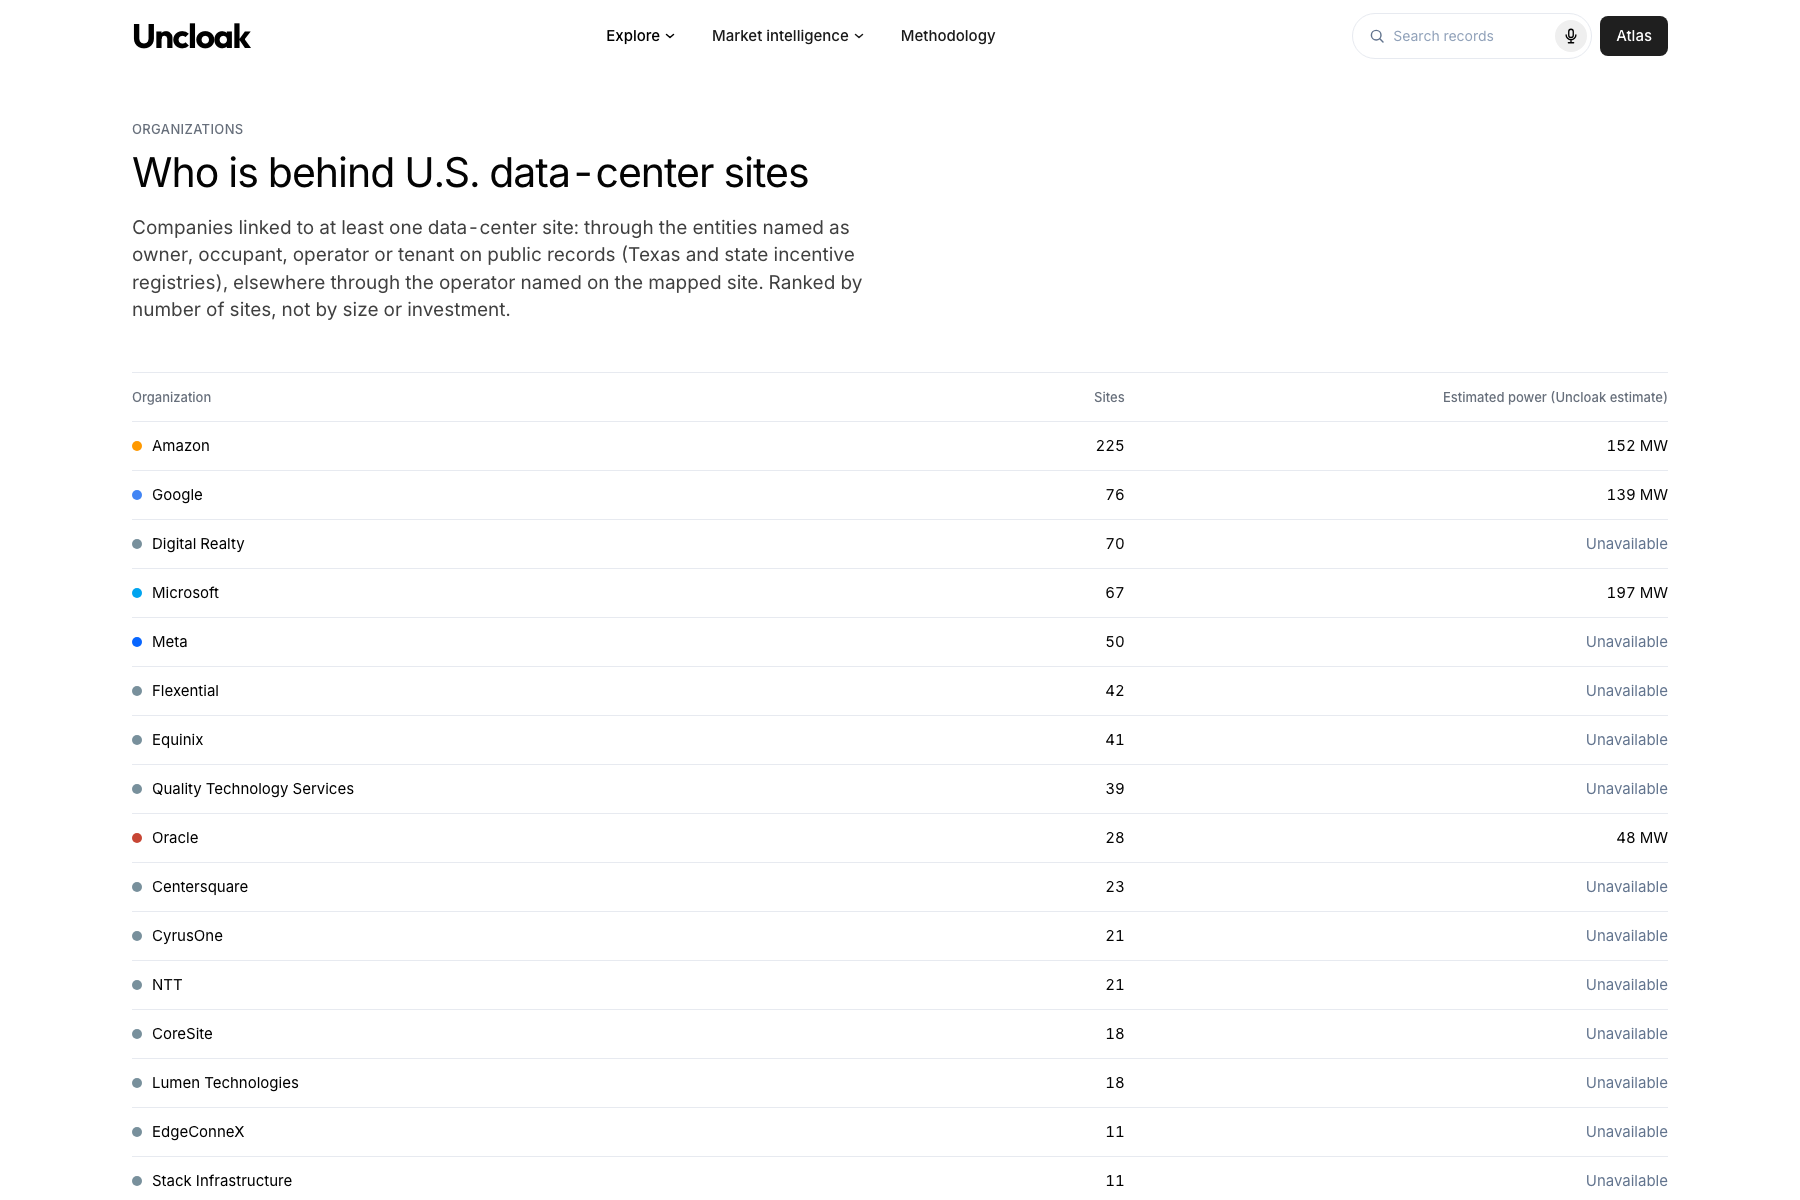
Uncloak provides transparency in the domain of data centers. This is crucial in a world ran by AI labs, where information is intentionally obscured and hidden from the public. It combines fragmented government filings, corporate entities, permits, infrastructure reports, and open mapping data into one searchable platform.
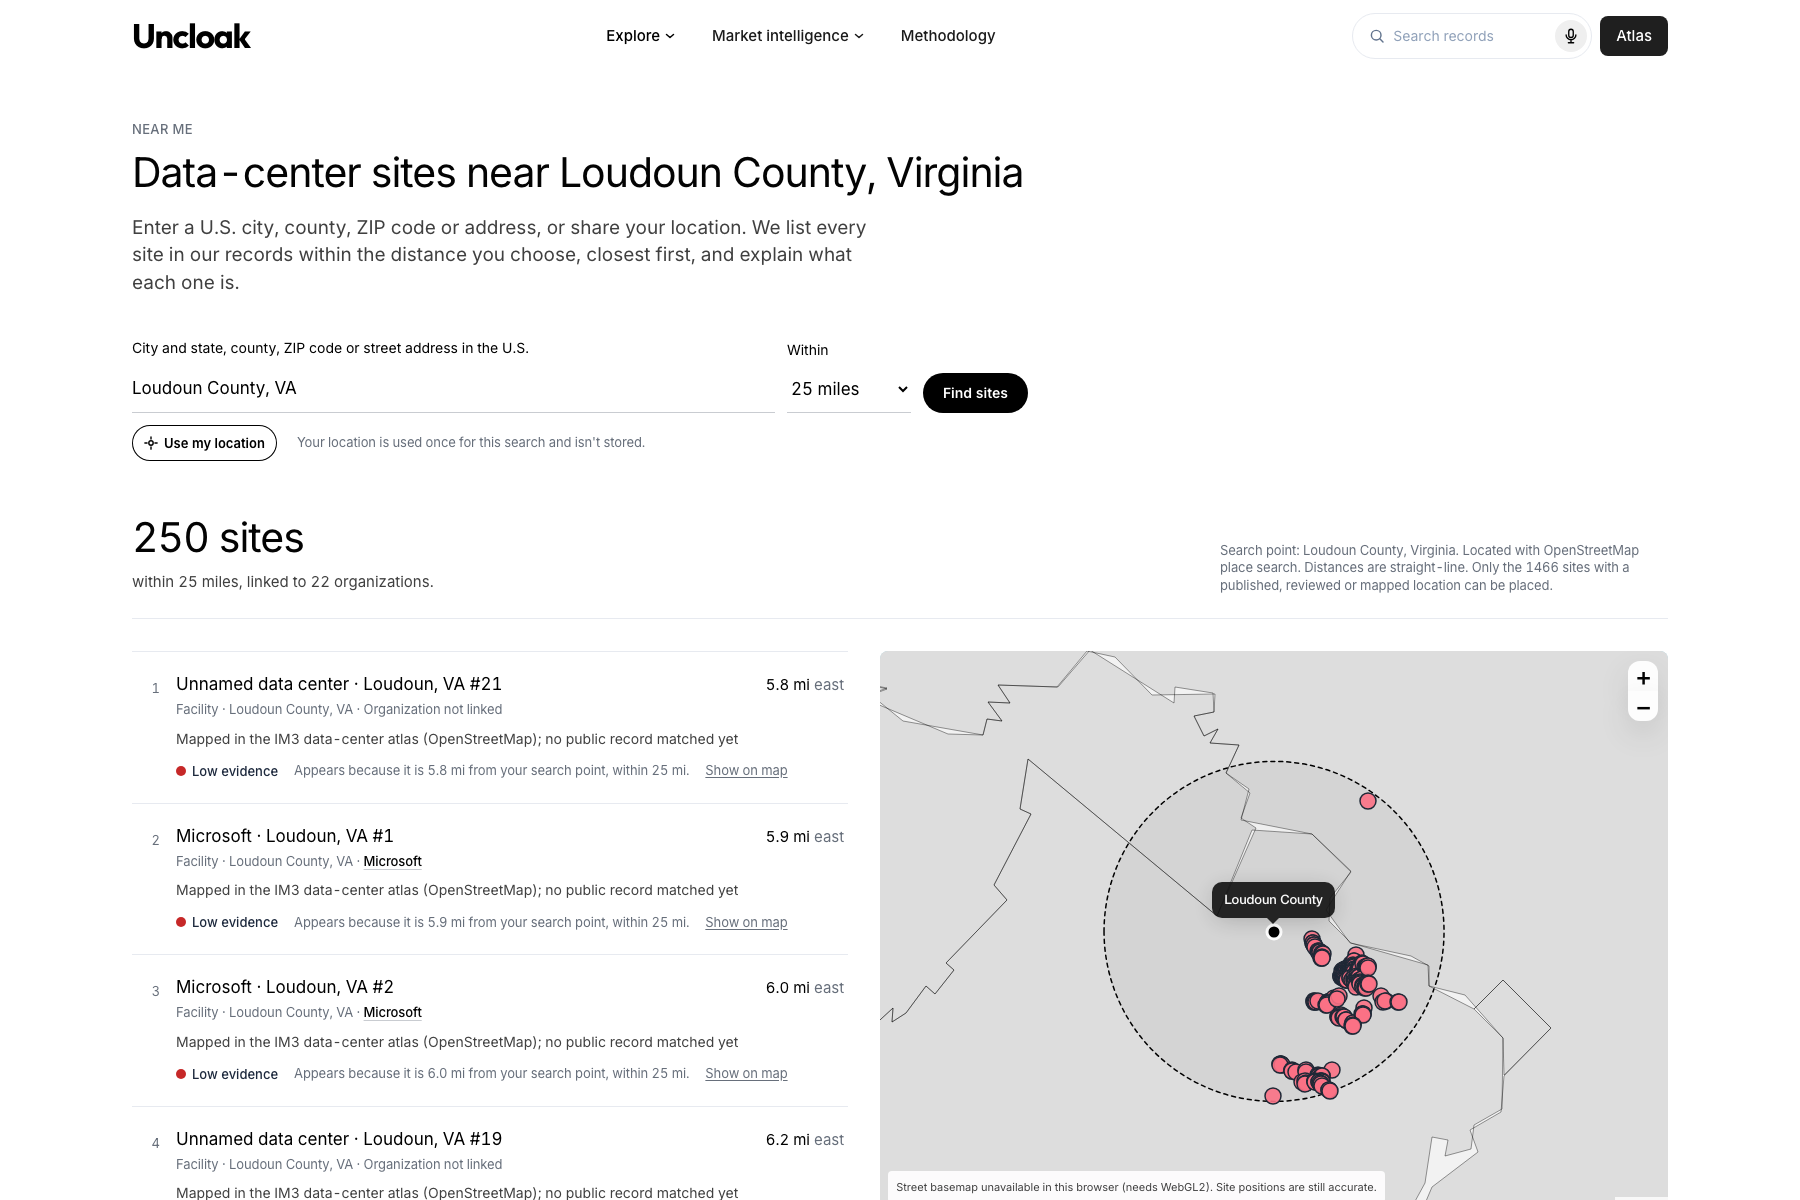
Users can search a company, LLC, zip code, or look around their local area to find data centers around them and the impact they each have. Uncloak currently maps more than 1,600 sites across the United States across 47 states. Users can also explore daa center development over time, compare identified projects with regional power demand, and ask questions through text or Grok Voice.
How we built it
Uncloack runs on Tiger Data (TimescaleDB on Tiger Cloud), a Pythin data pipeline, and a Next.js web app. The pipeline starts by gathering public records such as Texas tax, construction, and permit filings, ERCOT, Georgia Power and PJM load reports, ai permits, states incentive registries, and a national data-center atlats. Tiger Data is what makes the history possible. Evidence events, project scores and hourly plant output are stored as hypertables. A continuous aggregate uses time_bucket and last() to roll every site's evidence score up by week, which powers the Project Time Machine and the Queue Timeline. The queue view lines monthly grid reports up against those weekly rollups, using as-of joins and lag() for week-over-week change. For spare capacity, a daily continuous aggregate uses percentile sketches to calculate how often each plant's grid connection sits idle, without scanning millions of hourly rows. Scores are rebuilt so a score on any date uses only evidence available on that date, and the web app reads through a read-only database role. Gemini powers our chatbot "Ask Uncloak" through read only database tools making the datacenter map far more navigable for our users. Grok voice adds voice voice search and Grok Imagine generated clips for each construction stage with all the models recorded for transparency.
Challenges we ran into
The largest challenge was that public data is available without being practically usable. Relevant records are spread across agencies, PDFs, spreadsheets, search portals, inconsistent schemas, and unfamiliar corporate entities.
The same facility can appear under different names across several sources. One project may also have multiple buildings, registrations, addresses, subsidiaries, or dates. We had to avoid double counting while preserving the original records and uncertainty.
Voice input also required careful handling. Early transcript fragments could be mistaken for completed searches, so we implemented client-controlled silence detection and live cumulative transcription.
There were also small revisions regarding UI and interface. At times the UI seemed unintuitive, crowded, and overall, unappealing. We made executive design decisions to make sure Uncloak is usable for everyone.
Accomplishments that we're proud of
As freshman at one of our first ever hackathons we are extremely proud of our perseverance and will to work on this project over a weekend and in the end build a real, working product that we can ship. We were able to find, cleanse, and put together scattered public records for over 1600 data centers in the United States. We learned Tiger Data from scratch and used it to build a Project Time Machine which replays the evidence build weekly. We also were able to successfully use three different AI tools: Gemini for the chatbot, Grok Voice for verbal search, Grok Imagine for labeled illustrations of each construction stage. This allows us to serve data for our users in an understandable and easy to navigate manner.
The thing we are most proud of is the lack of ambiguity within our project. Every single number on the site is linked back to record it came from, missing data shows as "Unavailable" instead of estimating a random number or giving a zero. I believe something to be proud of is the fact that we built something that in the end could make a difference benefiting residents, small businesses, and policymakers understand the AI energy boom.
What we learned
We learned that data isn't always perfect and usable. We would have to adapt our model and data collection and find ways to translate it into actual metrics. We also learned about TigerData, and useful it is for visualization and storing large datasets.
Moreover, we learned how difficult it is to compare infrastructure data across jurisdictions. Creating a national view requires preserving local differences, which could include a lack of public data available.
Finally, we are a group of freshmen with minimum amounts of hackathon. We downloaded Github Desktop, collaborated with complete strangers, and designed architecture that hosts vast amounts of information. In trying out new things and taking challenges, the journey in finishing a project itself taught us even more than the technical skills we learned.
What's next for Uncloak
We plan to add community engagement features. This includes being able to share Uncloak data-center profiles online and being able to participate through forums to discuss local data centers. We want to expand deeper public-record coverage across more states and add records related to tax incentives, and public infrastructure spending. We also want to be able to gather data to better quantify the effect of local data centers on billing costs and water use.
Our long-term goal is for Uncloak to become an independent public record of American data-center development, an open database that improves transparency in the world of AI.
Built With
- framer-motion
- gemini-api
- grok-voice
- httpx
- leaflet.js
- maplibre-gl
- next.js
- openfreemap
- openpyxl
- openstreetmap
- pandas
- postgresql
- psycopg
- python
- radix-ui
- react
- react-leaflet
- recharts
- tailwind-css
- tiger-data
- timescaledb
- typescript
- u.s.-census-geocoder
- vercel
- xai-api


Log in or sign up for Devpost to join the conversation.