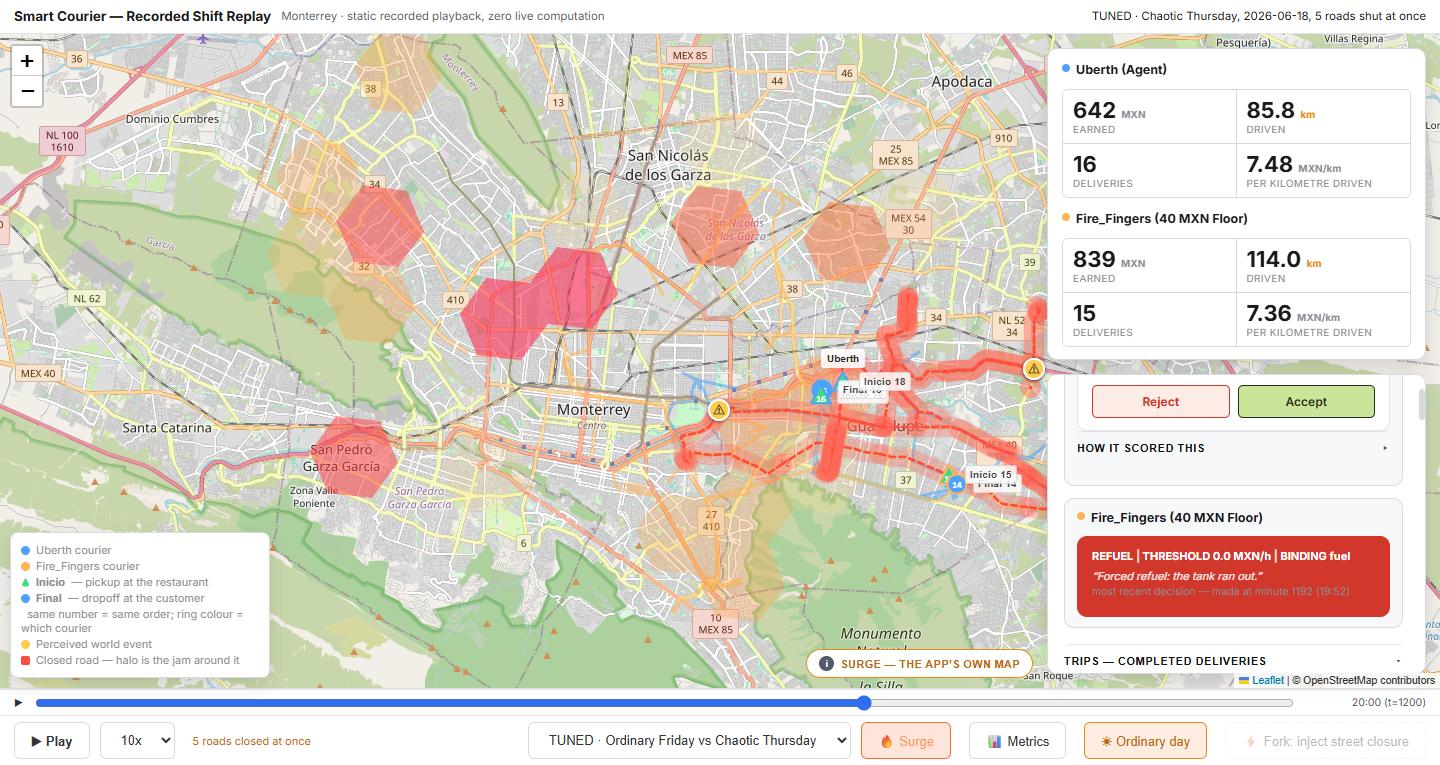
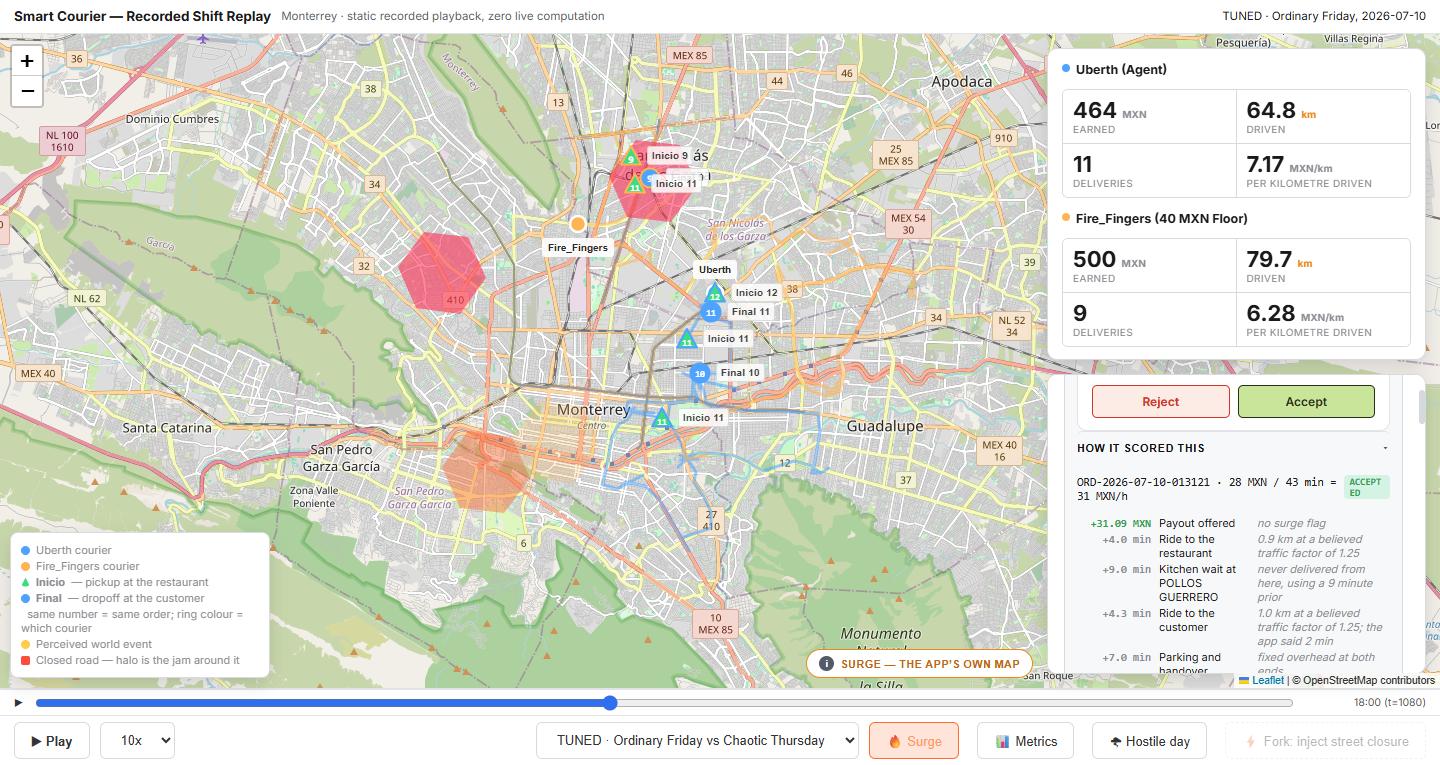
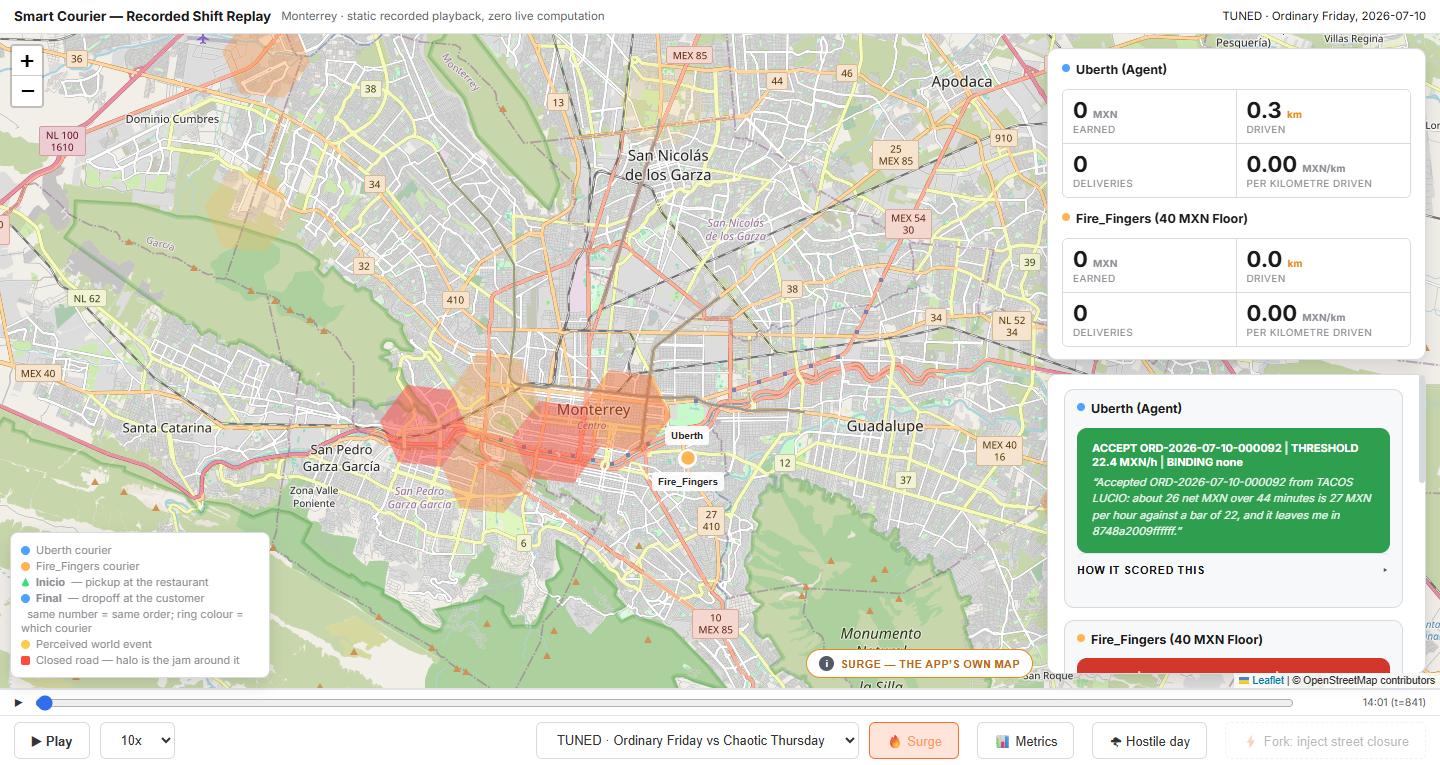
How we built Uberth, what the road corrected, and where we stand.
Every figure here comes from a measured run. Where a number comes from a single seed or a single shift, it says so.
The question we started with
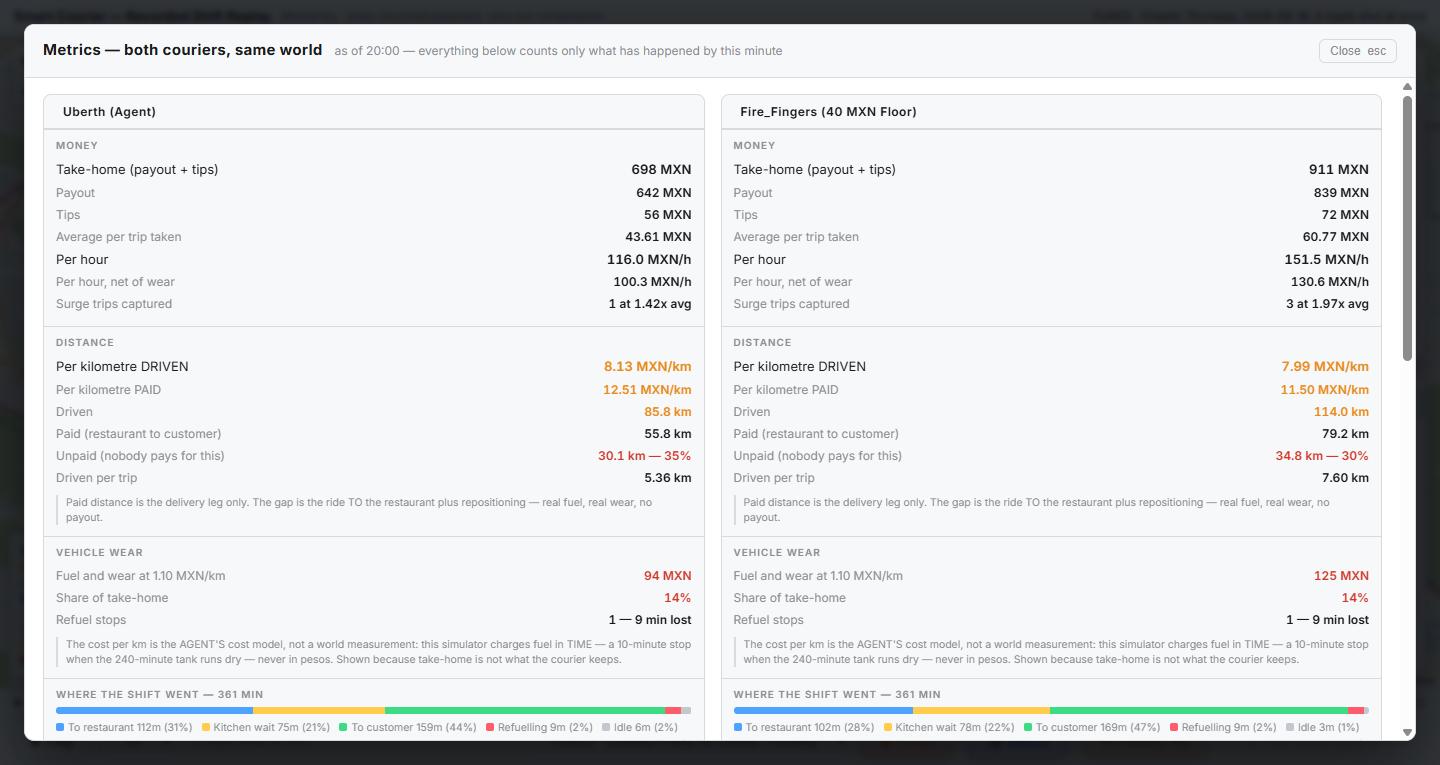
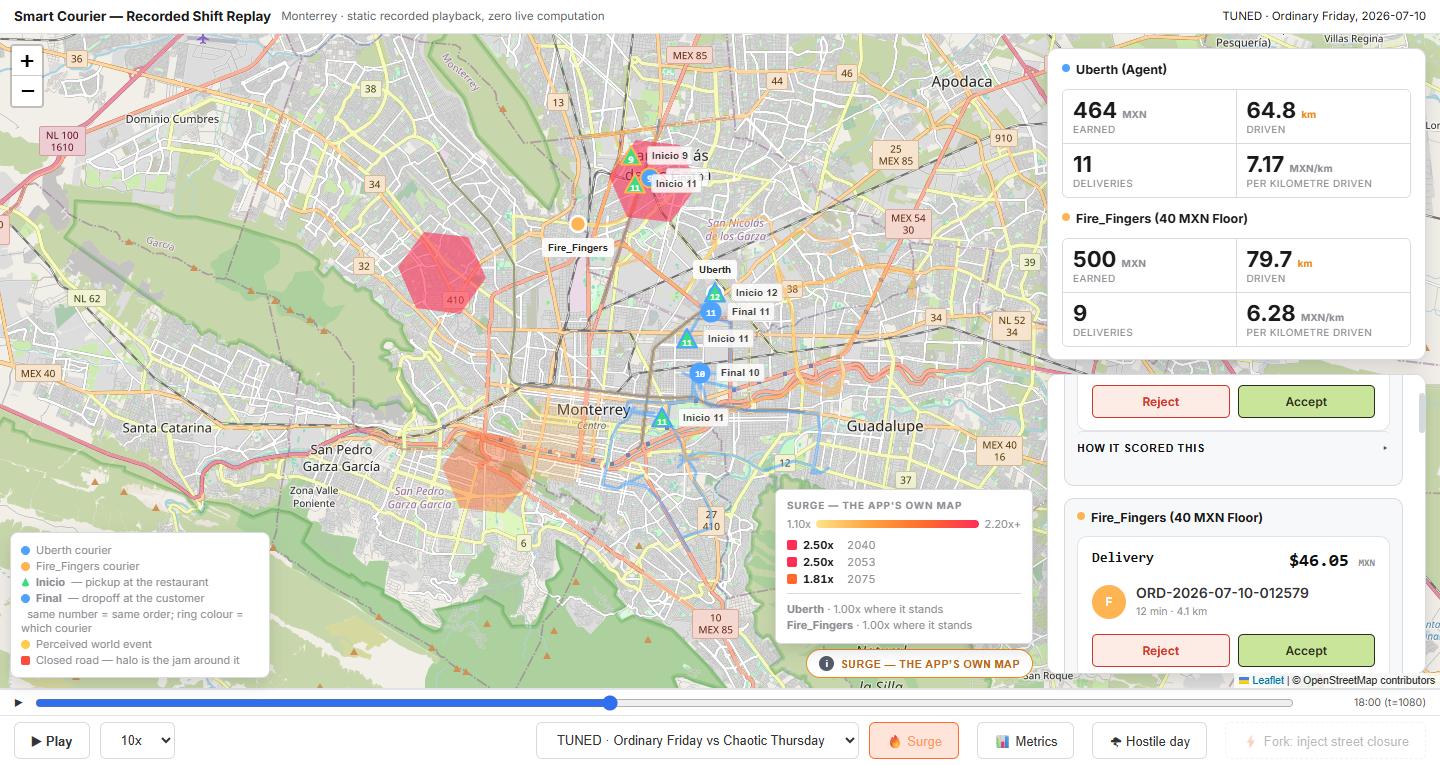
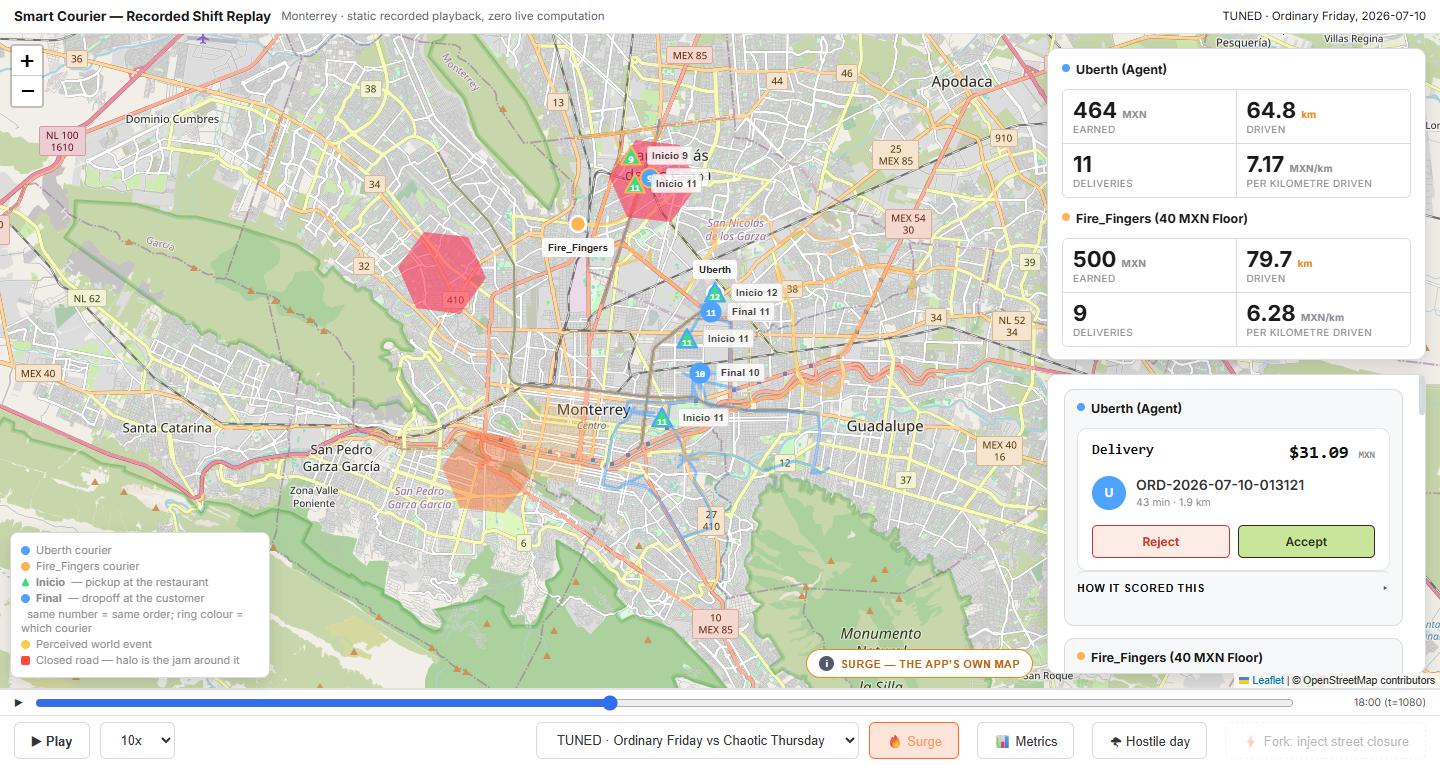
The app shows a courier six fields: point A, point B, the payout, an ETA, the distance, and a flag saying whether surge is on — never how much. They have seven seconds to decide.
None of those six tells them the only thing that matters: what you will earn per hour, net of the kilometres nobody pays you for.
That is the seventh field. The app will never show it, because the app prices the delivery for the customer, not for the driver. So we compute it ourselves.
We built two systems, not one
We made this call before writing a line, and everything else hangs off it.
We did not build "a system with an agent inside". We built two independent systems, each with its own information kit, and a boundary that is not crossed.
The world may use anything, including data that exists only in Mexico: the DENUE business census, INEGI population by block, TomTom traffic probes. It is Monterrey and it is entitled to be Mexican.
Uberth may not. It consumes only what you can get from a pair of coordinates and a phone screen: the app, OpenStreetMap, and its own memory of what happened to it.
DENUE is Mexico. OpenStreetMap is the planet. An agent that learns to depend on a Mexican dataset is not a product, it is a demo.
And we did not leave that to discipline. 16 tests scan the agent's code for any city-specific identifier and fail the suite if one appears. We tested them by planting violations on purpose, because a test you have never watched fail proves nothing. They caught us: someone wrote "Monterrey" in a comment inside the agent. The rule turned out to be stricter than the team that wrote it.
The world, and what it taught us
None of what sits underneath was chosen by us:
| layer | real data |
|---|---|
| roads | OpenStreetMap — 95,429 nodes, 242,223 edges |
| venues | DENUE / INEGI — 12,943 restaurants |
| destinations | INEGI population by block — 2,330,207 people |
| traffic | TomTom Traffic Stats, Monterrey's own measured hourly curve |
| weather | Open-Meteo historical archive, real dates |
| geography | H3 resolution-7 grid — 127 cells |
And the data corrected us before reality could.
We had assumed the shape of the daily traffic curve transfers between Mexican metropolitan areas — same meal hours, same working hours. The measured series said otherwise: Monterrey peaks at midday and has none of the mid-afternoon trough the centre of the country has. We had it backwards, and the data won.
The four calibrations
One of us drives. He looked at the simulator's figures and said they did not add up. That conversation set off four corrections in a chain, each one hidden behind the one before it.
We were calibrating against the wrong number
We tuned so a whole shift landed in a plausible range — and it did, at 88 MXN a trip and 1.2 deliveries an hour. A total can be hit by two errors that cancel. Only a per-trip figure exposes that, and looking at it took someone who had done the job.
The offer radius assumed an idle courier
We offered orders when the courier was near the restaurant right now, but nobody mid-delivery can act on "right now". Taken on the spot: 0.70 km. Queued behind work: 5.61.
We were charging a motorcycle for car traffic
TomTom probes are cars, and a delivery motorcycle filters between lanes. A jam does not cost it the same.
And underneath those three, the one they were hiding
With the cycle finally short, the courier spent 310 of 500 minutes with an empty screen. We had built a city with no work in it.
We also learned something about fare cards we would not have reasoned out on our own: when a courier says "the normal ones pay 30 to 40", they are not describing a slope. They are describing the same price repeated. That is a minimum fare, and no smooth curve imitates it. Three attempts failed before we understood that.
The rules we gave Uberth
This is the product. Uberth does not receive conclusions — it runs its own analysis over eleven factors and these rules.
A reservation price, not a threshold
The bar is not a number somebody picked. It is what refusing this offer and waiting for the next one is worth, computed from the arrival rate and the shift remaining. It is the one non-trivial piece of the agent.
A confidence discount
Every estimate carries a value, a confidence and an age, and the final score is discounted by the aggregate confidence behind it. The consequence is the point: the first shift in an unknown city is careful, not reckless, and loosens as it accumulates its own evidence. That is the difference between an agent that exports and one that gambles.
Per-zone ETA bias
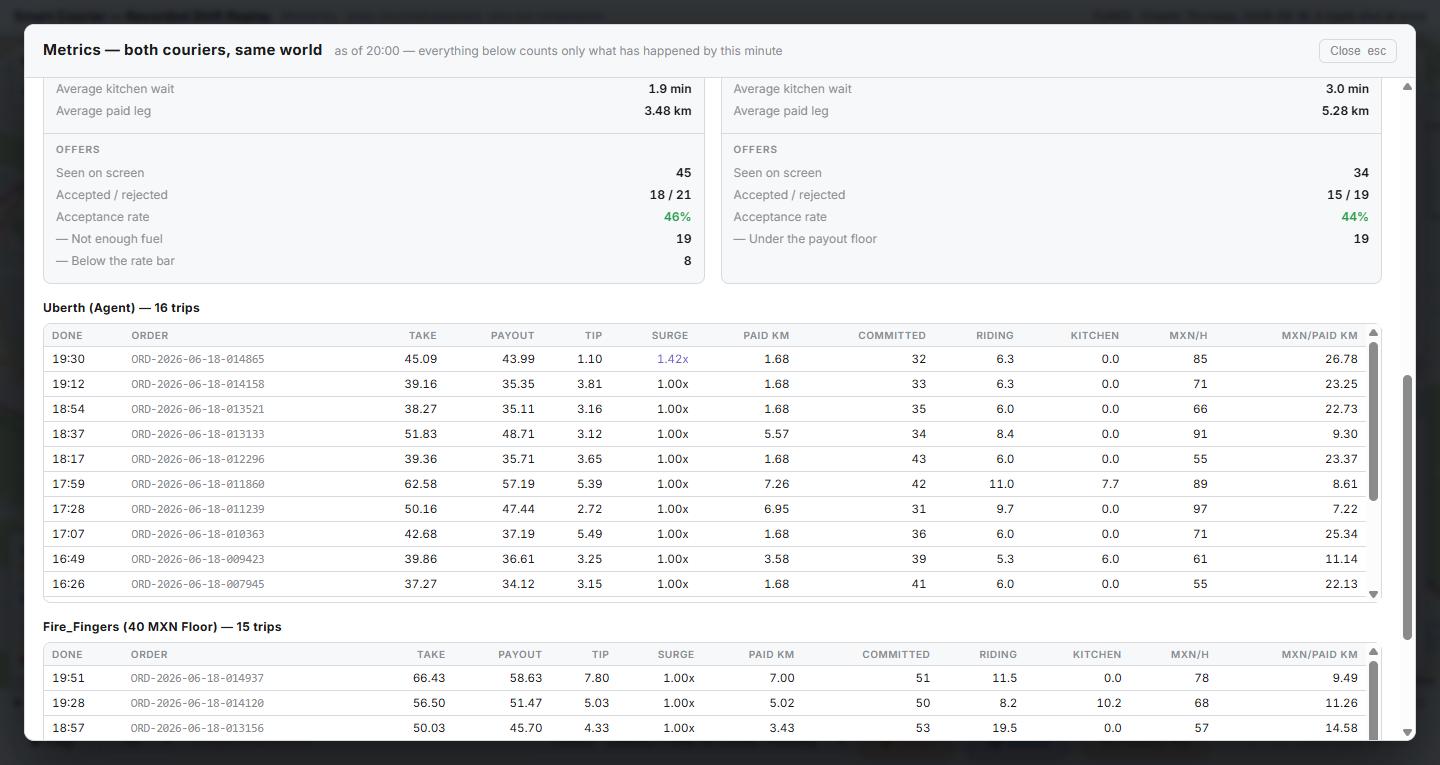
The cleanest arbitrage there is, and it needs no external source: compare what the app promised against what actually happened. After a hundred trips it knows how much it is being under-promised, and by zone.
Per-branch kitchen memory
How long that branch takes, not the industry average. With no data it uses a 9-minute prior and declares it.
Destination quality
A well-paid order that strands you in a residential desert costs an unpaid ride back. It is computed from venue density in the drop-off cell, and it flips rankings immediately.
Weather as a ramp, not a switch
Rain and heat enter continuously from 32 to 42 °C: 38 and 44 degrees are not the same shift.
End-of-shift geometry
Nobody works until the world runs out. There is a clock-off time and a home to get back to, and the kilometres home are paid by no one.
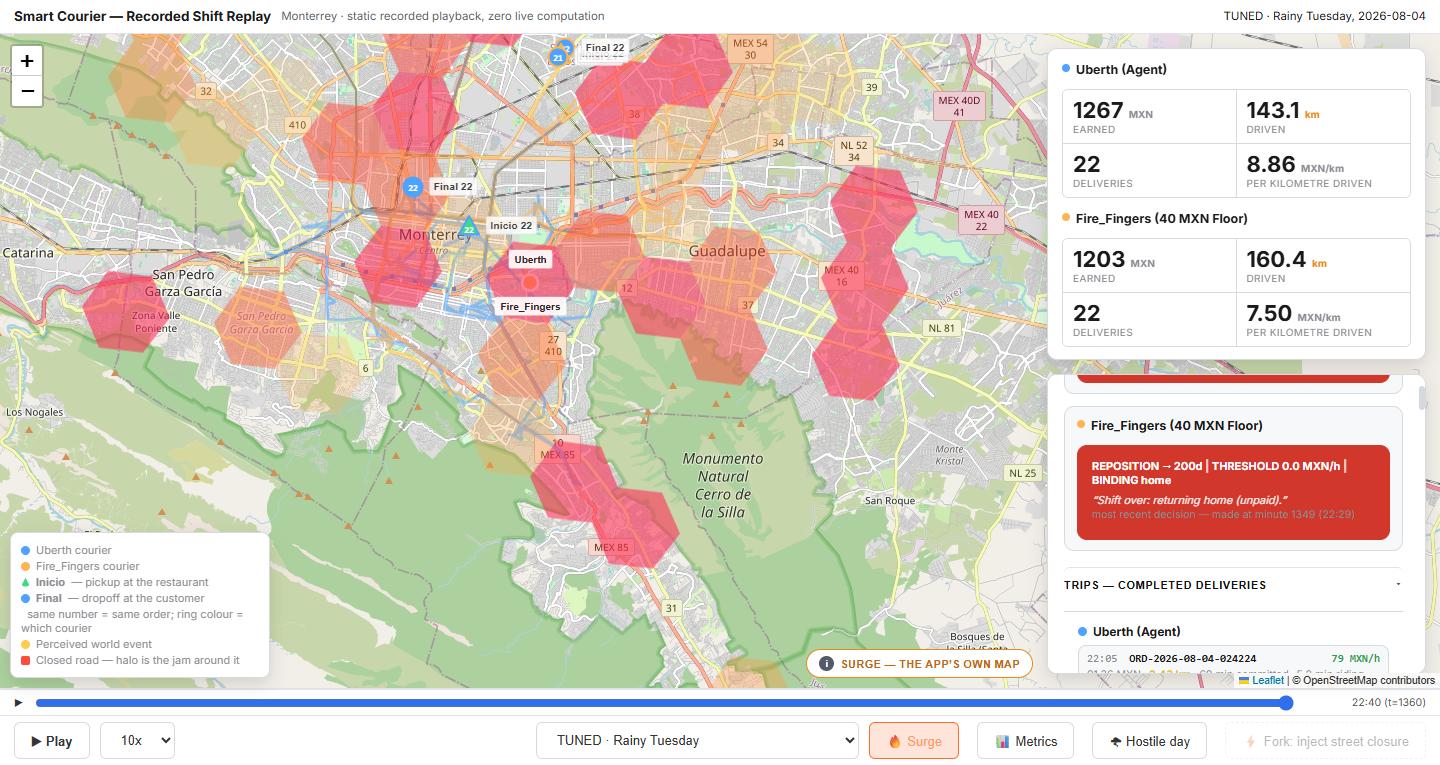
This factor weighs more than it looks. Measured over one shift: of 39 rejections, 22 are end-of-shift geometry and only 13 are the bar being demanding. Anyone looking at the dashboard thinking "it rejects too much" is misreading most of those rejections.
Flexible idle from evidence, not impatience
The obvious move was a cap — "after N minutes, take anything" — but that is arbitrary. What we built is a Bayesian correction: an empty screen for twenty minutes is evidence against the arrival rate the agent believed. The bar comes down on its own, monotonically, with a floor so it never justifies working at a loss.
The configurations that improved it
Once the world was corrected, Uberth's constants were fitted to a world that turned out to be an artefact. We swept hundreds of configurations in parallel, with search seeds and hold-out seeds the search never saw.
Three dials moved the result.
1. The motorcycle-filtering belief
We had fixed the world so the motorcycle filters through traffic and never told the agent: it kept pricing every leg at the full car multiplier, believing it rode at 8.7 km/h when the world moved it at 31.8. Every trip looked ruinous per hour, and the long well-paid ones looked worst of all — so it specialised in short, cheap work.
We put it in the search as a variable, without telling it the right answer:
| belief | vs. the fixed rule | worst case |
|---|---|---|
| 1.00 (as shipped) | 98.4% | 44.3% |
| 0.40 | 95.7% | 66.4% |
| 0.15 | 100.6% | 78.3% |
The search walked to 0.15 — exactly the constant the world already used. Nobody told it. And it is not only the mean: the worst scenario improves from 44% to 78%.
2. Acceptance flexibility
The bar is provably incomplete: it knows what waiting costs, but not that rejecting a lot makes the app show you fewer offers. So we gave it permission to accept below its own bar:
| flexibility | vs. the fixed rule | accepts |
|---|---|---|
| 1.10 (fussier) | 68.0% | 16.4% |
| 1.00 | 75.4% | 18.3% |
| 0.78 | 94.2% | 22.5% |
| 0.30 | 96.6% | 29.9% |
3. Risk aversion came down
From 0.35 to 0.10: charging itself too much for night and heat exposure made it timid without compensation.
And two dead dials
The idle time before repositioning and the opportunity cost per minute returned identical results across their whole range. Uberth is idle 11 of 480 minutes: the repositioning branch never fires. Knowing that is worth as much as an improvement.
How it stands against the one-line rule
The opponent is honest and it is hard: accept anything paying more than 40 MXN. No model, no memory, no weather. In a world where the payout is the only reliable signal, that rule is far better than it sounds.
| vs. the fixed rule | days won | acceptance | |
|---|---|---|---|
| before tuning | 79.0% | 4 of 26 | 17.8% |
| after | 97.8% | 10 of 26 | 25.6% |
And across the six scenarios we recorded:
| scenario | Uberth vs. the rule |
|---|---|
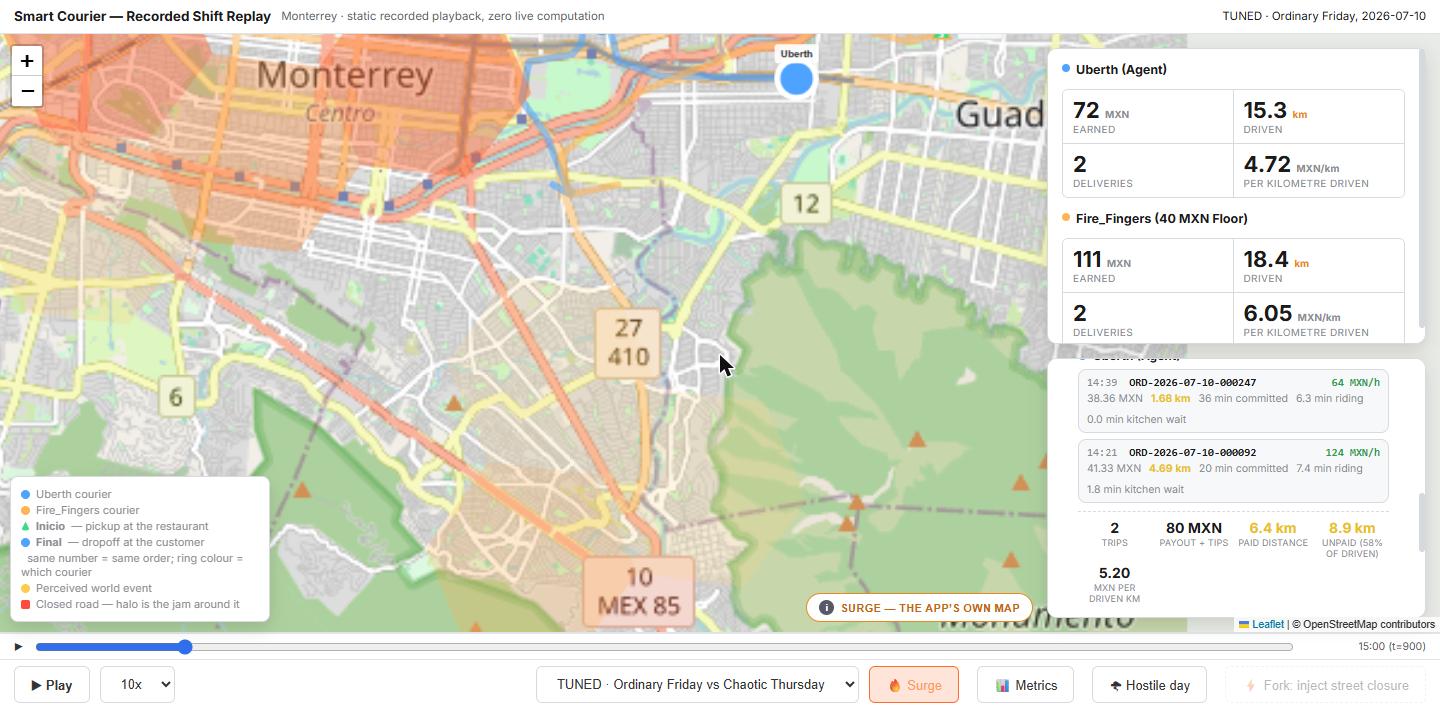
| Ordinary Friday, clean | 79.4% |
| Chaotic Thursday, 5 closures | 95.8% |
| Mild Wednesday, clean | 125.3% |
| Mild Wednesday, 5 closures | 114.5% |
| Rainy Tuesday, clean | 110.9% |
| Rainy Tuesday, 5 closures | 104.3% |
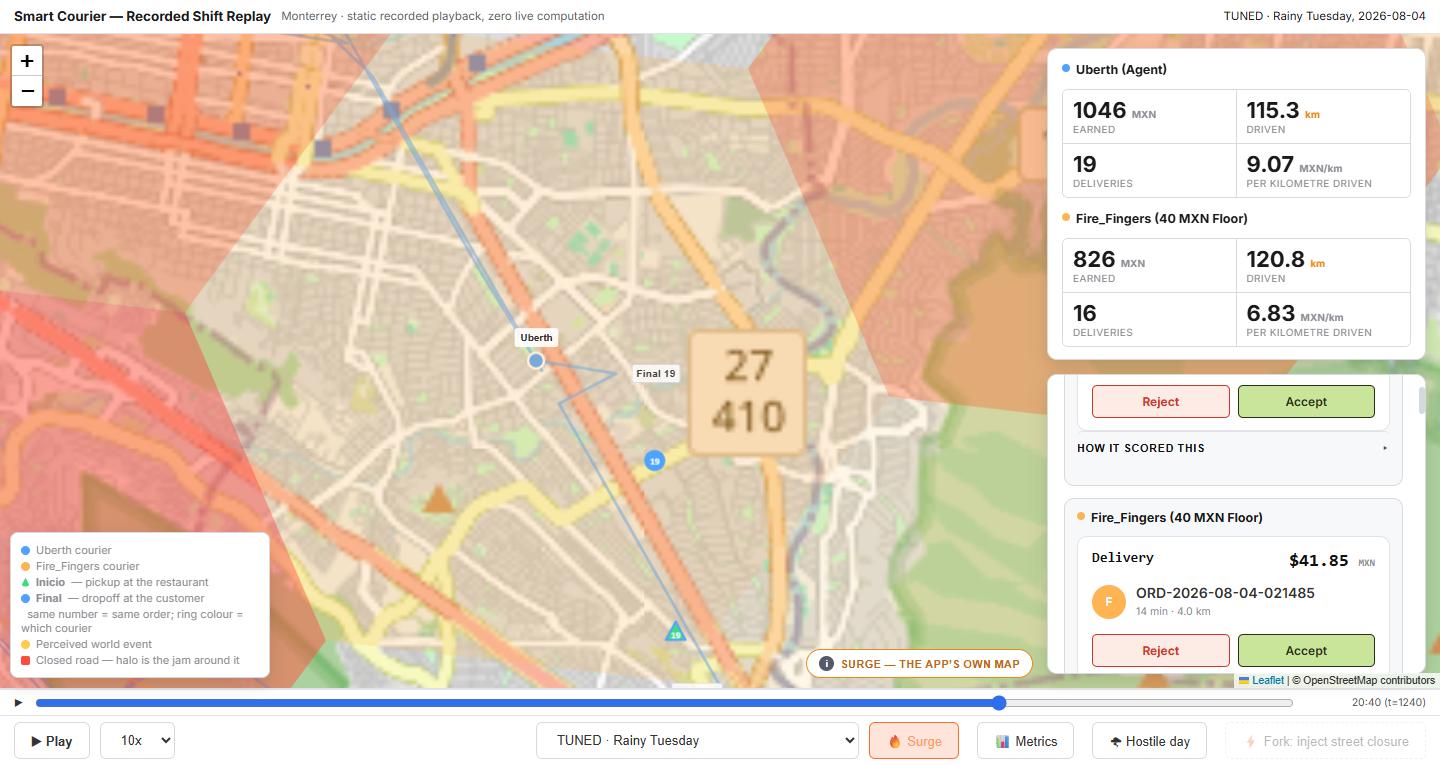
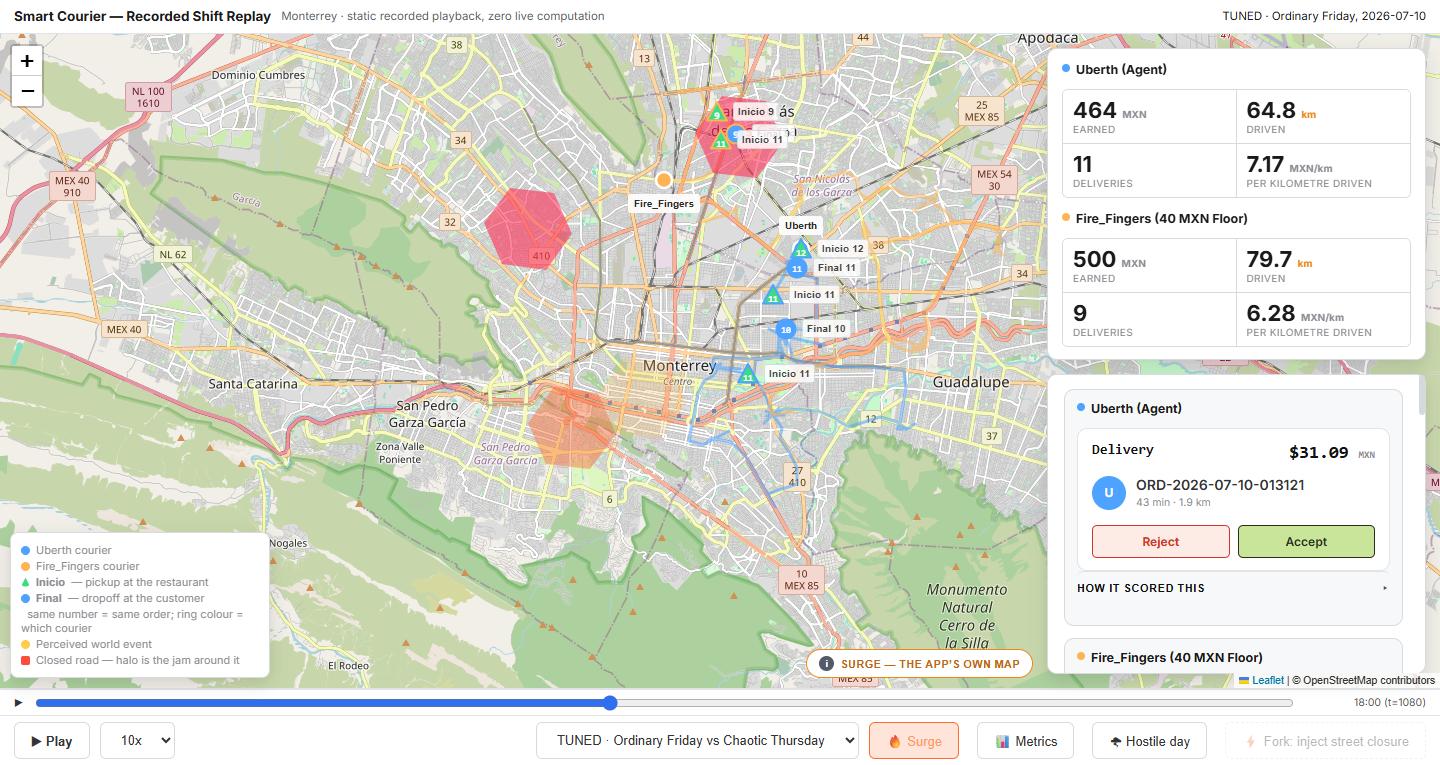
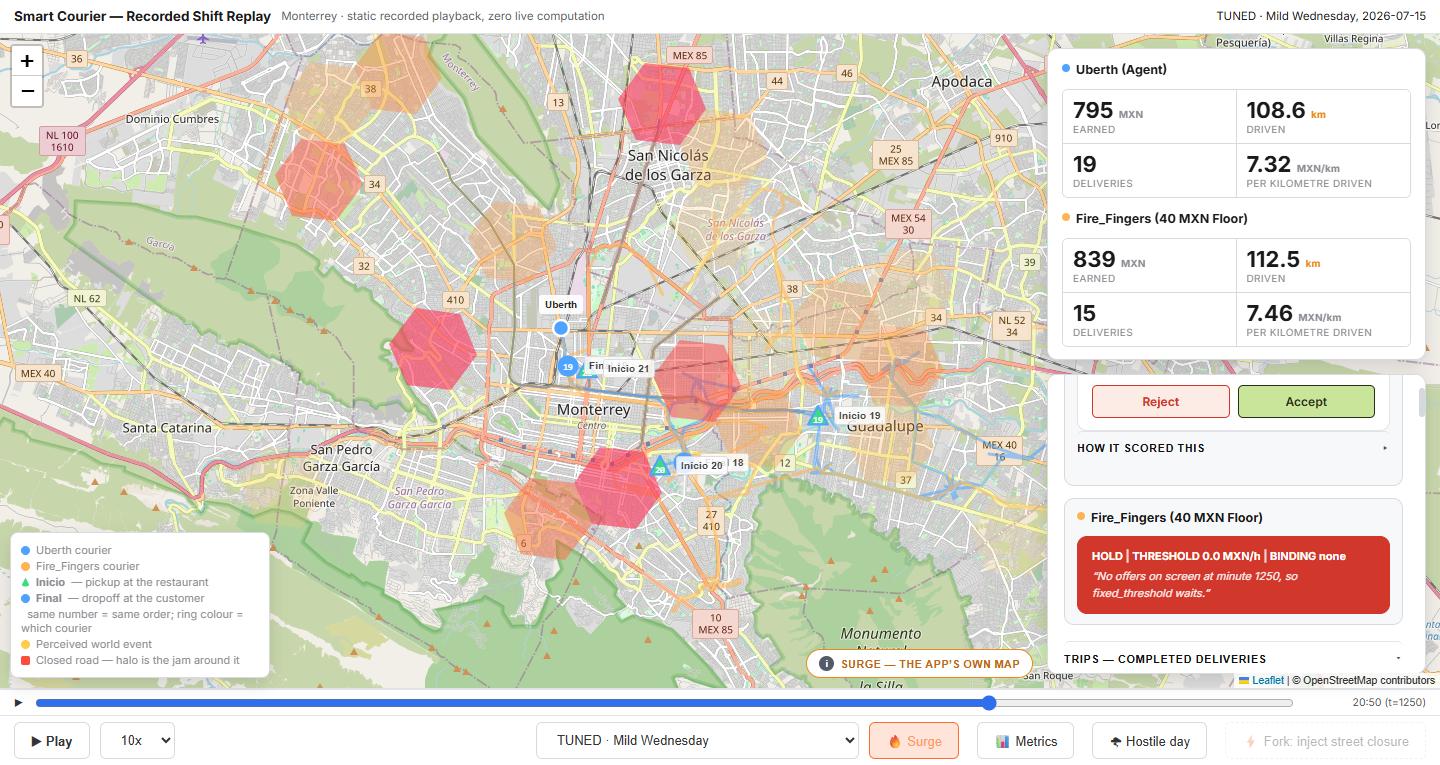
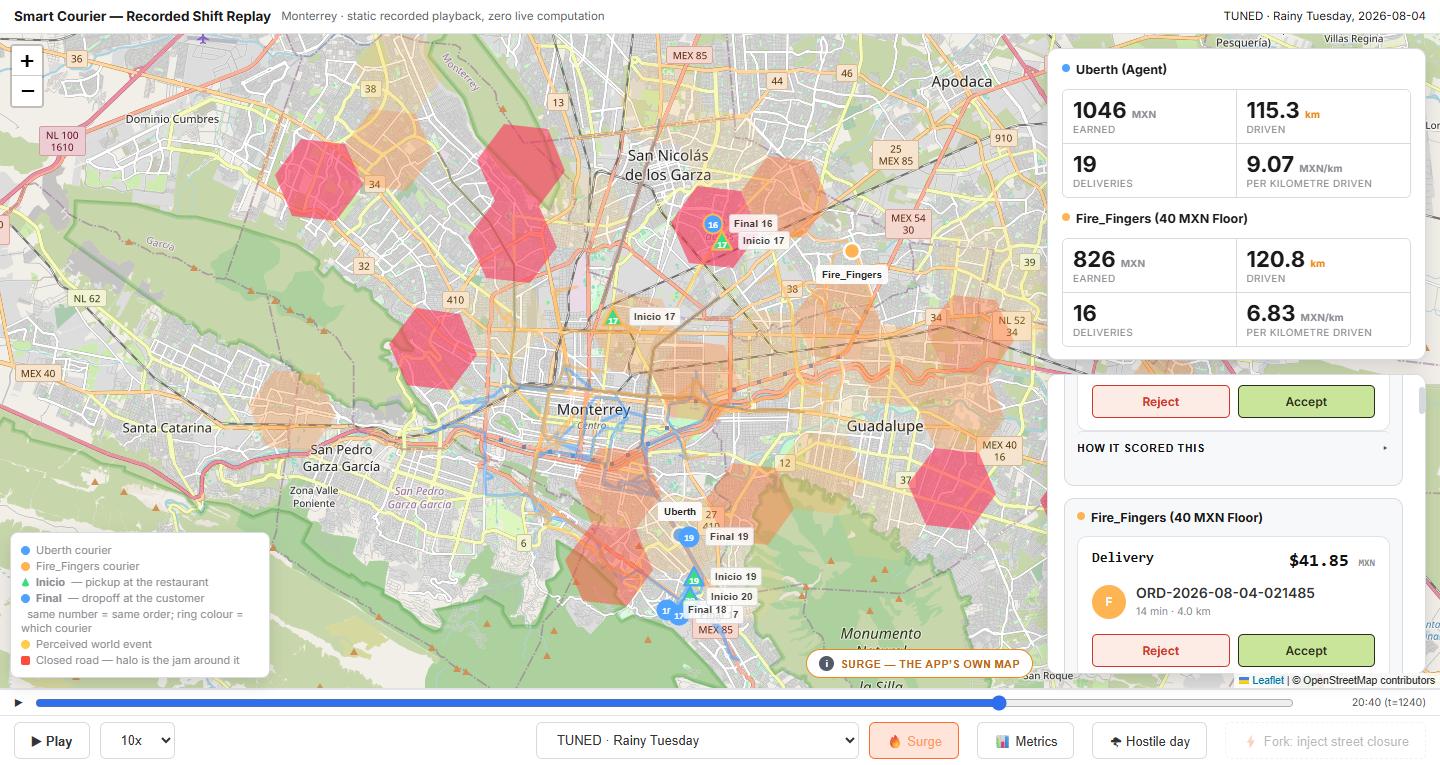
On MXN per kilometre driven — the number that matters to a courier, because the kilometres are theirs — Uberth wins all six. 7.17 against 6.28. 8.33 against 7.22. 9.48 against 8.05.
On the overall average it is still two per cent behind, and saying so out loud is what makes everything above it credible. We also know exactly why.
Why those two per cent, and why it is a finding
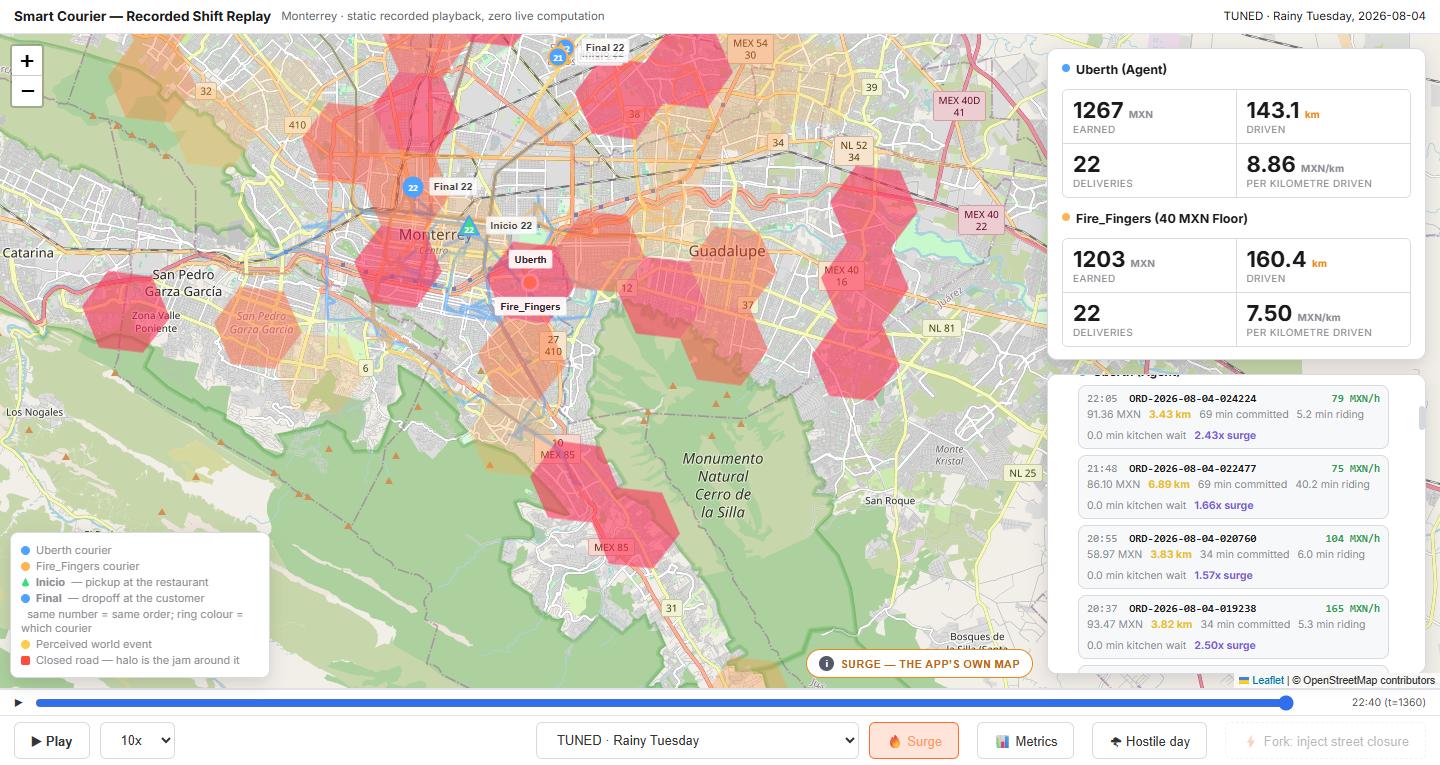
Offer quality spreads 2.88x between the best and the worst. But the thing that decides it is kitchen wait — which varies four-fold and has no relationship with distance at all, a correlation of 0.003 — and that is not on the card before you accept.
When the only reliable signal is the payout, a threshold on the payout is close to optimal. Uberth is not losing because it cannot think. It is losing because the information that decides a trip is hidden at the moment of deciding.
That is the finding, and it is the product argument: the seventh field cannot be computed perfectly because the app does not show what it would take. Uberth reaches 97.8% on what is visible. The rest is on the other side of the glass.
And all of it in 0.86 milliseconds
Uberth decides in 0.86 ms. DiDi's window is seven thousand. A full eight-hour shift — 497 decisions — runs in under half a second.
There is no language model connected. The sentences on the dashboard are the same numbers that already decided, printed. Delete every word of that text and Uberth makes exactly the same choices.
The simulator is Monterrey. Uberth is from nowhere.
Six fields in the app. It computes the seventh.
Built With
- coolify
- css
- docker
- geopandas
- github
- h3
- html
- javascript
- leaflet.js
- networkx
- nginx
- numpy
- open-meteo
- openstreetmap
- osmnx
- pandas
- pyarrow
- pydantic
- pyproj
- pytest
- python
- requests
- scipy
- shapely
- tomtom-api

Log in or sign up for Devpost to join the conversation.