-
-
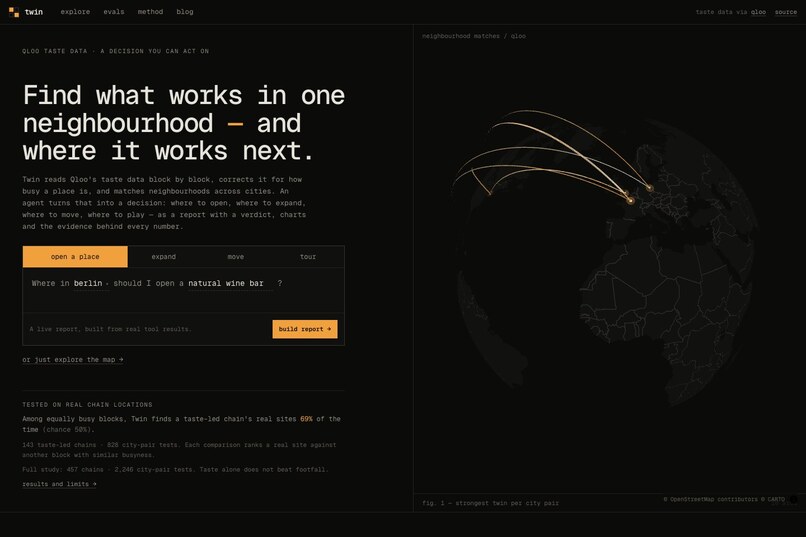
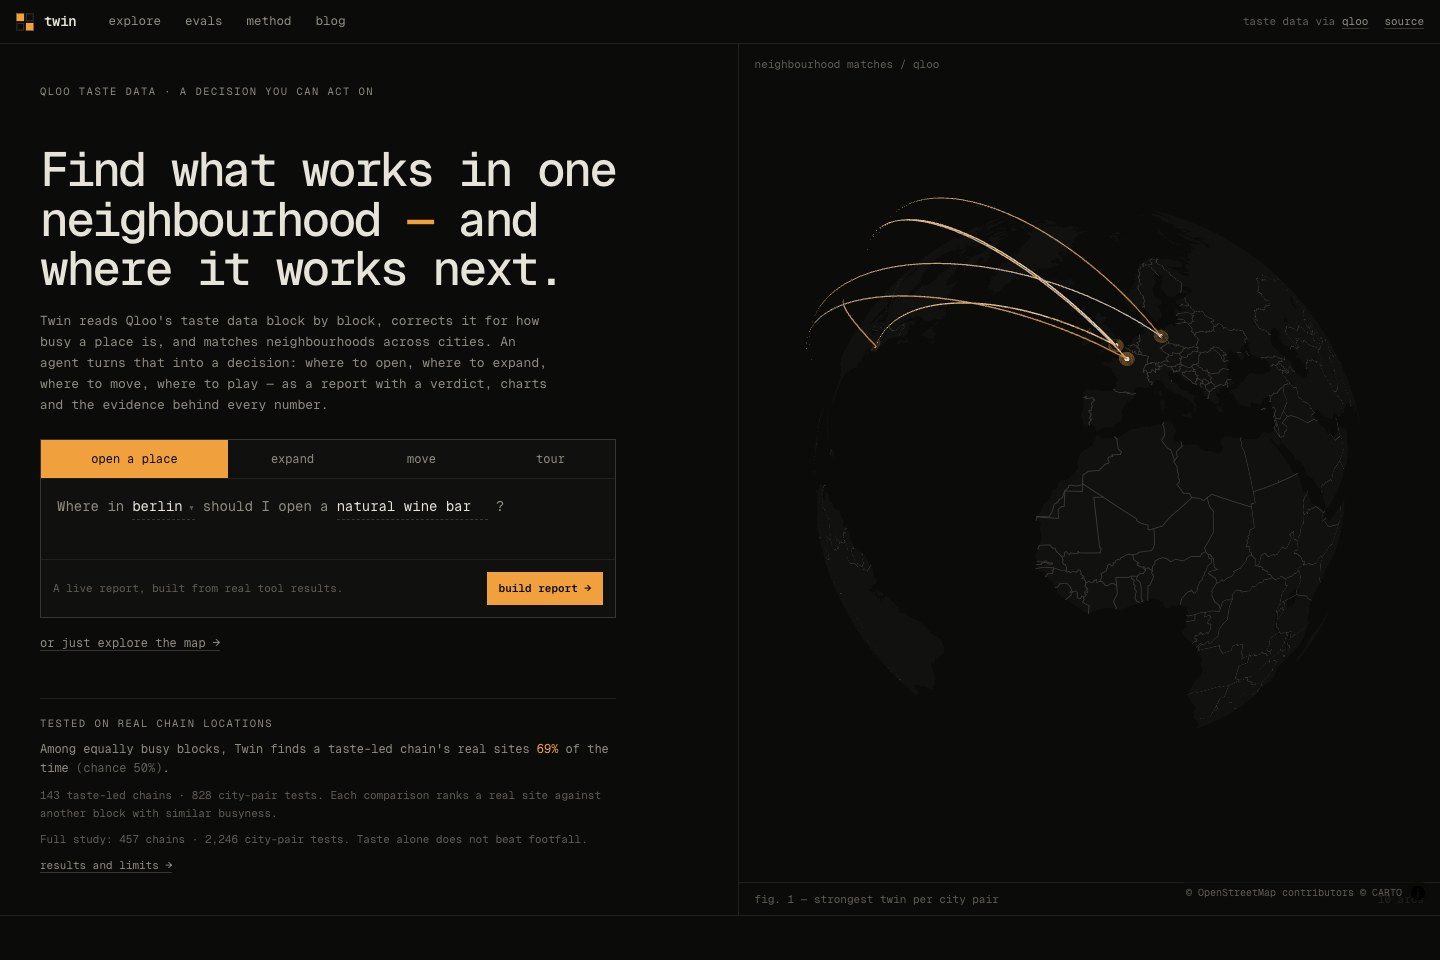
Pick a job — open a place, expand, move, tour — and Twin writes the decision from Qloo taste data.
-
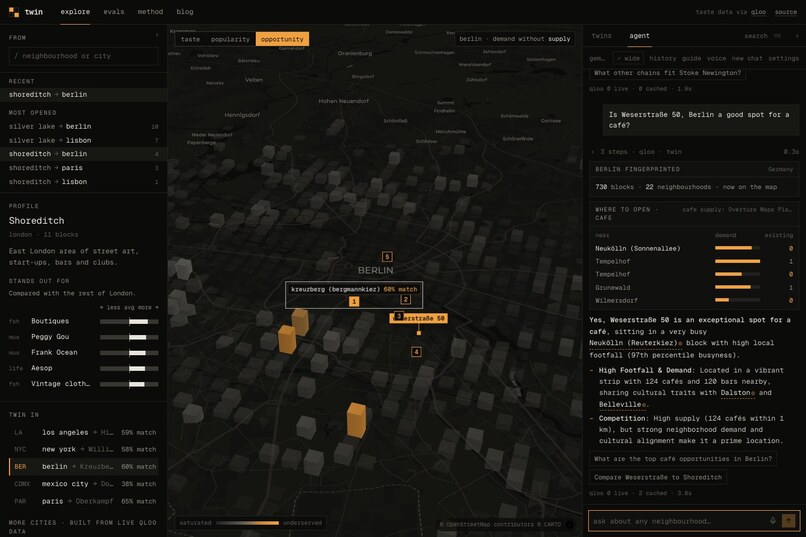
Demand and competition charts. Every number in a chart or headline is checked against the data the tools returned.
-
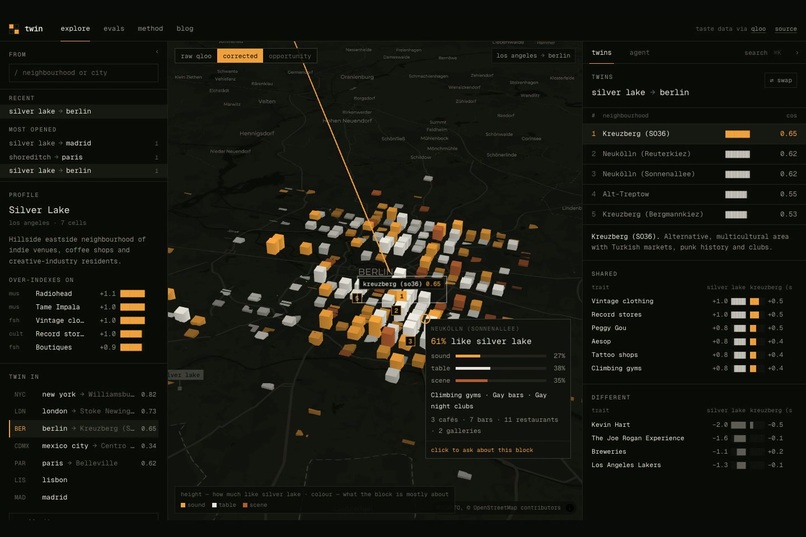
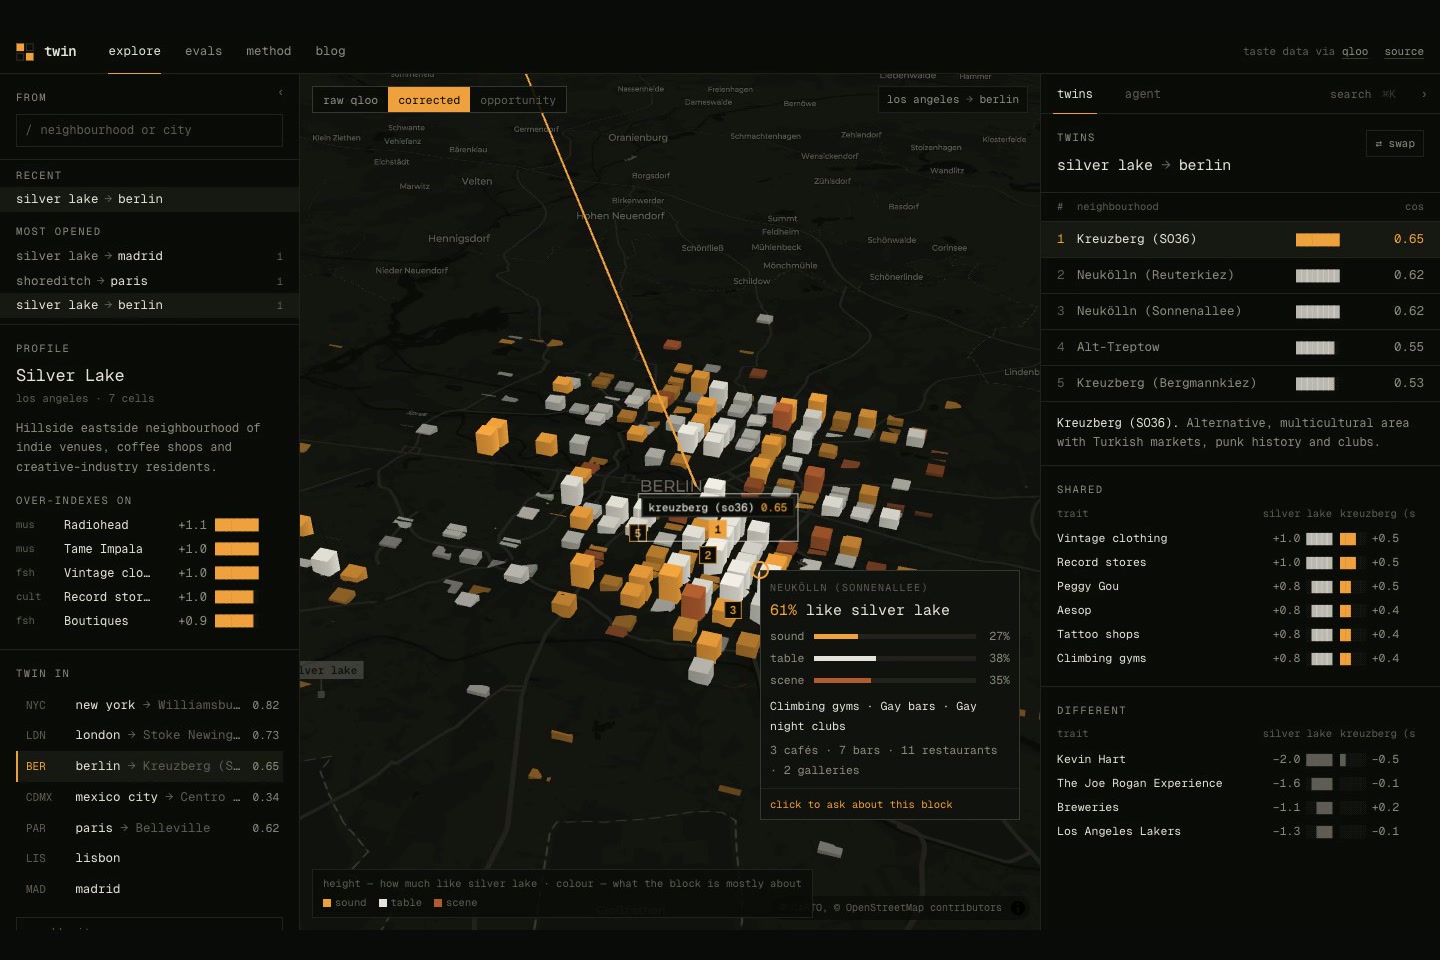
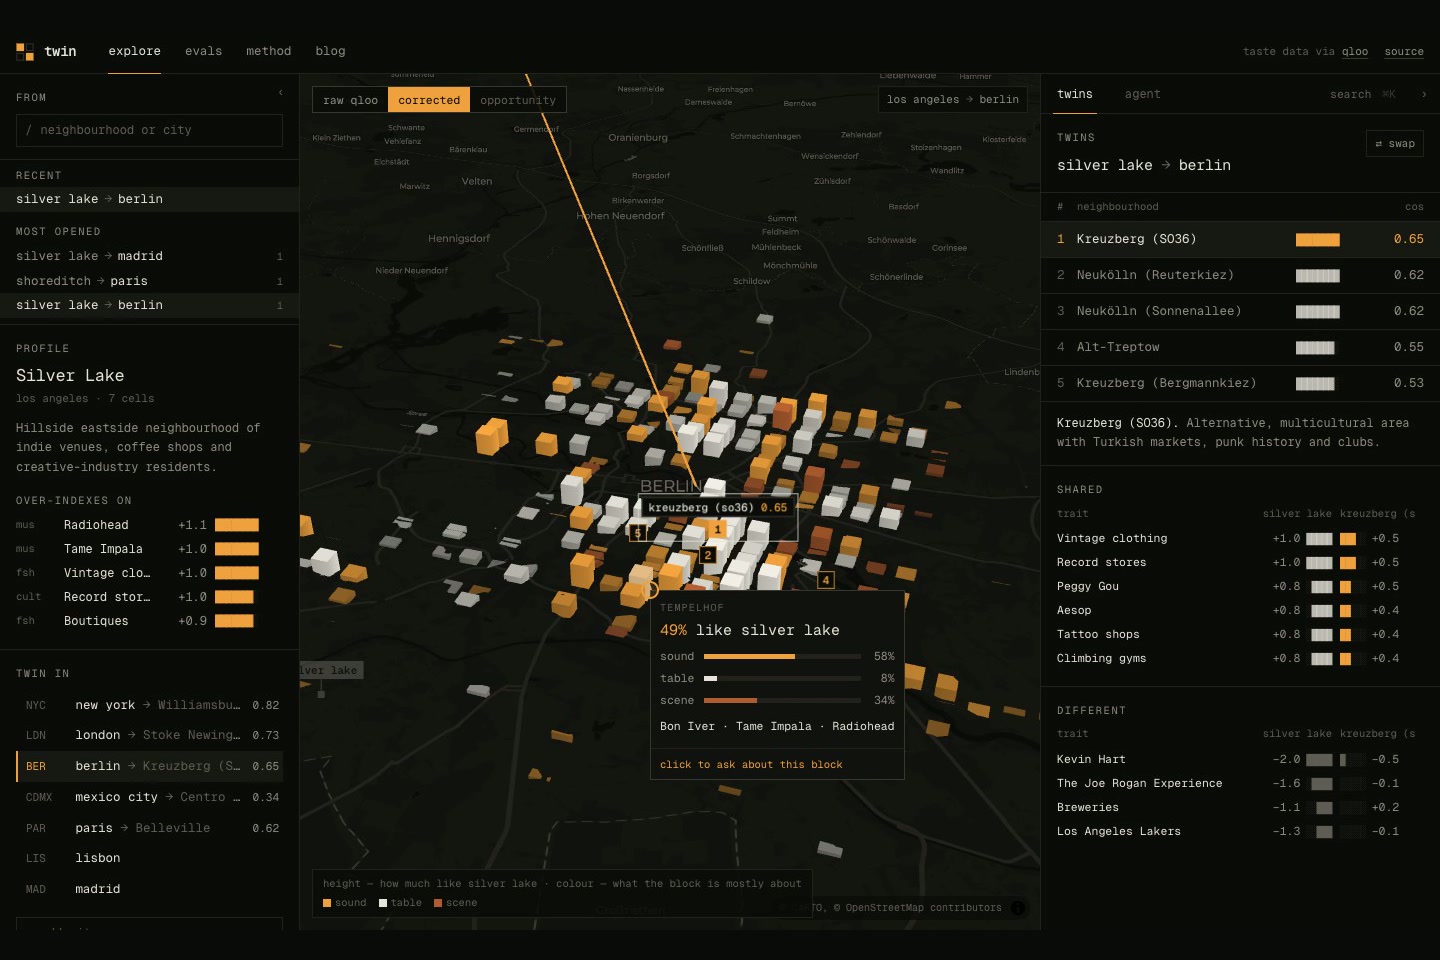
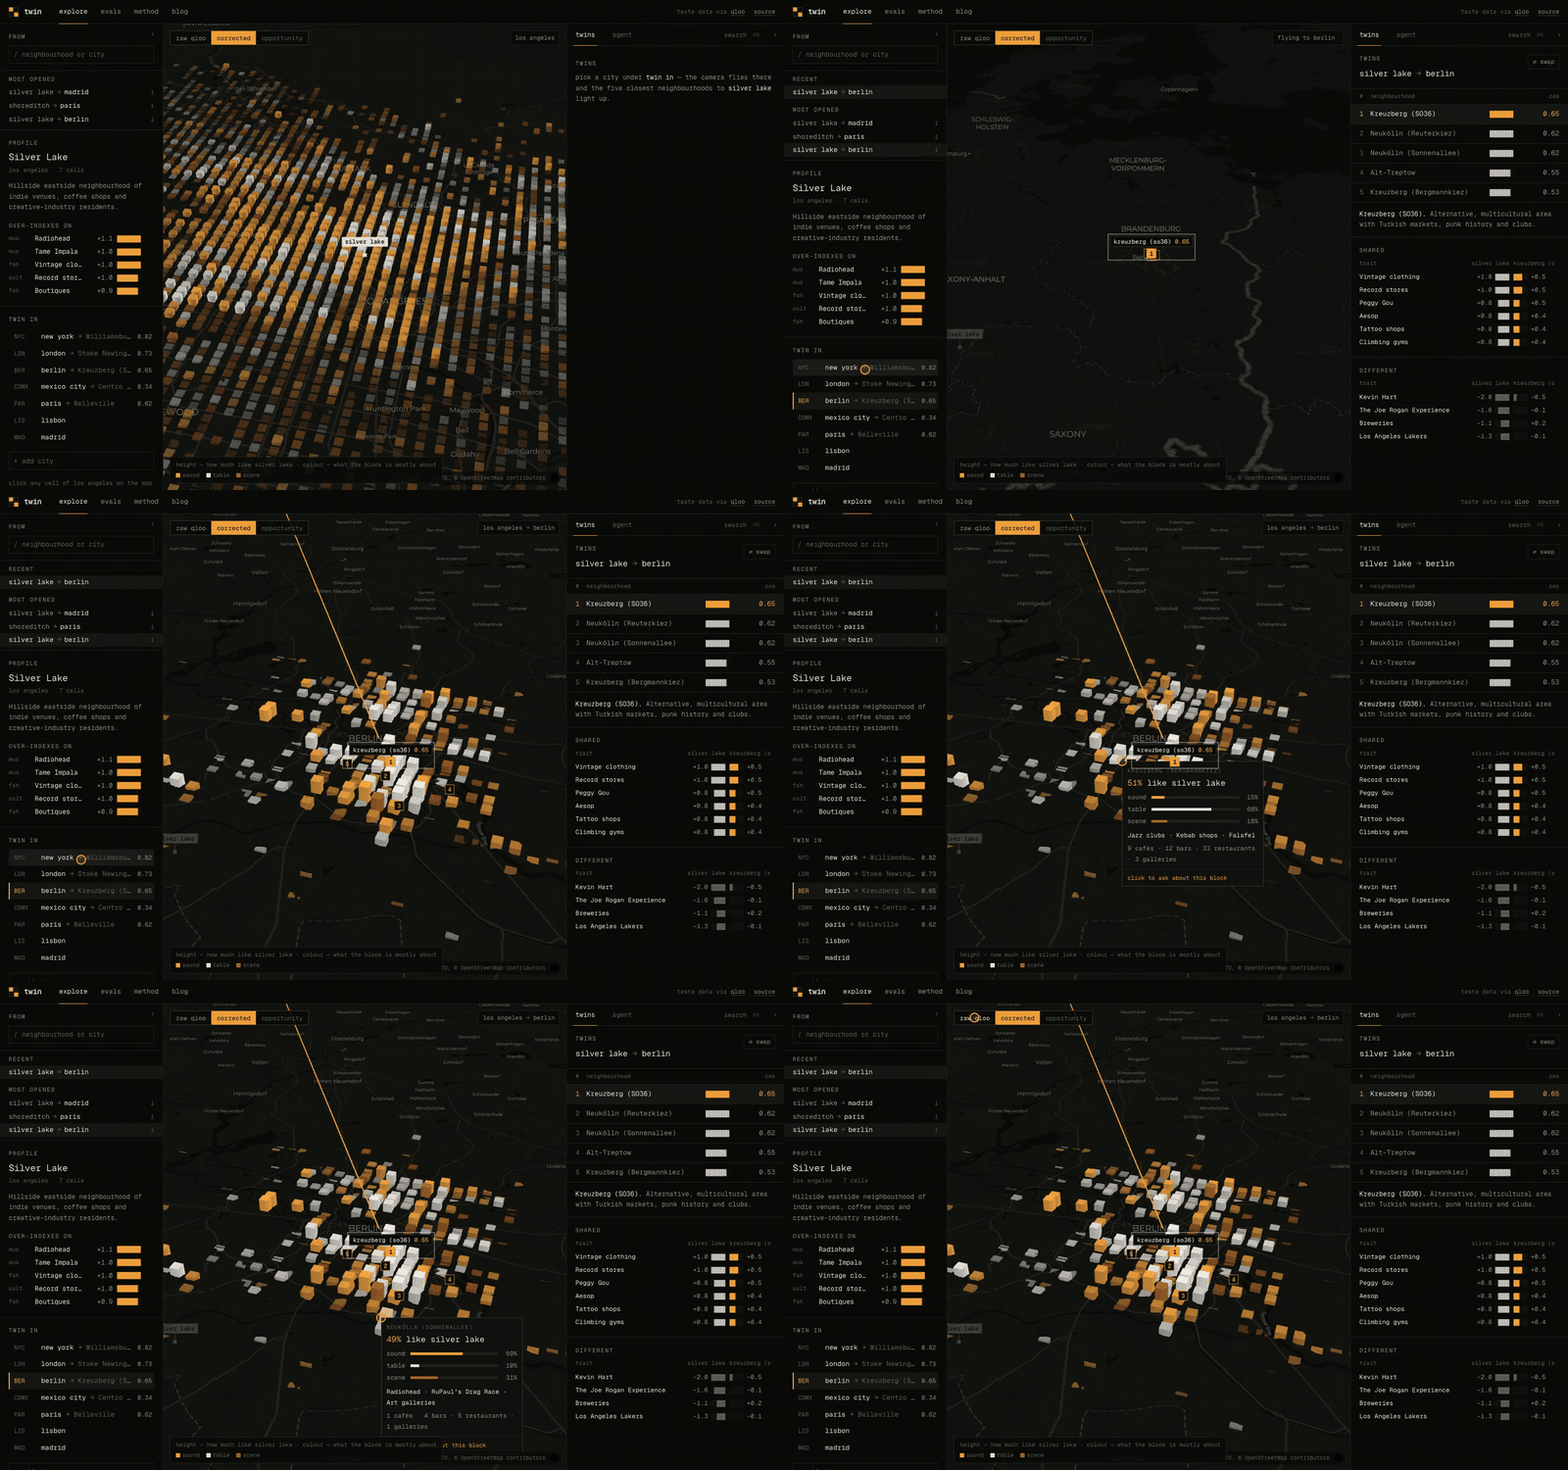
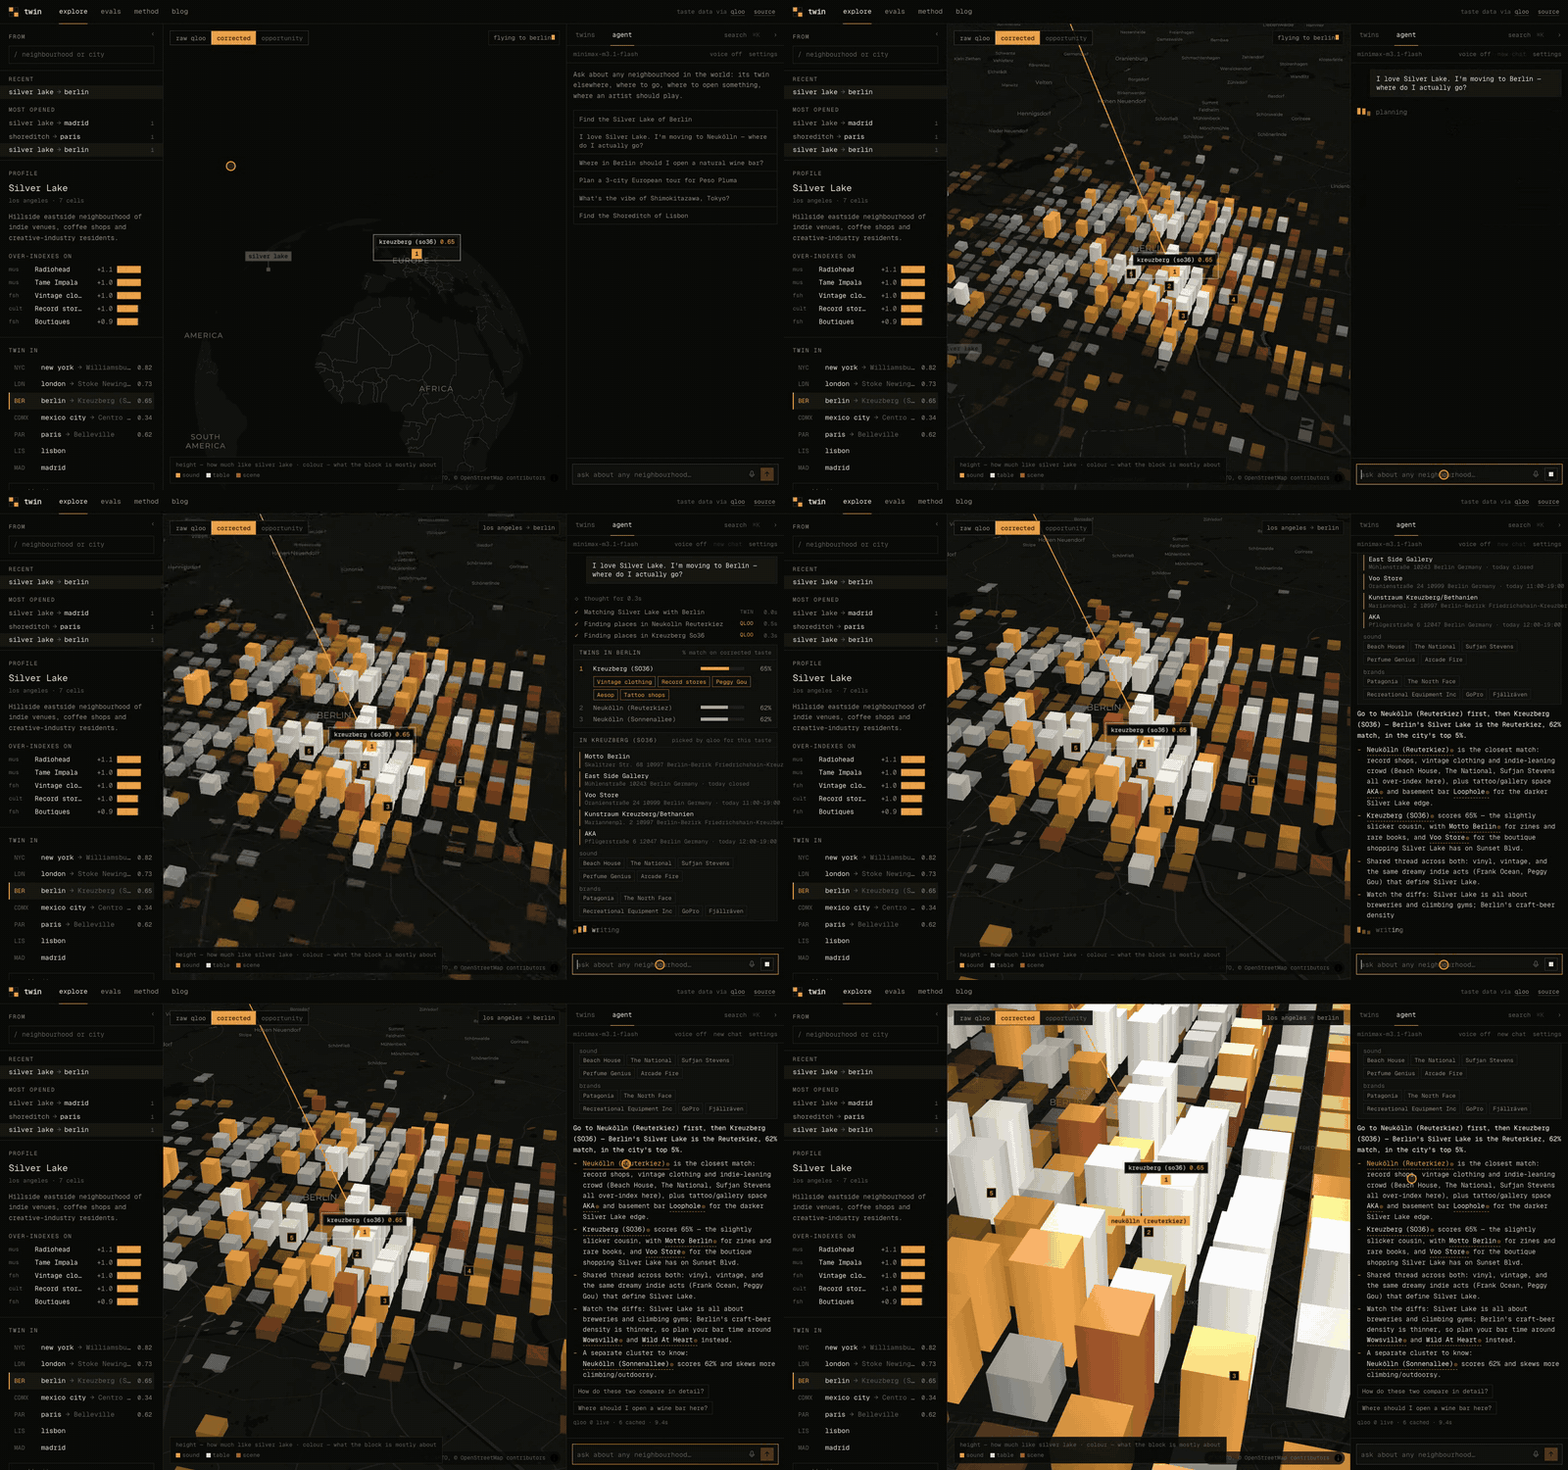
Silver Lake → Berlin. Block height = likeness. Kreuzberg (SO36) ranks first at 65%, with the traits both places share.
-
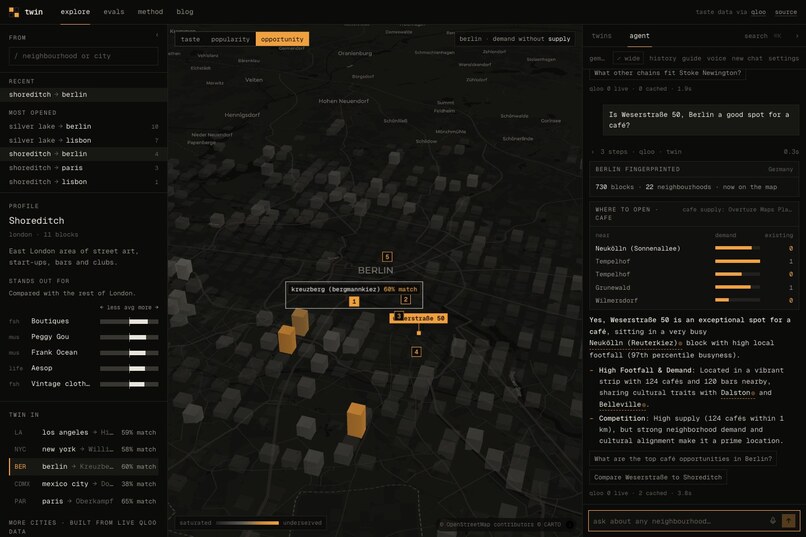
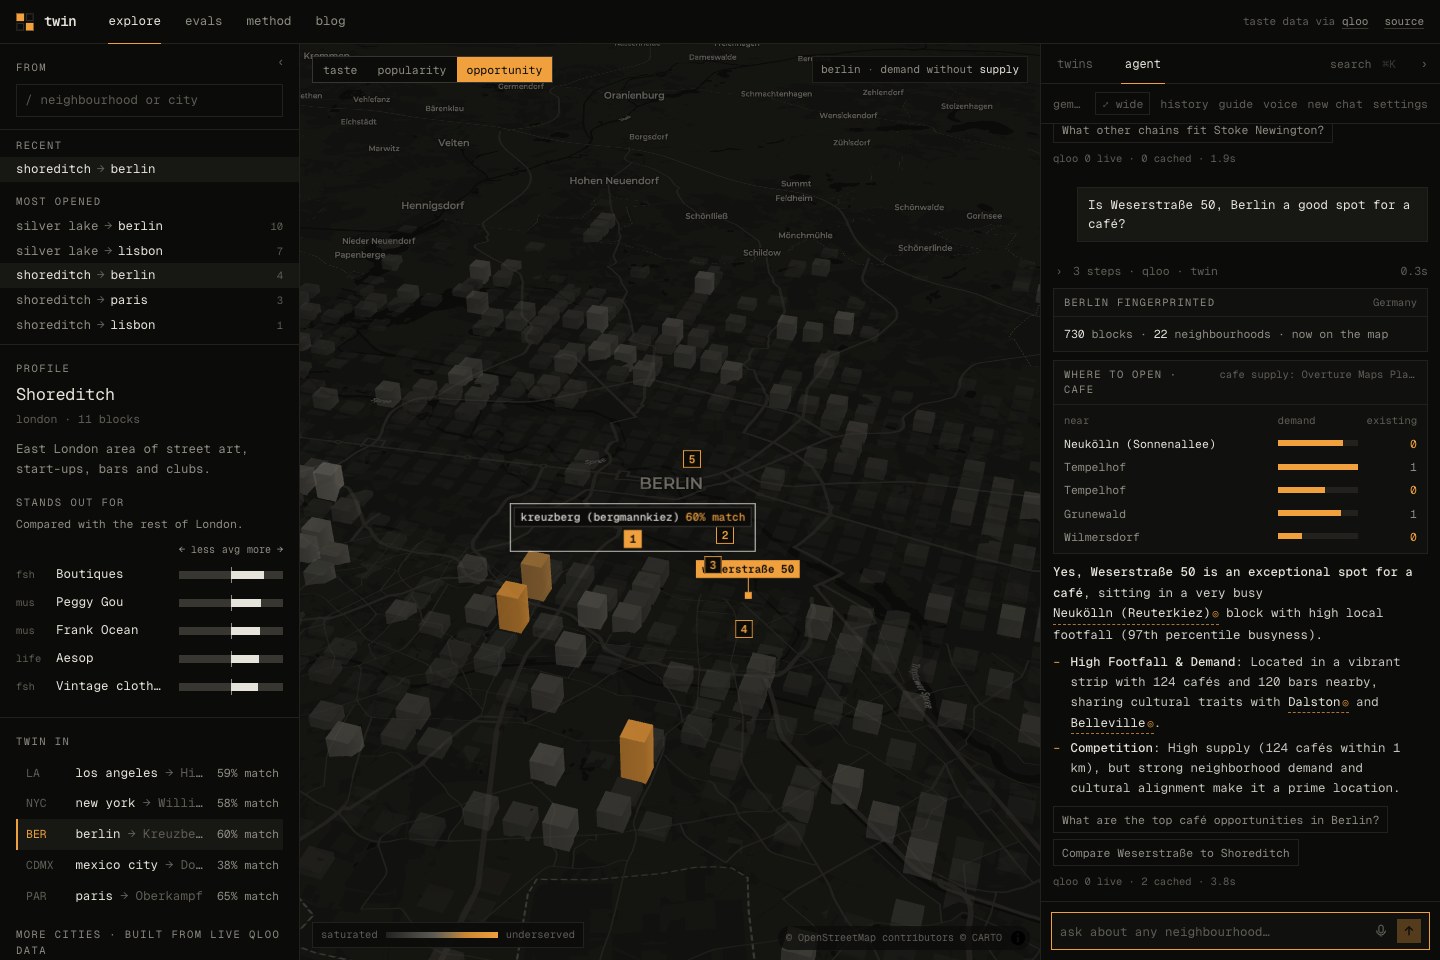
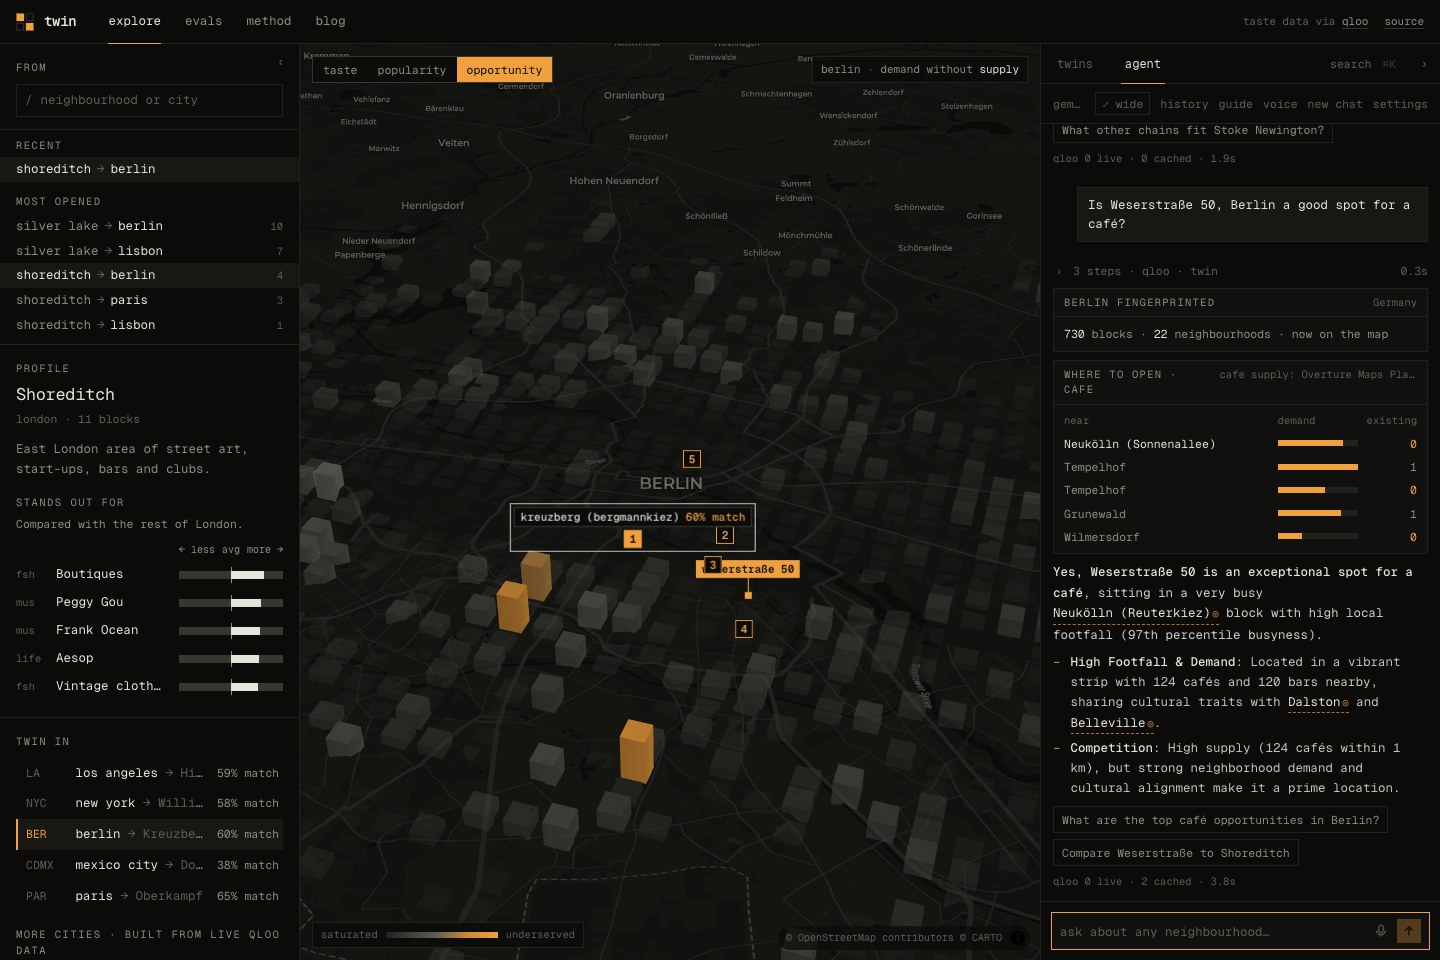
One address, one scorecard: busyness, what the block leans into, venues and chains within 1 km, twins abroad.
-
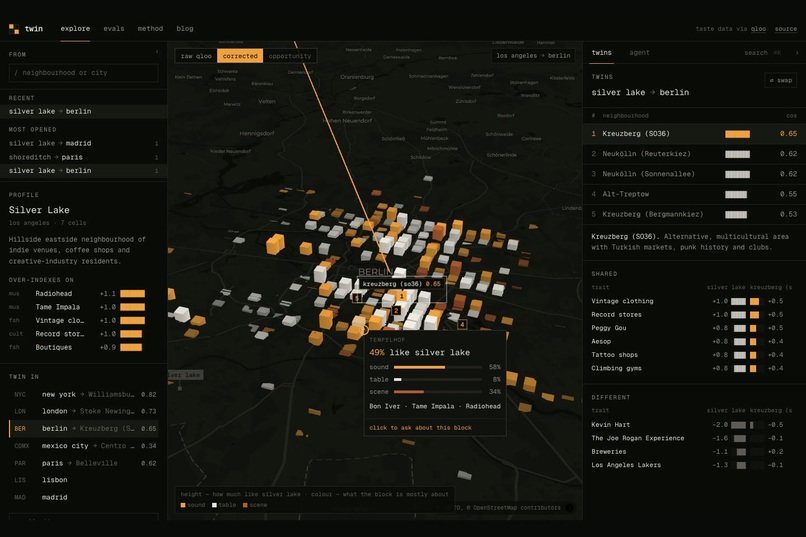
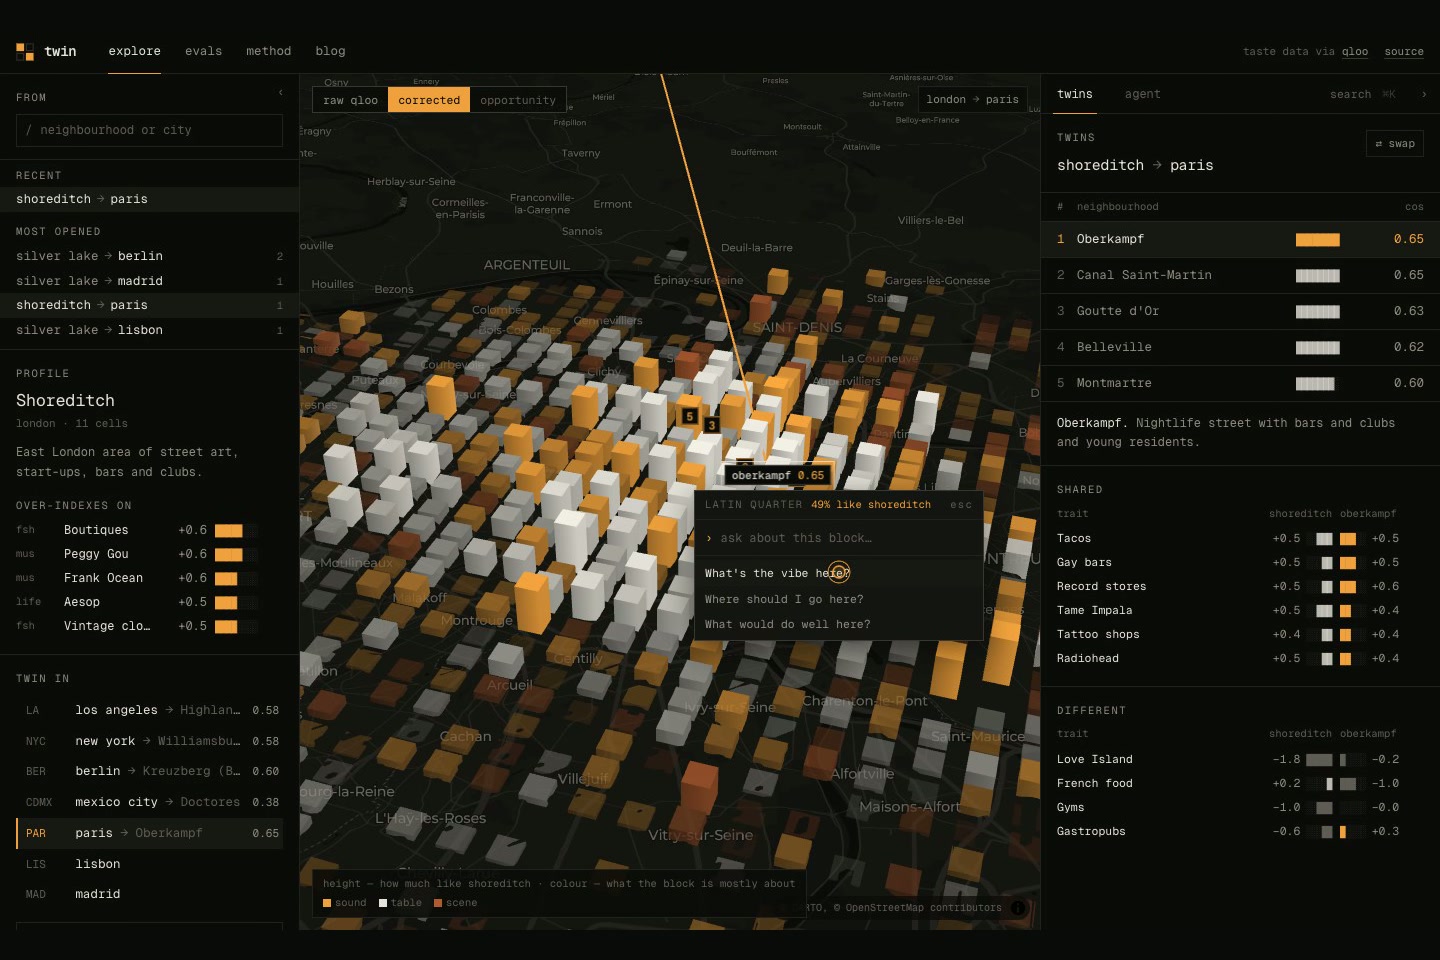
Hover any block for its likeness, taste mix, top traits and how many venues stand there (Overture Maps).
-
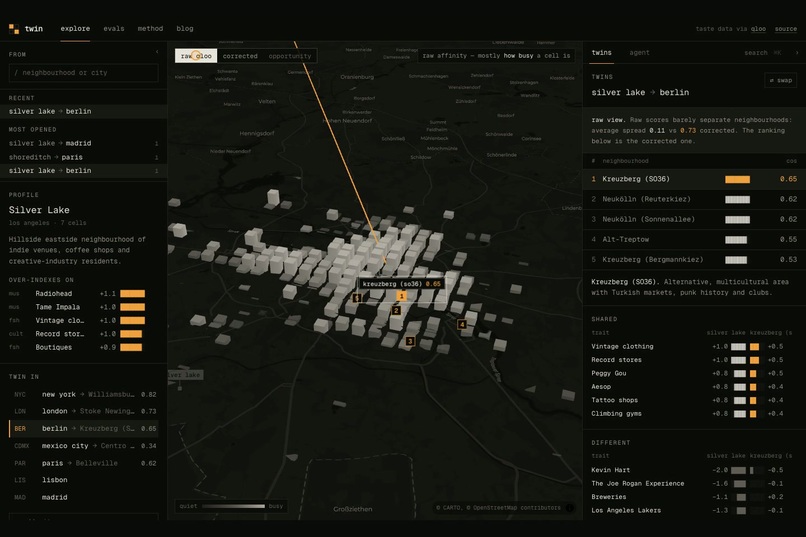
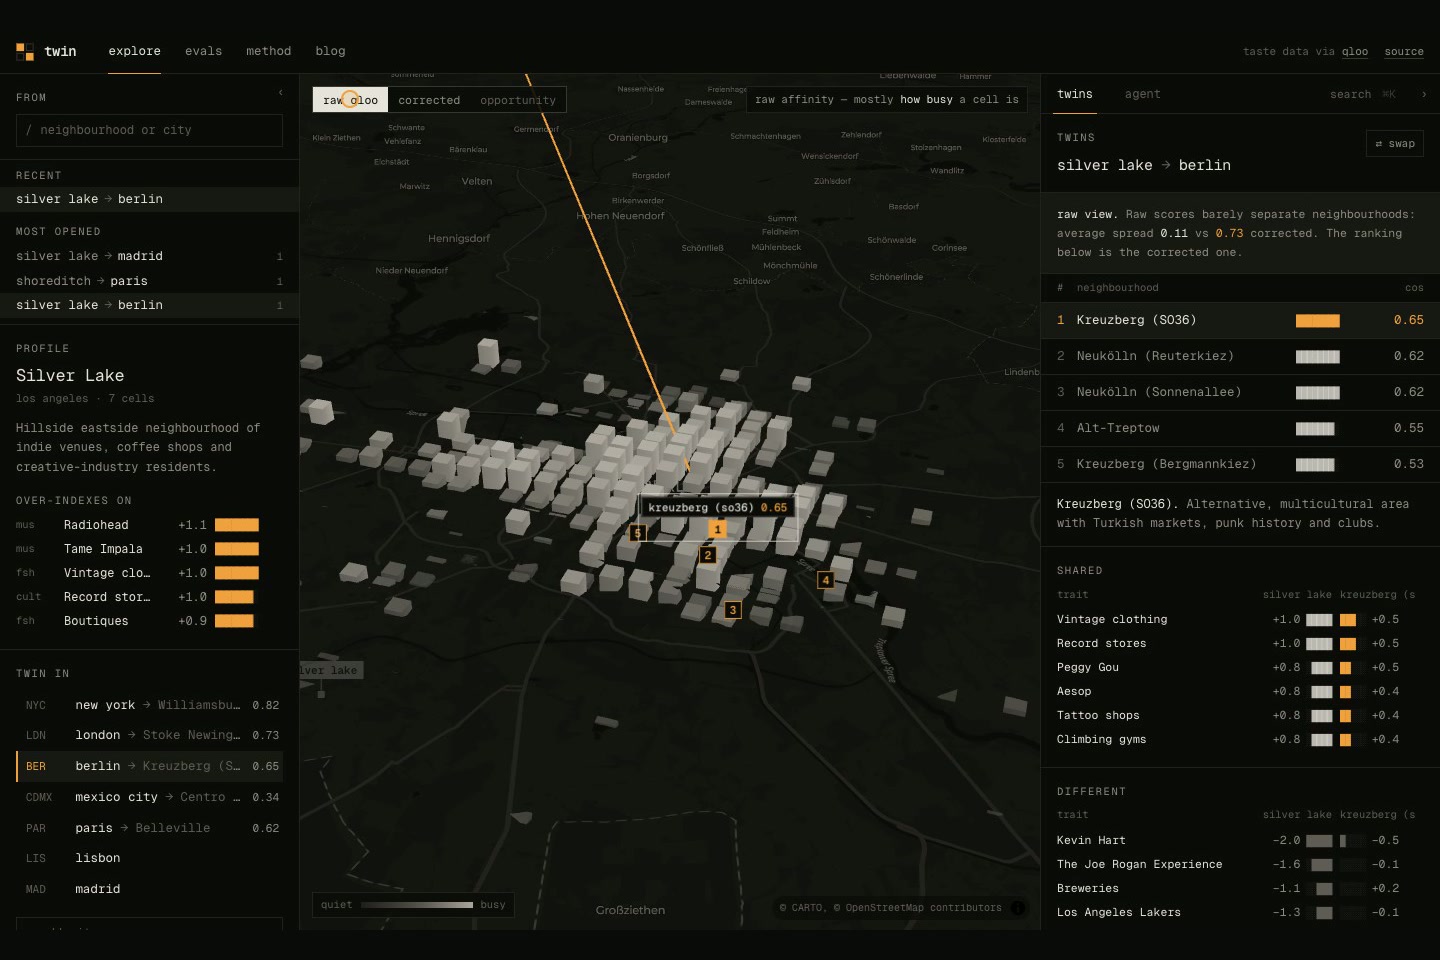
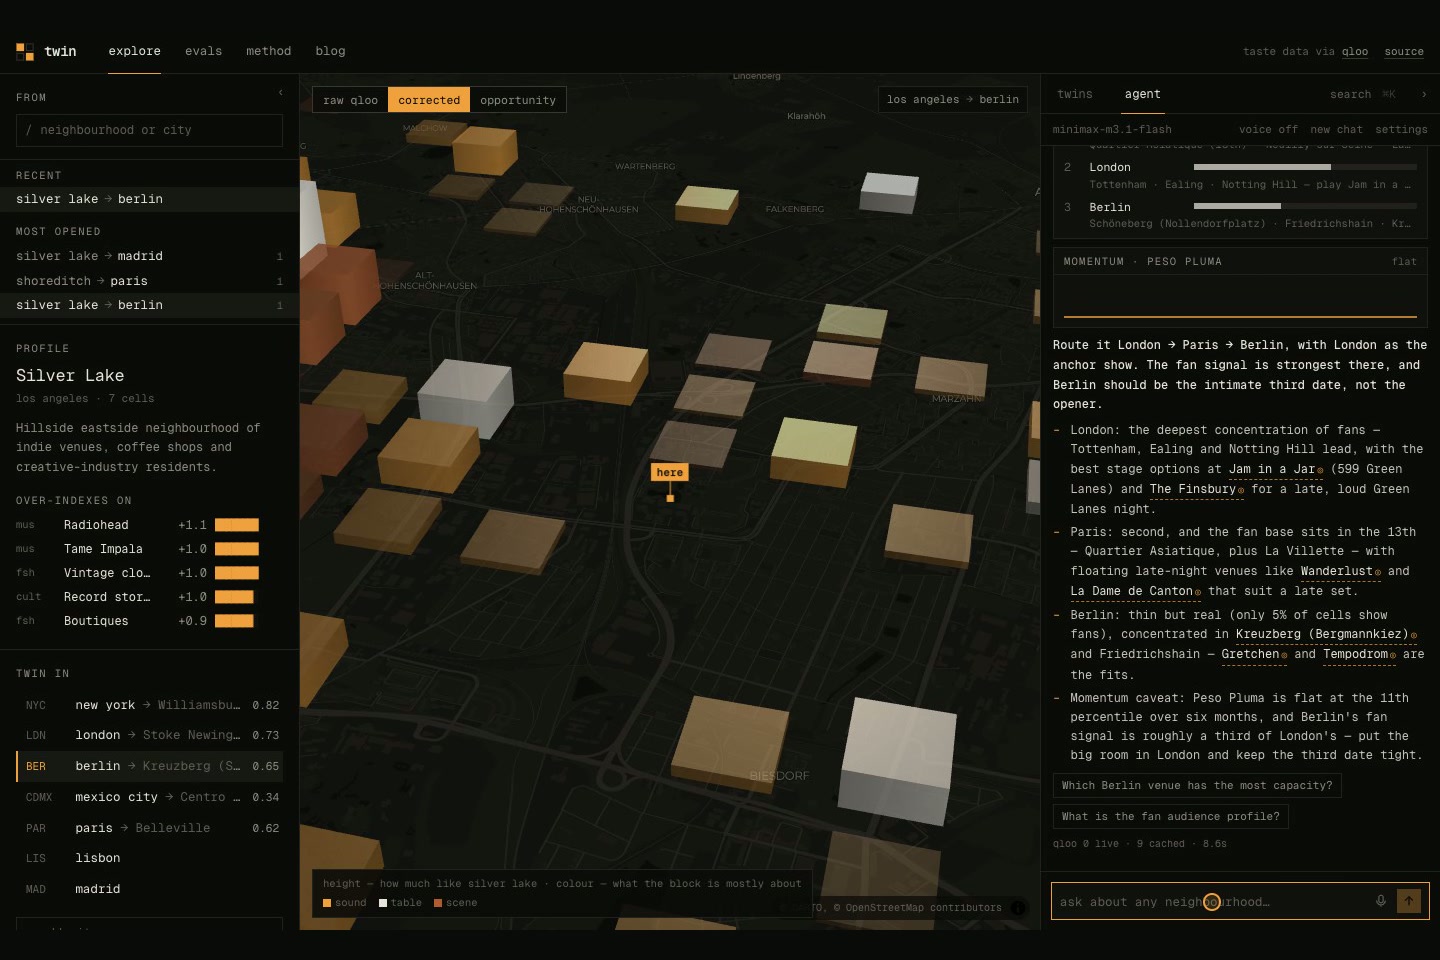
Raw Qloo scores: busy blocks score high for everything, so all look alike. Twin subtracts that baseline first.
-
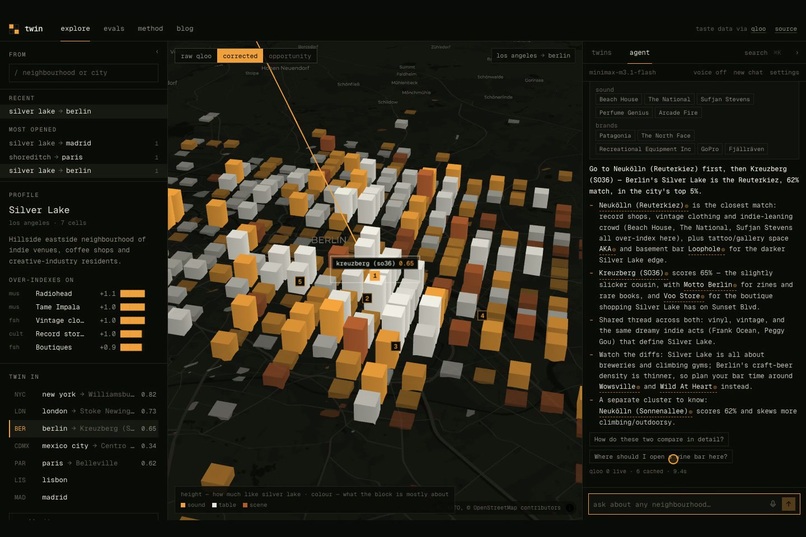
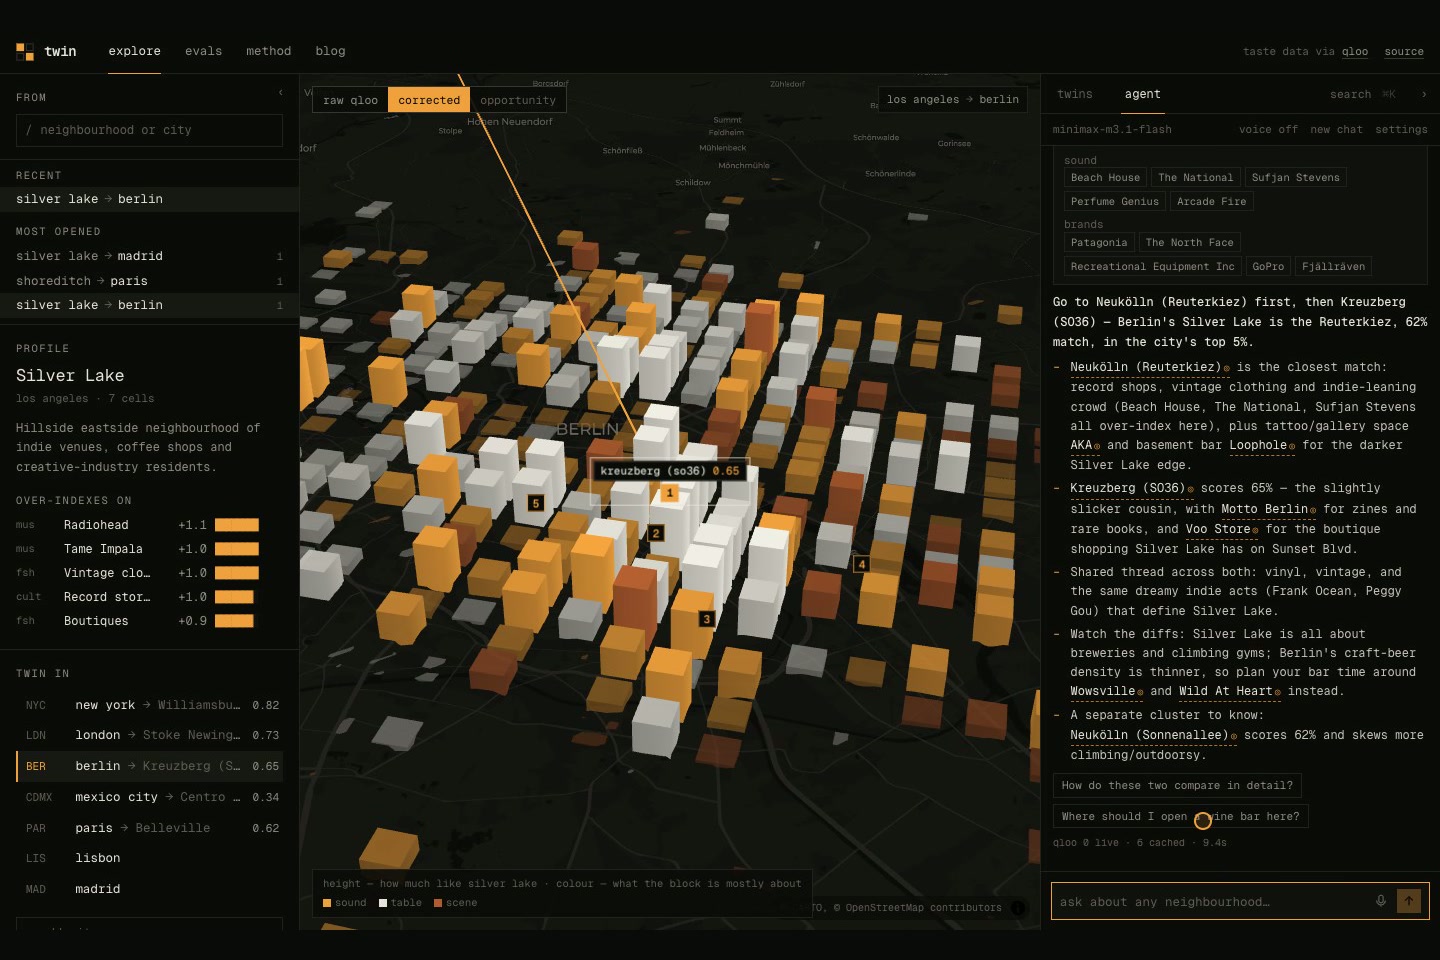
"Moving from Silver Lake to Berlin, where do I go?" Real places from Qloo; click any one and the map flies there.
-
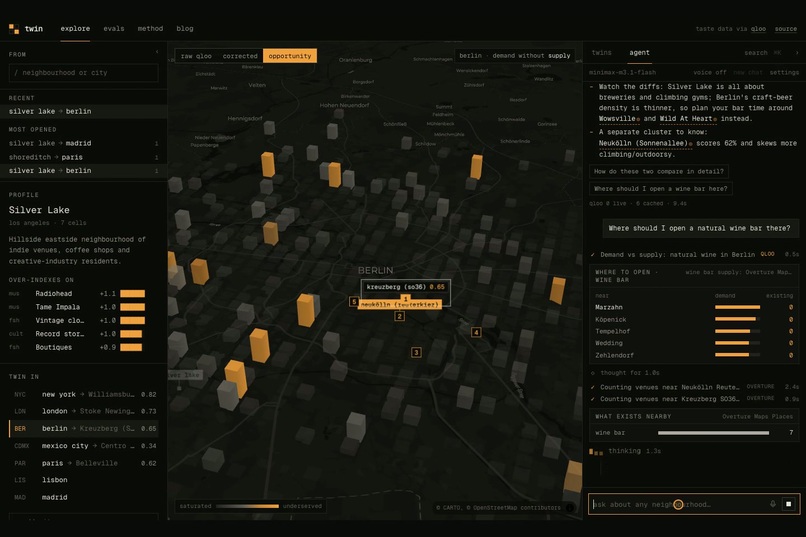
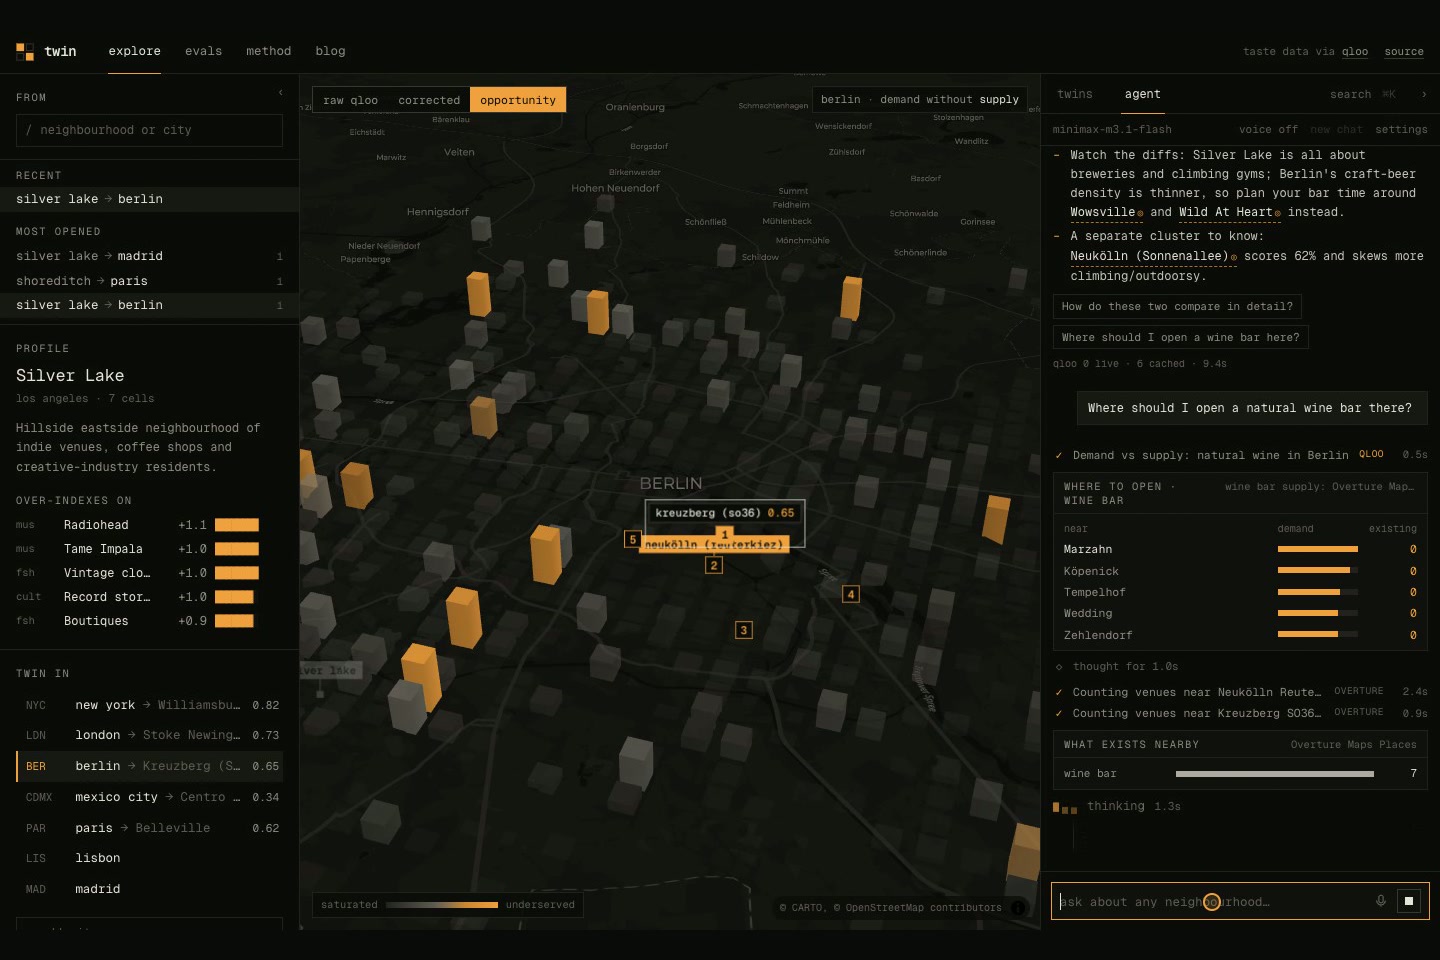
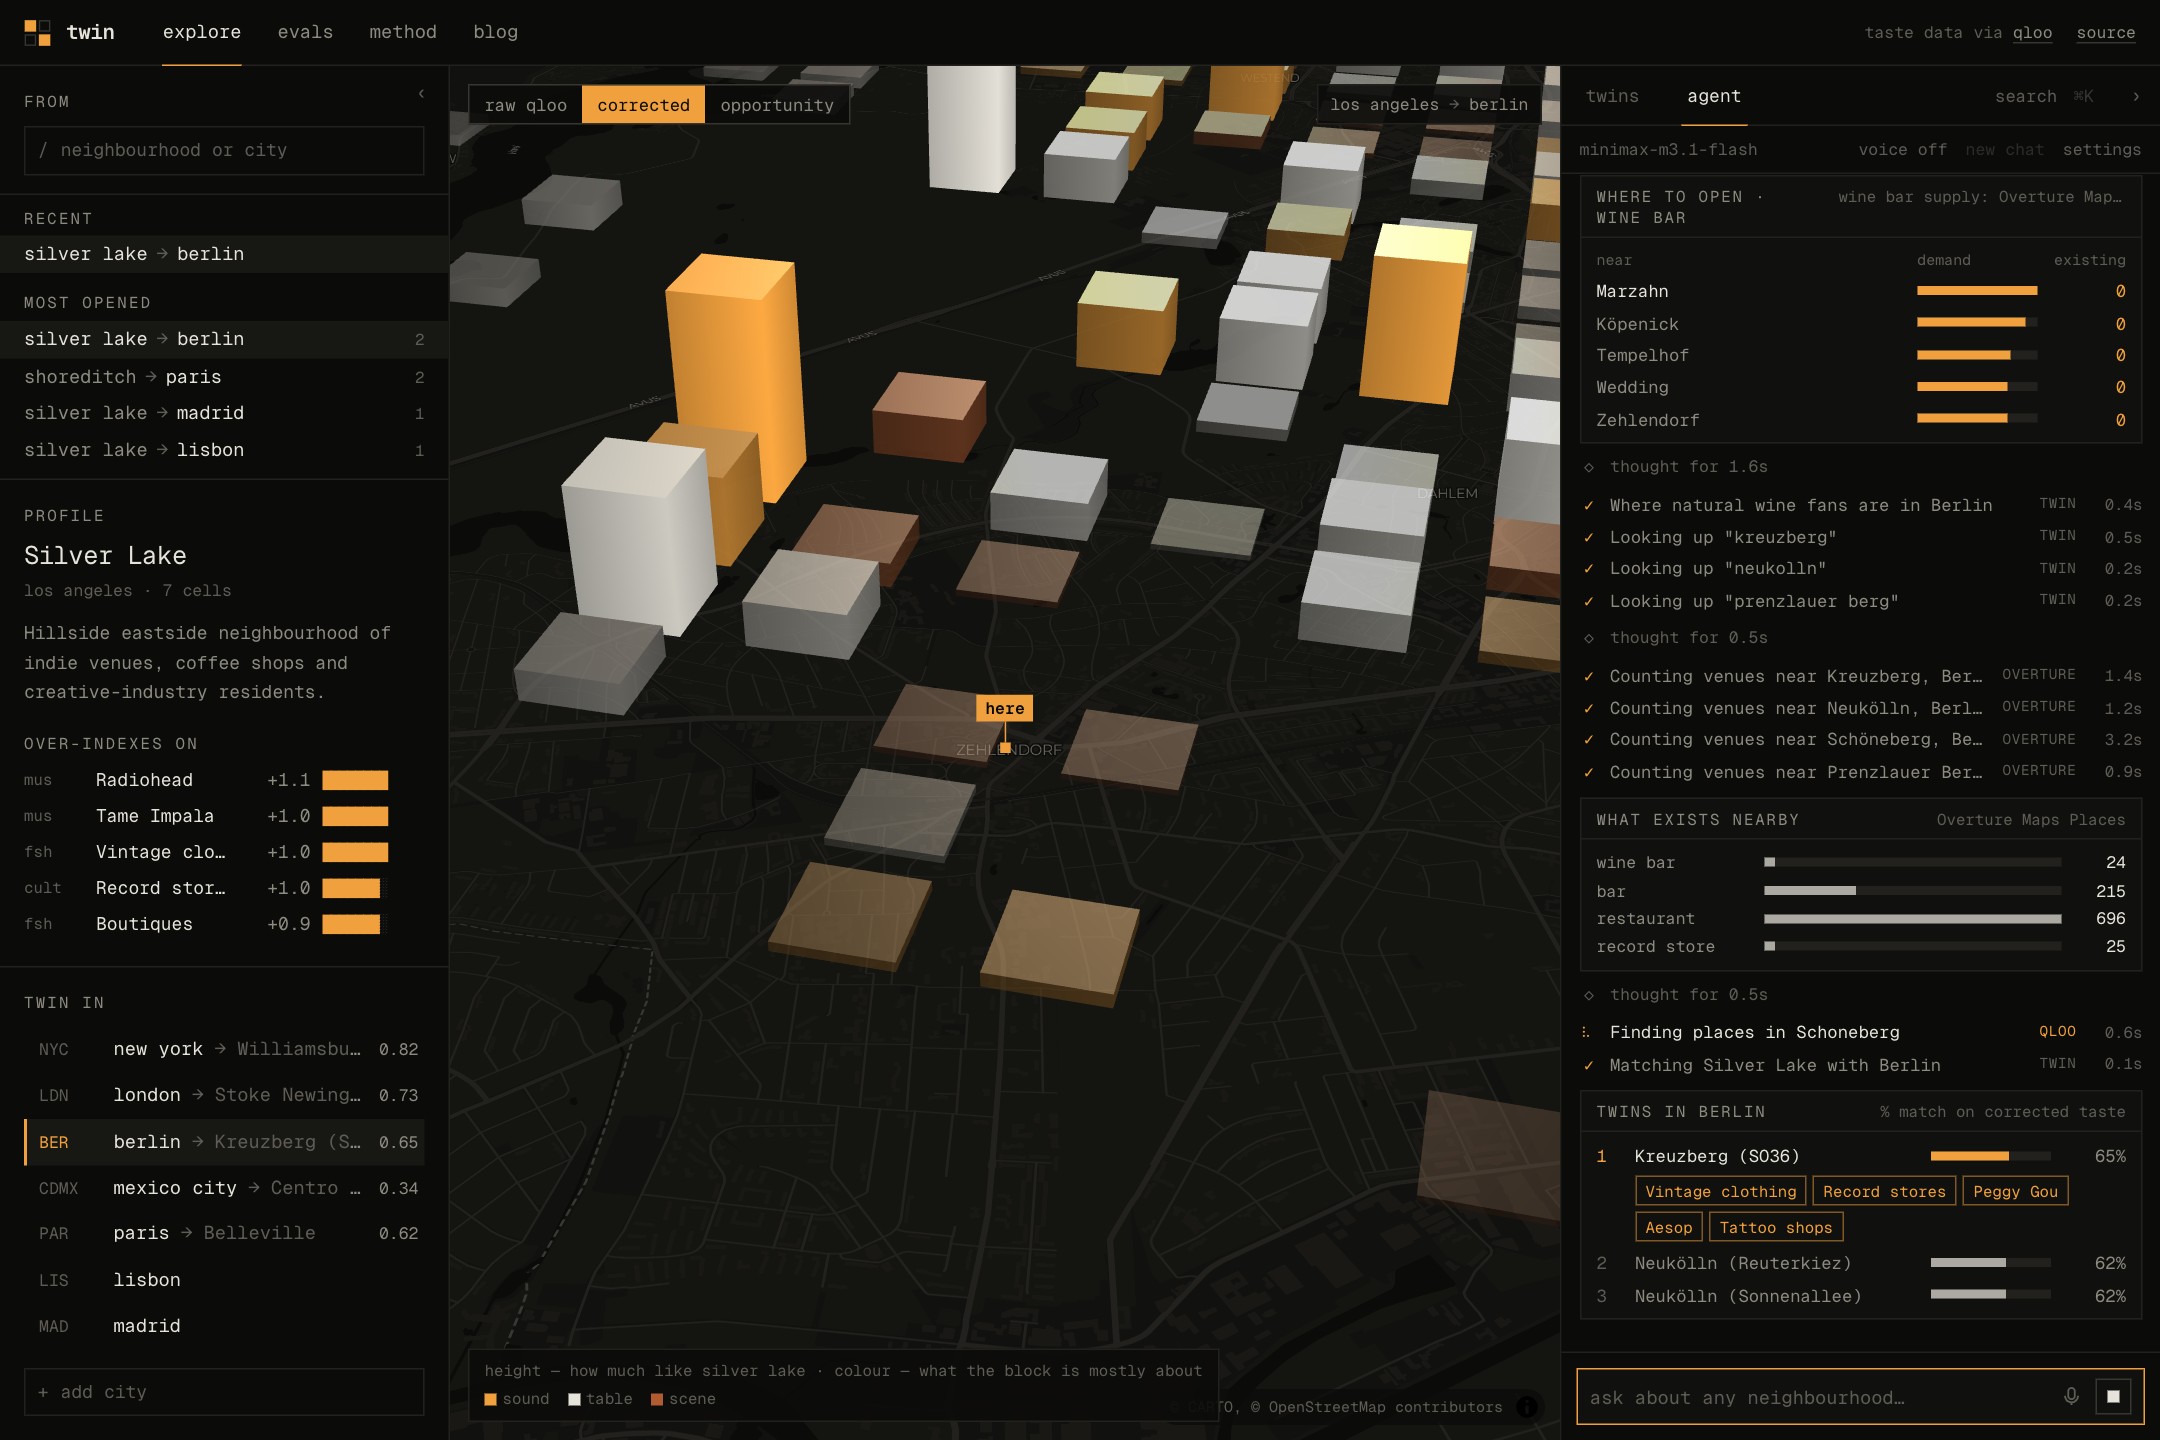
Where to open a natural wine bar: Qloo demand vs existing wine bars (Overture), gaps painted on the map.
-
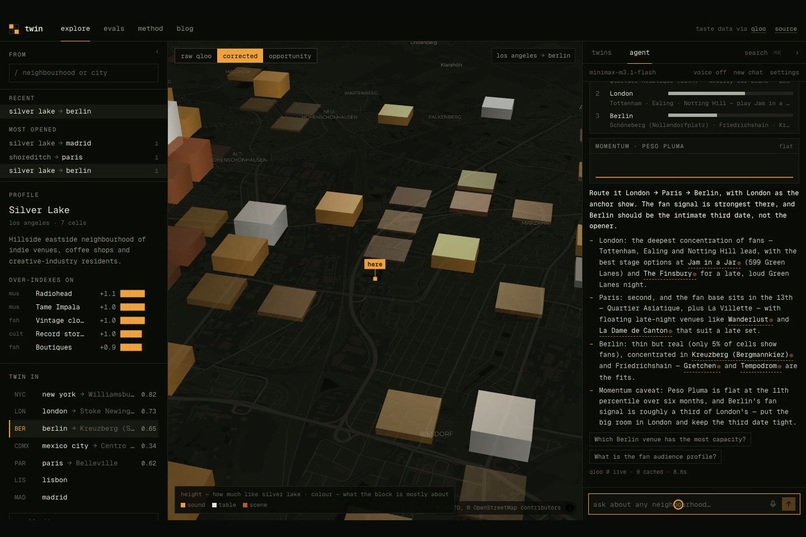
Tour planning: where an artist's fans are in each city, venues nearby, and Qloo trends for momentum.
-
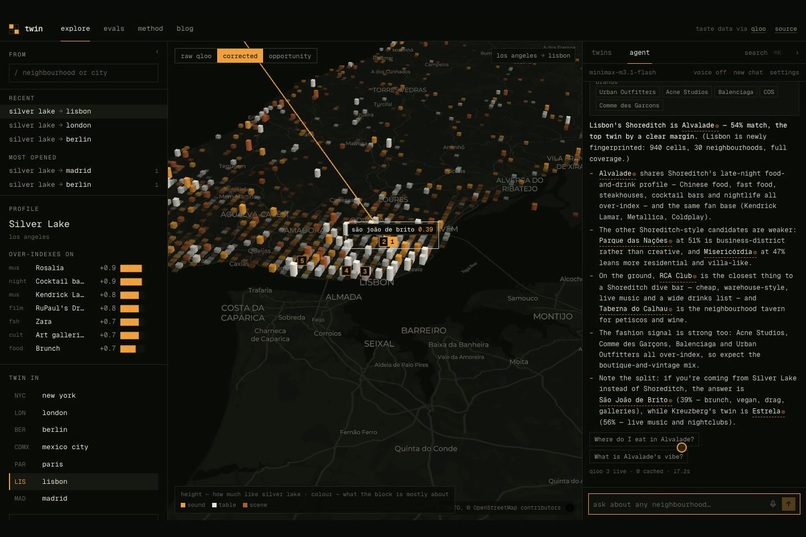
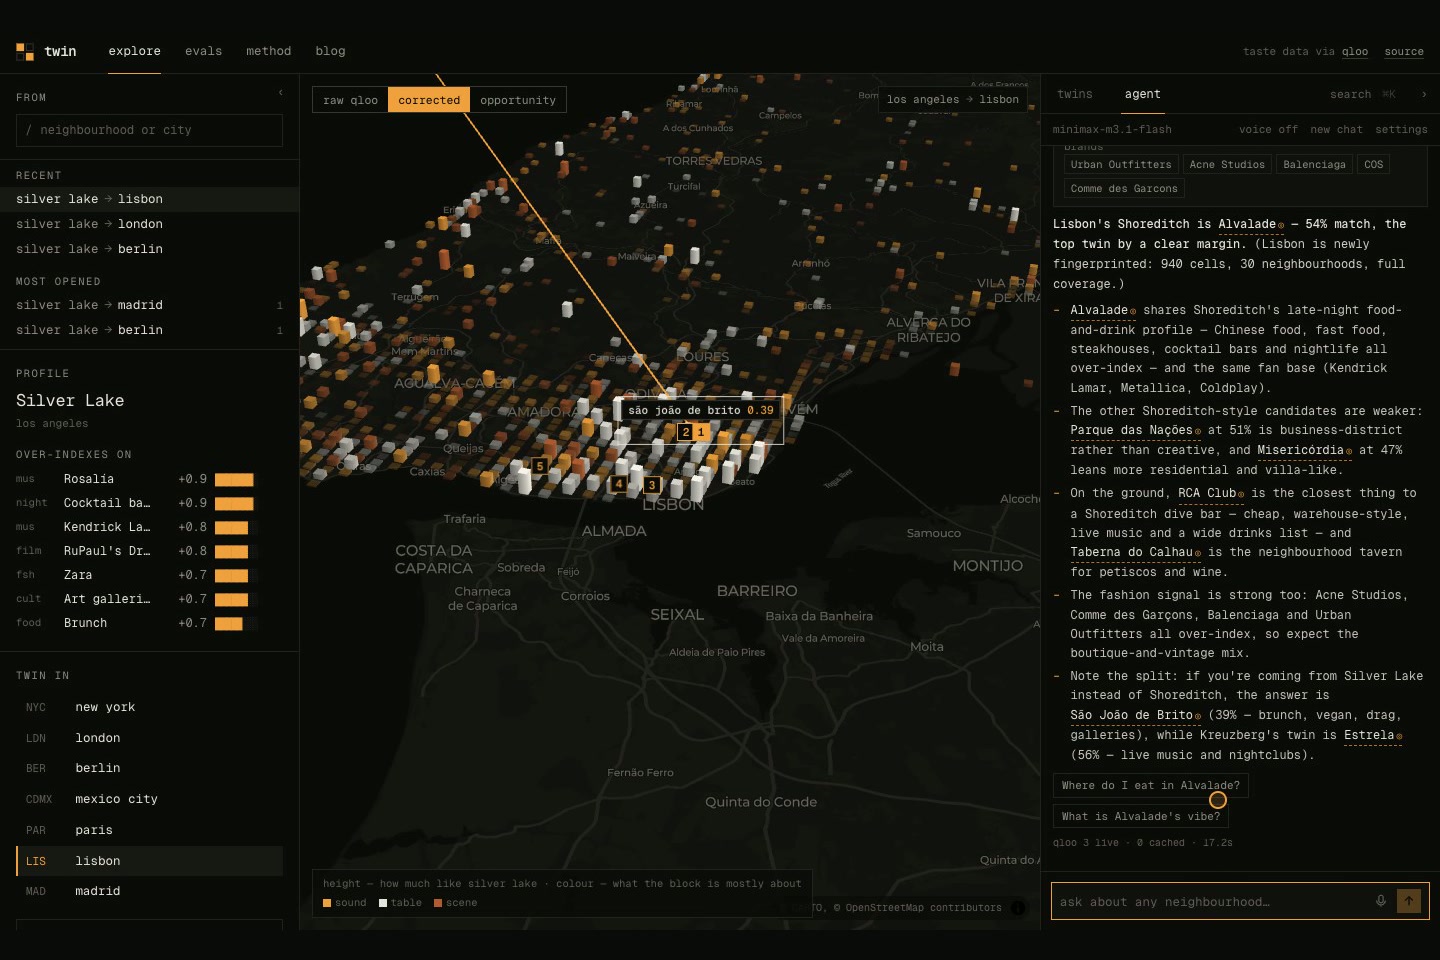
Any city: Lisbon was fingerprinted live from Qloo the first time someone asked, then cached for everyone.
-
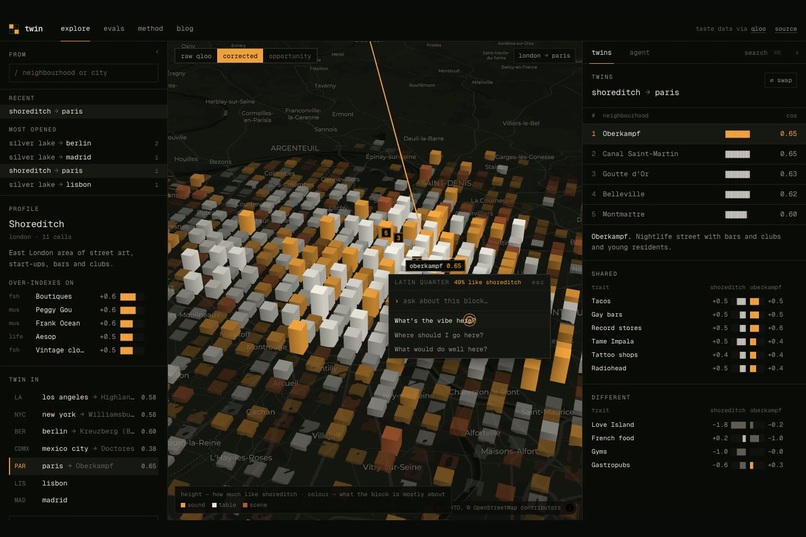
Click any block and ask about that exact spot. Qloo picks places, Overture counts what's there.
-
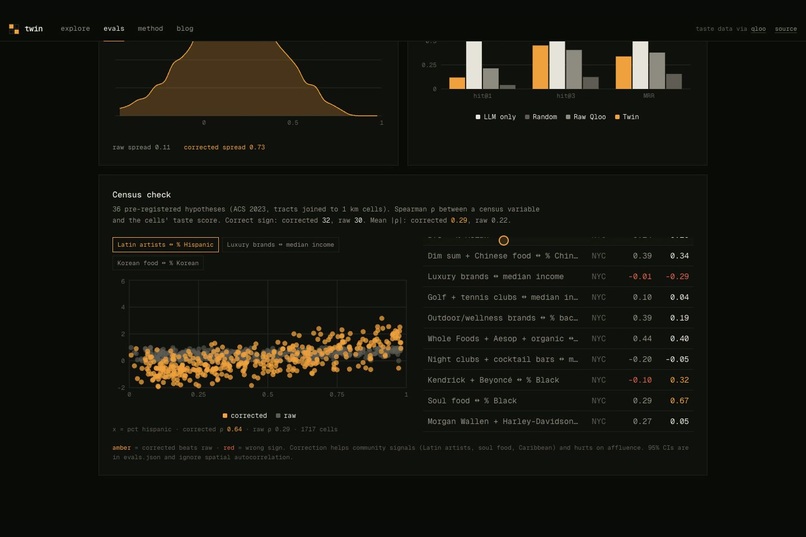
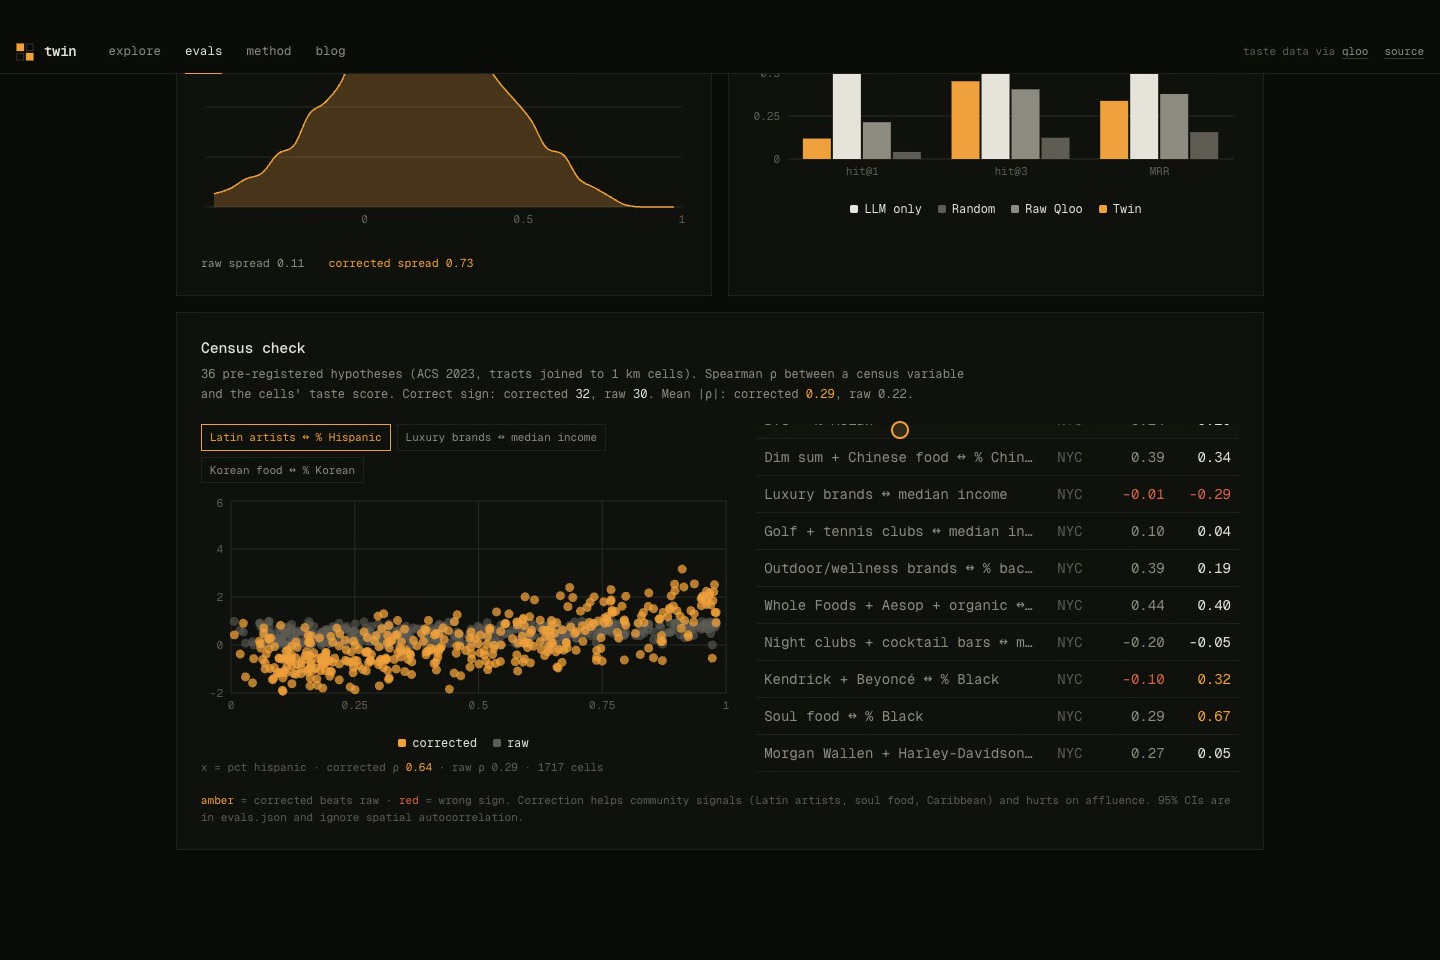
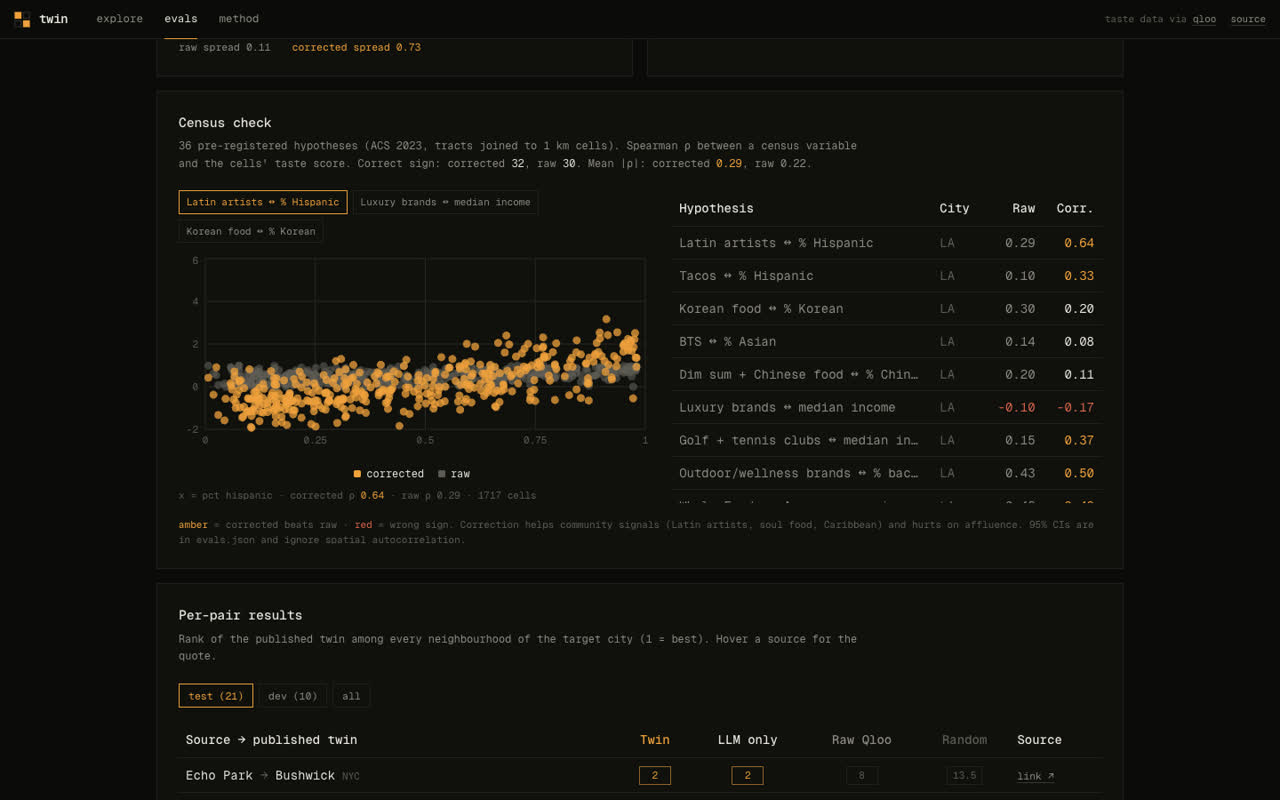
36 pre-registered census tests: corrected beats raw in 21 (Latin artists ↔ % Hispanic, ρ 0.29 → 0.64).
-
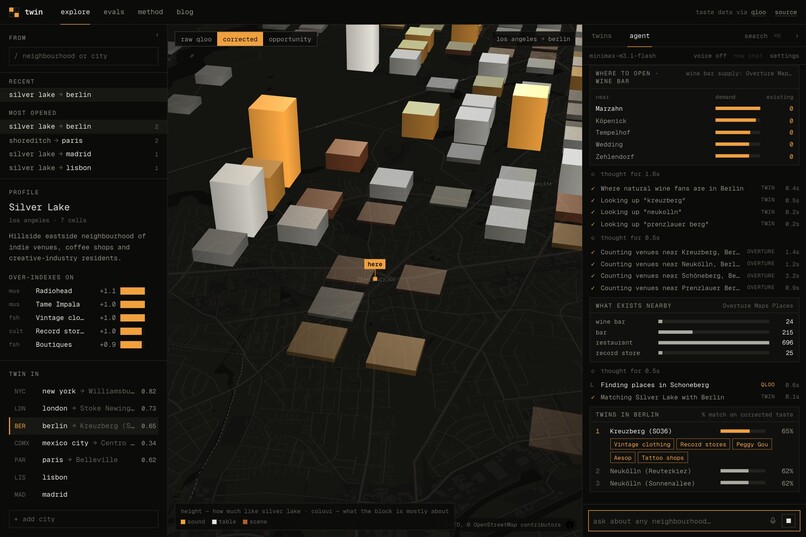
The agent mid-run: each step shows its source (Qloo, Overture, Twin) and timing; results land as cards.
Twin: find what works in one neighbourhood, and where it works next
Twin matches neighbourhoods across cities by taste, using Qloo data: the Silver Lake of Berlin, the Shoreditch of Lisbon. On top of that sits an agent that turns a match into a decision, with a written report you can hand to someone. It covers four jobs:
- Open a place. Which streets in a city want a natural wine bar, and how many are already there?
- Expand. My café works in Shoreditch. Where in New York or Lisbon is the same crowd?
- Move. I love Silver Lake. Which part of Berlin will feel like home?
- Tour. Where are an artist's fans in London, Paris and Berlin, and which venues fit?
This is the full story of how we got there, including the ideas we dropped and the tests we lost.
Inspiration
We started with the hackathon's own test: if your submission would work the same without Qloo, you're building the wrong thing. So before picking an idea, we spent a day finding out what Qloo's API can do that a language model can't.
We dropped several ideas on the way:
- A sync-licensing agent. It would pick ad music by audience. The demo was strong, but the core question was too narrow to test.
- A simulated city of 20,000 taste-driven agents. It would have looked spectacular. But Qloo returns averages for groups, not data on individuals. The spread dynamics would have been our assumptions dressed up as data.
- "UNDO", a provenance layer for agent memory. It came from a real effect we observed: feed a recommendation back in as an interest and the profile drifts. Radiohead → Patagonia → The Lumineers. The idea was solid, but it would work the same on any recommender, which fails the test above.
What survived came from the data itself.
What we found in the API
Heatmaps are detailed. One heatmap query for Los Angeles returns about 1,600 geohash-6 cells, each roughly 1.2 × 0.6 km. That's neighbourhood-level resolution.
Raw affinity is mostly popularity. Across LA cells, raw affinity correlated 0.97 with Qloo's own popularity score. The Kendrick Lamar map and the Korean-restaurant map were 0.75 correlated. Busy cells score high for everything, so Compton, Kendrick's hometown, sat at the 64th percentile for him.
The signal is there underneath. We subtracted each cell's mean over a basket of items, and recognisable geography came back:
| Neighbourhood | What stood out after correction |
|---|---|
| Compton | Kendrick Lamar, 98th percentile |
| Boyle Heights | Bad Bunny 95th, Peso Pluma 92nd, Taylor Swift 5th |
| East LA | Peso Pluma 99th, Morgan Wallen 1st |
| Silver Lake | Korean food 75th, vegan 69th, Peso Pluma 5th |
The corrected maps also grouped items the way you'd expect. Bad Bunny went with Peso Pluma (0.54), and Morgan Wallen with Taylor Swift (0.47).
Other things we learned about the API:
- Per-location affinity saturates. Asking Qloo directly for basket artists near a point returned 1.0 for nearly every artist, in both Silver Lake and Beverly Hills.
- Explainability weights are uninformative. They split almost exactly 50/50 between inputs.
- The best use of location is "what over-indexes here". For Boyle Heights it returned Las Cafeteras, Chicano Batman, Ozomatli, Alice Bag and Felipe Esparza. An LLM would have answered with stereotypes.
What it does
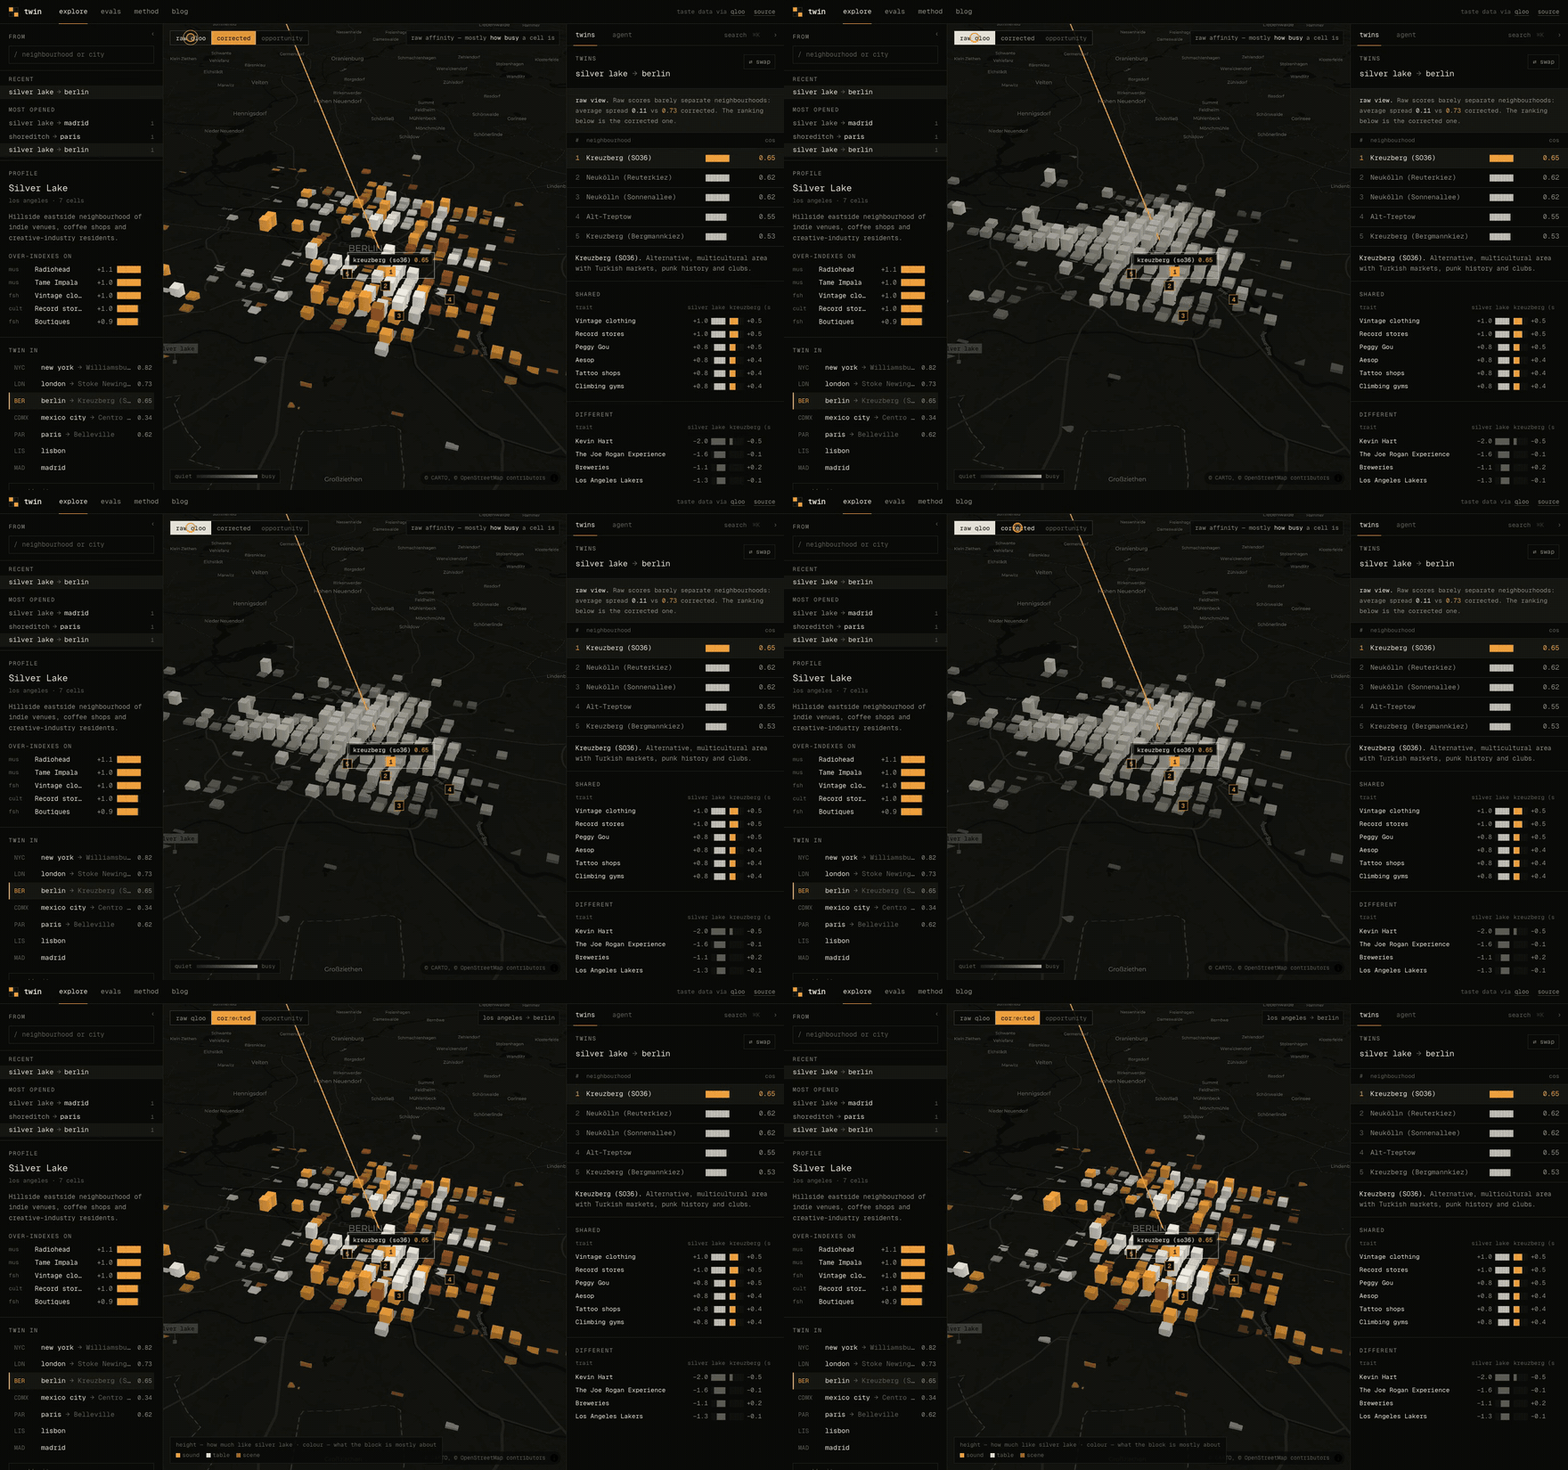
- Explore. Pick a neighbourhood and every block of its city lights up by how similar it is. Pick another city and the camera flies there. Its blocks rise by similarity to your source, and the five closest neighbourhoods are ranked. A shared / different table shows the traits behind each match. A taste/popularity toggle shows the same map before and after our fix.
- Read a block. Each ~1 km block is one column. Its height is how much it's like your source, and its colour is what it's mostly about: sound (amber), table (bone) or scene (rust). Hover it for the likeness, the taste mix, its strongest traits and how many venues of each kind actually stand there (Overture). Click ask and the agent answers about that exact block.
- Reports. Ask for a report and the agent works like an analyst. It picks a playbook (site selection, expansion, gap scan, relocation, tour routing, neighbourhood profile, city comparison), pulls live Qloo, Overture, OpenStreetMap and web data, and writes one standard structure: a GO / WATCH / SKIP verdict, key numbers, the market, who the customers are, candidates compared, demand, named competitors, the same concept benchmarked abroad, a scorecard, risks and a validation plan. Charts and tables are generated UI (json-render), not screenshots. Every number in a chart or headline is checked against the data the tools returned before the report is saved; a number the agent can't trace is rejected and it has to fix it.
- The report on the map. An open report numbers its shortlist on the map (1 = top pick) and flies to its city. Every place in the text is a link that moves the map.
- Take it with you. A share link anyone can open, a PDF rendered on the server, and Markdown.
- Twin vs a plain AI. One click asks a model without Twin's tools the same question, and every place it names is checked against OpenStreetMap. Many can't be found or sit in the wrong city.
- Brand whitespace. Where a chain already is (10,000 chains from Overture Maps across the six built-in cities) and the busy blocks that match the taste around its branches but have none within 1 km. "Where should Pret open next in London?" returns Stoke Newington, Clapham and Peckham, with Pret's own backtest score.
- Lookalike sites. "My cafés on Redchurch Street and Broadway Market do well. Where in Paris?" Busy blocks whose taste matches the average of your own sites, in any of the 24 cities.
- Site check. One address: how busy it is, what the block leans into, the venue mix and chains within 1 km, and its twins abroad. No Qloo quota needed.
- Gap scan. "What thrives in Reuterkiez's twins abroad that Reuterkiez itself lacks?" compares venue mixes across the twins and lists what recurs there and is missing at home.
- Opportunity map. Busy blocks first, then Qloo taste demand against supply: how many such venues physically exist (Overture Maps Places). The gaps are painted on the map.
- Any city on Earth. Six cities have the full 116-trait fingerprint. Eighteen more (Lisbon, Tokyo, Barcelona, Amsterdam, Madrid, Rome, Milan, Melbourne, Sydney, Toronto, Chicago, San Francisco, Austin, Seoul, São Paulo, Buenos Aires, Istanbul, Vienna) are built from 40 live Qloo heatmaps. Any other city is built the first time someone asks, in under a minute, and cached.
- Runs in the background. A report keeps running if you close the tab. Pick a username (no password; a sync code moves it to another device) and it lands in your history.
- An agent with 29 tools, streaming its work as a timeline with each step's source (QLOO, TWIN, OVERTURE, OSM, WIKI, WEB) and timing. Answers are written for people: a one-line verdict, reasons in plain words, "% match" instead of cosines.
- MCP server. The same tools run over stdio, so Twin works inside Claude Code, Codex or any MCP client.
Who answers what
We kept one rule: Qloo makes every taste decision, and the other sources only do jobs Qloo can't.
| Question | Source |
|---|---|
| Twins, vibe, venue picks (with hours and price), audiences, brands, momentum, demand | Qloo (live) and Twin's corrected fingerprints |
| How many venues of a kind physically exist | Overture Maps Places, precomputed per city |
| Neighbourhood boundaries for a new city, coordinates | OpenStreetMap (Overpass, Nominatim) |
| Background facts, population | Wikipedia and Wikidata |
| This week's events, news, closures, rents | Web search (Tavily), always cited |
Things to try
- Make me a report: Where in Berlin should I open a natural wine bar?
- Make me a report: My café works in Shoreditch, London. Where in Lisbon should I open the next one?
- Make me a report: What thrives in the twins of Reuterkiez abroad that is missing in Reuterkiez itself?
- Find the Silver Lake of Berlin.
- Plan a 3-city European tour for Peso Pluma.
- What's the vibe of Shimokitazawa, Tokyo?
- Find the Shoreditch of Lisbon.
How we built it
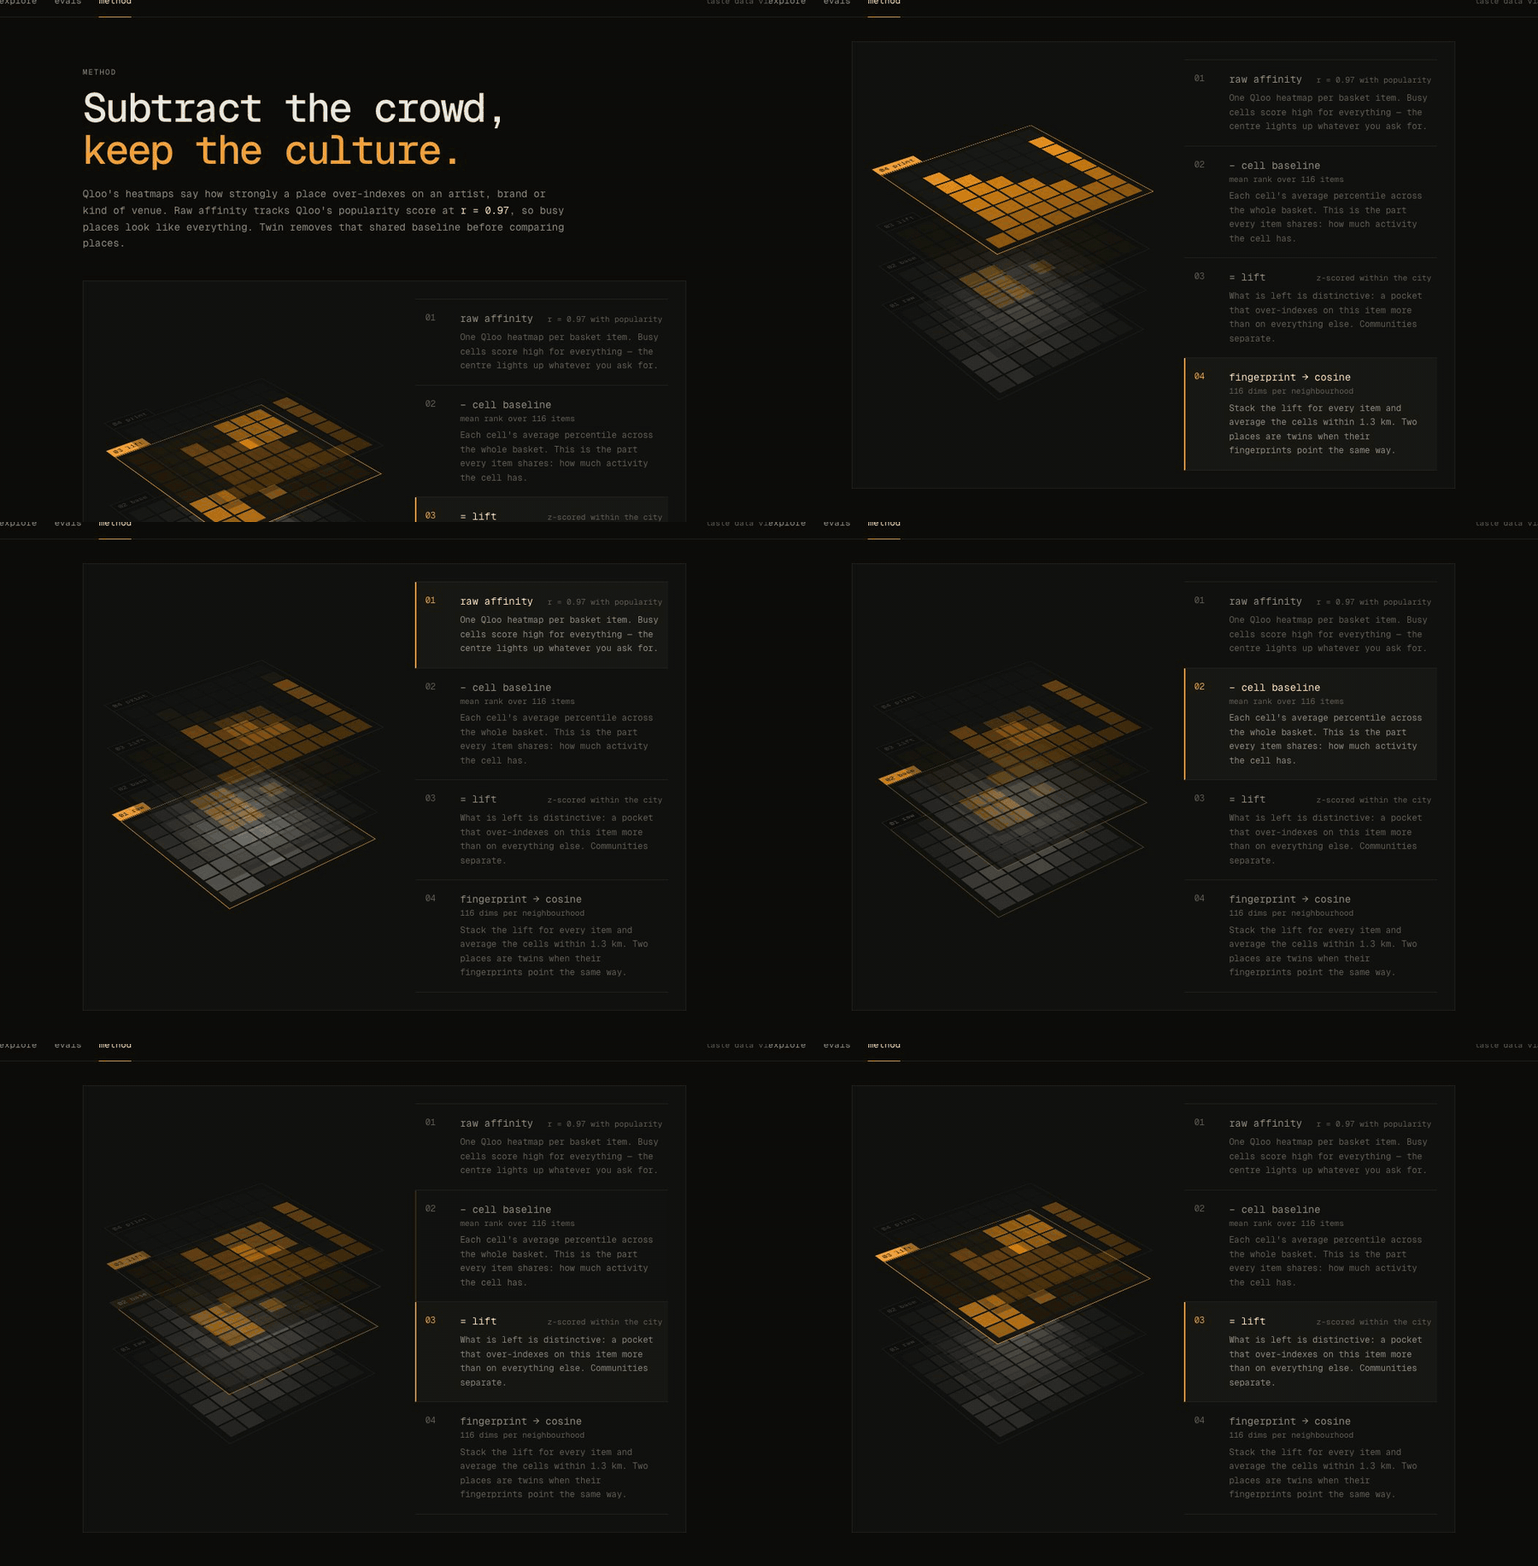
- Sample. One Qloo heatmap per basket item, per city. The basket has 116 items: artists, brands, films and place types. We picked them to span affluence, creative scenes, immigrant communities, queer nightlife, sport and suburban life. 1,041 live Qloo calls in total, every response cached.
- Correct. Percentile-rank each item across the city's cells. Subtract each cell's mean rank over the basket, which is its popularity baseline. Z-score each item within the city.
- Fingerprint. A neighbourhood is the mean of the cell vectors within 1.3 km of its centroid. We have 139 neighbourhoods across LA, New York, London, Berlin, Mexico City and Paris.
- Match. Cosine similarity, top five per city, with shared and diverging traits.
Stack:
- Pipeline: Python, standard library only.
- App: Next.js with MapLibre's globe projection and deck.gl columns for the city blocks.
- Agent: Vercel AI SDK. Server:
streamTextwith tools, andcreateUIMessageStreamso tool progress and map actions stream as data parts. Client:useChat. - Models: Gemini 3.5 Flash-Lite first (Google AI Studio free tier: a full report in 11–20 s), then Gemini 3.5 Flash and 3.1 Flash-Lite, then free OpenRouter models (MiniMax M3.1 Flash, Nemotron 3 Ultra) on two keys. If one fails or runs out of free requests mid-run, the next continues from the steps already finished. Visitors can bring their own key.
- Reports: json-render for the report blocks (web and PDF from one schema),
@react-pdf/rendereron the server, seven playbooks as Markdown skills the agent loads on demand. - Caching: every Qloo, OpenStreetMap, Wikipedia and search response, every live city, every report and every username goes to Upstash Redis, gzipped. Qloo answers are kept for 30 days, and an older copy is served if Qloo is down. Repeat questions cost nothing, which matters on free tiers.
- Supply data: Overture Maps Places, queried with DuckDB straight from its cloud bucket and binned into the same 1 km cells. It's precomputed per city, so opportunity answers are instant.
City queries had quirks we had to work around:
- "Los Angeles" returns only the City of LA, so Compton and Santa Monica were missing. We use "Los Angeles County".
- "New York" returns the whole state at coarse resolution. We use "New York City".
- "Paris" returns only the 20 arrondissements. We use "Paris and suburbs".
- Mexico City and Paris come back at geohash-7, so we average them up to geohash-6.
How we tested it
We wrote down every label before computing any result, and committed it to git first. The ground-truth pairs are in commit edf9056 and the census hypotheses in 4965b70.
1. Does the correction separate places?
Mean cosine between neighbourhoods in different cities is 0.95 on raw scores and 0.16 after correction. The average gap between a city's best and worst match grows from 0.11 to 0.73.
2. Does the corrected map match the census?
We pre-registered 18 hypotheses and ran each in LA and NYC, so 36 tests. Each one links a taste item to an ACS 2023 tract variable, with an expected direction: Latin artists ↔ % Hispanic, soul food ↔ % Black, luxury brands ↔ income, and so on. We joined tracts to cells and computed Spearman ρ.
| Corrected | Raw | |
|---|---|---|
| Correct sign | 32 / 36 | 30 / 36 |
| Mean \ | ρ\ | |
| Corrected beats raw | 21 / 36 |
Where the correction helps:
- Latin artists ↔ % Hispanic in LA: 0.29 → 0.64.
- Soul food ↔ % Black in NYC: 0.29 → 0.67.
- Real Madrid and Barcelona ↔ % Hispanic in LA: −0.04 → 0.41.
Where it hurts:
- Luxury brands ↔ income turns negative in both cities (LA −0.17, NYC −0.29).
- Country music and Harley-Davidson ↔ % non-Hispanic white drops from 0.26 to 0.01.
- Rich areas over-index on many items at once, so subtracting the baseline removes some of what they share.
One surprise is good news for Qloo: raw data already gets the direction right in 30 of 36 tests. Raw isn't "just density" in the census sense. It carries a popularity baseline on top of real signal.
3. Does Twin find the twins people already name?
We collected 31 published comparisons ("Shoreditch is London's Williamsburg"), each with a source URL and quote. We split them into 10 dev and 21 test pairs and scored ranks in both directions. The LLM baseline got the same candidate list, with no data.
| Method (test, n = 42) | hit@1 | hit@3 | MRR |
|---|---|---|---|
| LLM only (Claude, no data) | 0.52 | 0.74 | 0.67 |
| Raw Qloo | 0.21 | 0.41 | 0.38 |
| Twin | 0.12 | 0.45 | 0.34 |
| Random | 0.04 | 0.12 | 0.16 |
The LLM wins. It has read the same blogs the labels come from, so this test mostly measures recall. Twin gets roughly three times random from taste data alone, with no names and no text.
Things we tried, without tuning on test:
- Blending Twin's ranking with the LLM's. It was slightly better on dev (MRR 0.72 vs 0.69) but worse on test (0.55 vs 0.65). We dropped it.
- Mixing raw features back in. Worse on dev.
- Qloo's per-location scores. They saturate, as noted above.
- A held-out-trait check. We matched neighbourhoods on half the basket and scored them on the other half. Twin's picks agreed 0.51, the LLM's picks 0.47, the published twins 0.47, random 0.27. That check lives in Qloo's own space, so it's partly circular, and we report it as weak evidence only.
4. Does taste predict where real businesses open?
The twin test above is about people's opinions. This one is about money. We took 177,000 branded places from Overture Maps in the six cities: 457 chains and 2,246 (brand, city A → city B) pairs. For each pair we asked: given where the brand already is in city A, does Twin rank the blocks where it actually opened in city B above the blocks where it didn't? The hypotheses were committed before the run (pipeline/backtest/HYPOTHESES.md).
| Hypothesis | Result | Verdict |
|---|---|---|
| Twin beats chance | AUC 0.714 (taste-led chains 0.839) | holds |
| Twin beats raw Qloo popularity | 0.714 vs 0.786 | fails |
| Taste adds signal among equally busy blocks | AUC 0.603 [0.594, 0.611] | holds |
| Taste-led chains beat convenience chains | 0.691 [0.677, 0.704] vs 0.547 [0.540, 0.554] | holds |
| A learned per-trait model adds more | ΔAUC +0.0012 | real but tiny |
The reading: chains mostly open where it's busy, and our correction removes busyness on purpose, so raw popularity wins overall. But among blocks that are equally busy, taste picks the right ones for taste-led brands about 69% of the time (Pret 0.75, Pandora 0.70, Uniqlo 0.69) and does little for convenience brands (Lidl 0.50, 7-Eleven 0.41). So the agent now ranks by busyness first, then by taste. It never sells taste as a replacement for footfall.
Sanity checks
The correction does what it should on negatives. Silver Lake for Peso Pluma drops from the 45th to the 5th percentile, and East LA for Morgan Wallen from 54th to 25th. Compton for Kendrick Lamar rises from 83rd to 99th.
But it also compresses some true positives that raw data had already maxed out:
- Koreatown for Korean food: 98th → 70th.
- Mayfair for Rolex: 99th → 66th.
- Le Marais for gay bars: 98th → 64th.
That's the same trade-off the census check found.
5. Building the agent
We started with a hand-written tool loop running on the local Codex CLI. We moved to the AI SDK because it streams properly: text, reasoning and tool parts each get their own state, so the timeline UI could show real progress instead of a spinner.
Picking the model. We compared the free models on our own agent questions and on Artificial Analysis's Intelligence Index (v4.3.2):
- MiniMax M3.1 Flash (index 43) chose the right tools every time and made real live Qloo calls.
- Nemotron 3 Ultra (index 23) answered with fewer tools and no live calls.
- Inkling's free endpoint answers only inside agent harnesses, not over the API, so it was replaced by Gemma 4 31B.
So MiniMax leads, with the others as automatic fallbacks.
Making it fast. The first version took 135 s to answer "find the Silver Lake of Berlin": the model reasoned at length and volunteered extra steps. Two changes fixed it: low reasoning effort for tool-heavy turns, and a playbook prompt with a recipe and tool budget per task type. The same question now takes 10 s and one tool call.
| Task | Time | Tools | Live Qloo calls |
|---|---|---|---|
| Find the Silver Lake of Berlin | 10 s | find_twins | 0 |
| Moving from Silver Lake to Neukölln, where to go | 26 s | find_twins, local_scene ×4 | 11 |
| Where to open a natural wine bar in Berlin | 57 s | opportunity, where_in_city, local_scene, venue_supply | 16 |
| 3-city European tour for Peso Pluma | 13 s | tour, trend | 1 |
| Vibe of Shimokitazawa, Tokyo | 10 s | scene, wiki | 4 |
| Shoreditch of Lisbon | 12 s | list_cities, twins_anywhere | 0 |
What broke, and how we fixed it:
- Public Overpass servers timed out or returned 502 for most of a day. So venue supply now comes from Overture, precomputed per city; Overpass is only the fallback for brand-new cities.
- "Natural wine" is a Qloo tag with almost no heatmap data. Opportunity now falls back to the venue type itself (wine bar) and says so.
- An early tour run fingerprinted Madrid unprompted, which cost 40 Qloo calls. The prompt now only allows
add_citywhen the user names a city. - Early answers read like a lab report — z-scores, cosines, raw coordinates. The prompt now bans them from the visible text. Coordinates go into
geo:links that the UI turns into map buttons, and the result cards carry the numbers. - Stopping a run mid-tool broke the next question, because history held a tool call with no result. The route now drops unfinished tool calls and old reasoning from history, and the last step is forced to be an answer, never another tool call.
- Models send sloppy arguments. We fired every tool with the inputs models actually produce: names instead of ids, "Berlin" instead of "berlin", cities added live, missing optional fields, "natural wine" instead of a venue type. Nine failed. Now every tool accepts live cities, a city the user names is fingerprinted on first use, and free text is matched to a venue kind through Overture's own category names and the Qloo tag it resolves to, not a hand-written list. The one remaining failure is honest: Qloo has too little data for Tokyo, and the agent says so.
- Free models sometimes stall. One run sat silent for three minutes. The route now times out a silent model and hands the run, with the steps already finished, to the next free model.
- Free models send arguments in shapes no schema expects: text wrapped as
{"$text": …}, lists as JSON strings, made-up block types,take: 10when the maximum is 8. A repair step fixes these before validation instead of letting the model retry the same mistake. - The grounding check was too strict and too slow. It rejected "ages 30 to 34" and "333 Lounge" as untraced numbers, and took 110 s on a large report. It now checks only numbers that matter (charts and headline values) against a sorted index: 0.4 s for 240,000 numbers.
- The storage store was suspended two days before the deadline. All the caching blew through Vercel Blob's free operation limit. We moved to Upstash Redis, gzipped large values and cached only the condensed heatmap cells instead of Qloo's full answers: 82 MB became 31 MB.
- Reports were too slow on free models: 2–7 minutes, and twice they hit Vercel's 300 s limit with no report. Past a step or time budget the agent may now only chart and write, then must write; a model that stops early is asked once more. With Gemini first, reports take 11–20 s.
- The opportunity map once picked a shopping centre. One busy block can spike on any taste, so a block now has to share the taste with the blocks around it, and the shortlist allows two blocks per neighbourhood.
- New cities came back with no neighbourhoods when OpenStreetMap's servers timed out. Qloo's own locality list now runs in parallel, and city builds dropped from ~150 s to ~45 s.
Challenges
- Proving Qloo was necessary. Our first headline claim, "Twin beats an LLM at finding twins", turned out to be false. So we tested what an LLM can't fake: where real businesses open, and whether the places a plain AI names exist. Taste helps among equally busy blocks; it doesn't replace footfall, and the product says so.
- Measuring without circularity. Checking Qloo-built fingerprints against Qloo heatmaps proves very little. The census, the published pairs and the chain locations are all outside Qloo.
- Free tiers. OpenRouter's free models allow 50 requests a day per account, and a report uses 10–16. Every data call is cached so the AI budget goes on reasoning, not refetching.
What we learned
- Raw taste data is a popularity map with signal underneath. You have to subtract the crowd before comparing places.
- On famous questions, an LLM's memory beats data. Data matters for the long tail: the block nobody has written about, or the pin you drop yourself.
- Pre-registering labels made the bad results easy to accept. We couldn't argue our way around them.
- A report is only as good as its numbers. Checking every chart value against the tool output caught more bad answers than any prompt change.
What's next
- Fix the affluence blind spot by adding a separate wealth axis instead of subtracting it away.
- Add foot-traffic data, so busyness comes from visits and not from venue counts.
- Track a report's recommendation over time: did the place open, and did it last?
Built with
Qloo Insights API (heatmaps, location insights, audiences, demographics, compare, trending, search, tags) · Vercel AI SDK · Google Gemini (3.5 Flash-Lite) · OpenRouter (MiniMax M3.1 Flash, Nemotron 3 Ultra) · json-render · React PDF · Upstash Redis · Overture Maps Places · DuckDB · OpenStreetMap (Nominatim, Overpass) · Wikipedia / Wikidata · Tavily · Python · Next.js · MapLibre GL · deck.gl · Tailwind · shadcn/ui · Recharts · Model Context Protocol · US Census ACS 2023
Built With
- deck.gl
- duckdb
- maplibre
- mcp
- minimax
- next.js
- openrouter
- openstreetmap
- overture-maps
- playwright
- python
- qloo
- react
- recharts
- shadcn-ui
- tailwindcss
- tavily
- typescript
- us-census
- vercel
- vercel-ai-sdk
- vercel-blob
- wikipedia
