Inspiration
When we talked with the emerging tech lead for San Antonio, Geoffrey Urbach, he stressed that one of the largest problems facing cities is time. Agencies within a city often spend months trying to agree on a unified plan. This gave us the idea to use agents to get a proposal 90% of the way there, so that agencies can start work while humans work out the last 10%. Additionally, he mentioned that San Antonio struggles with car dependency, which is exactly the problem that transit-oriented development (TOD) aims to solve.
We have also been interested in TOD and urbanism for a while, and we know the benefits that come with it. Building homes, shops and services within walking distance of good transit leads to better health and wellbeing, as well as more small-business activity. However, the planning process behind TOD is slow, split across many agencies, and difficult for residents to follow. Thus, we wanted to build a tool that speeds up this process while also making it easier for everyone involved to understand.
What it does
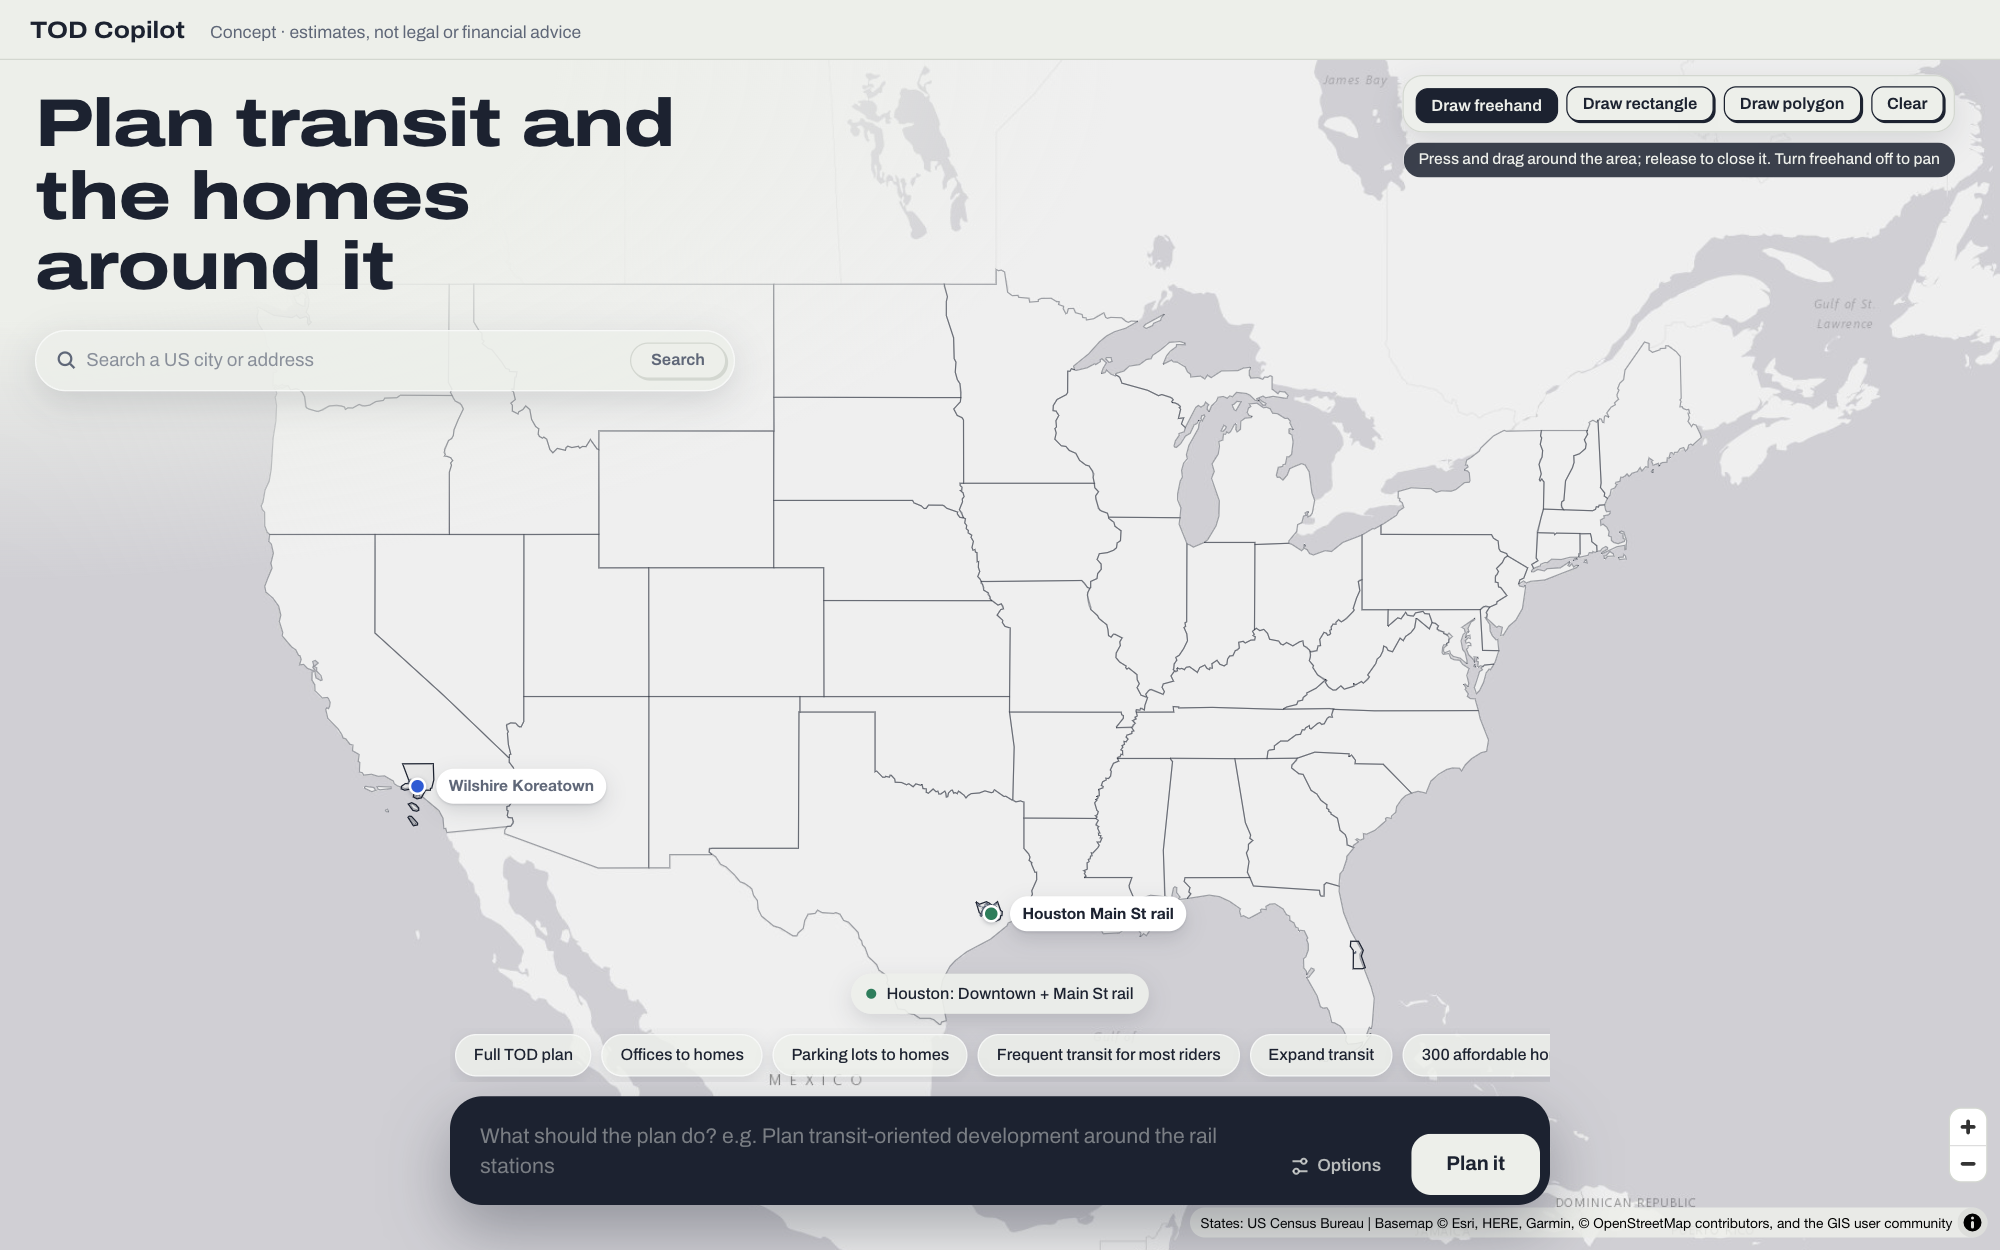
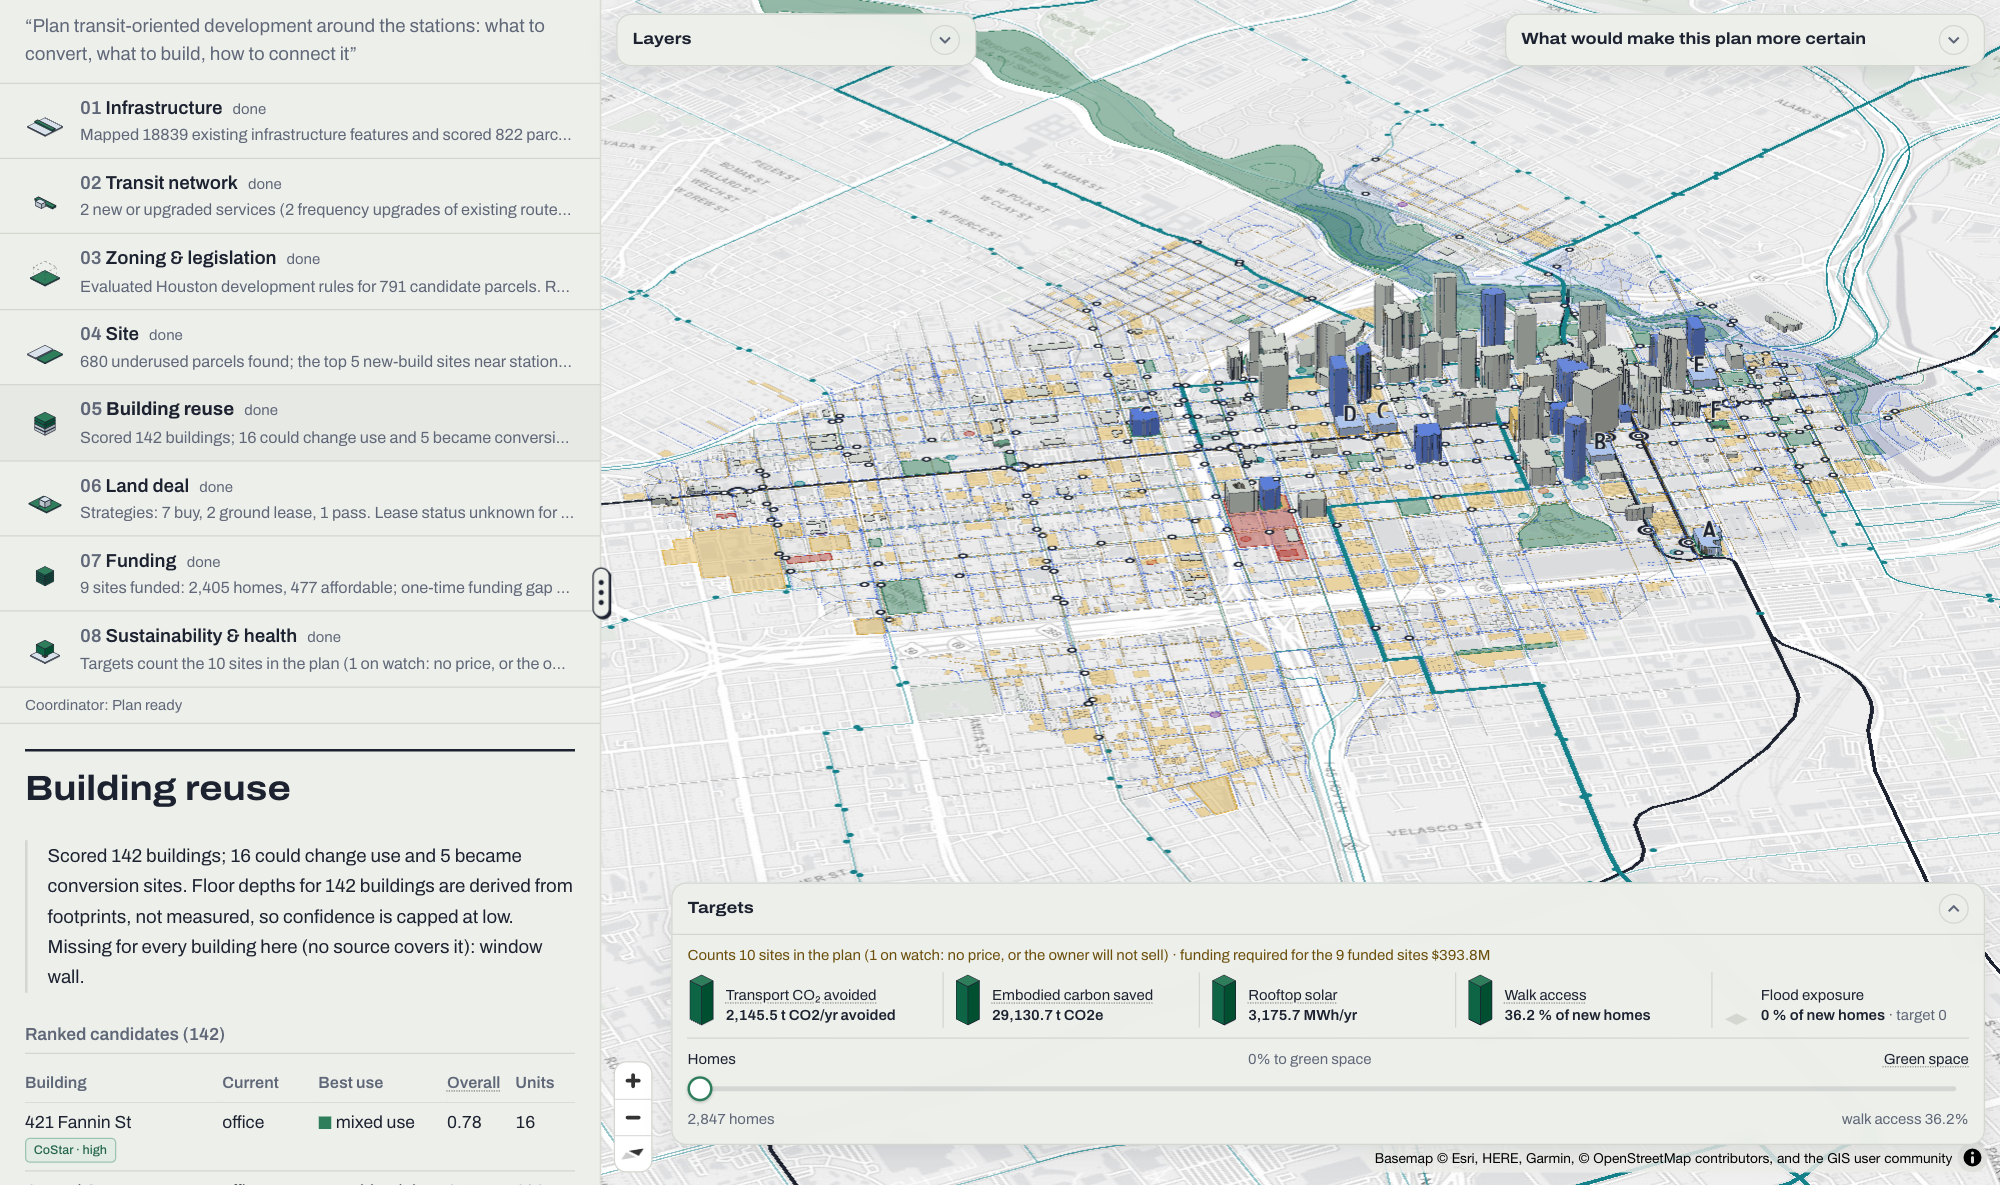
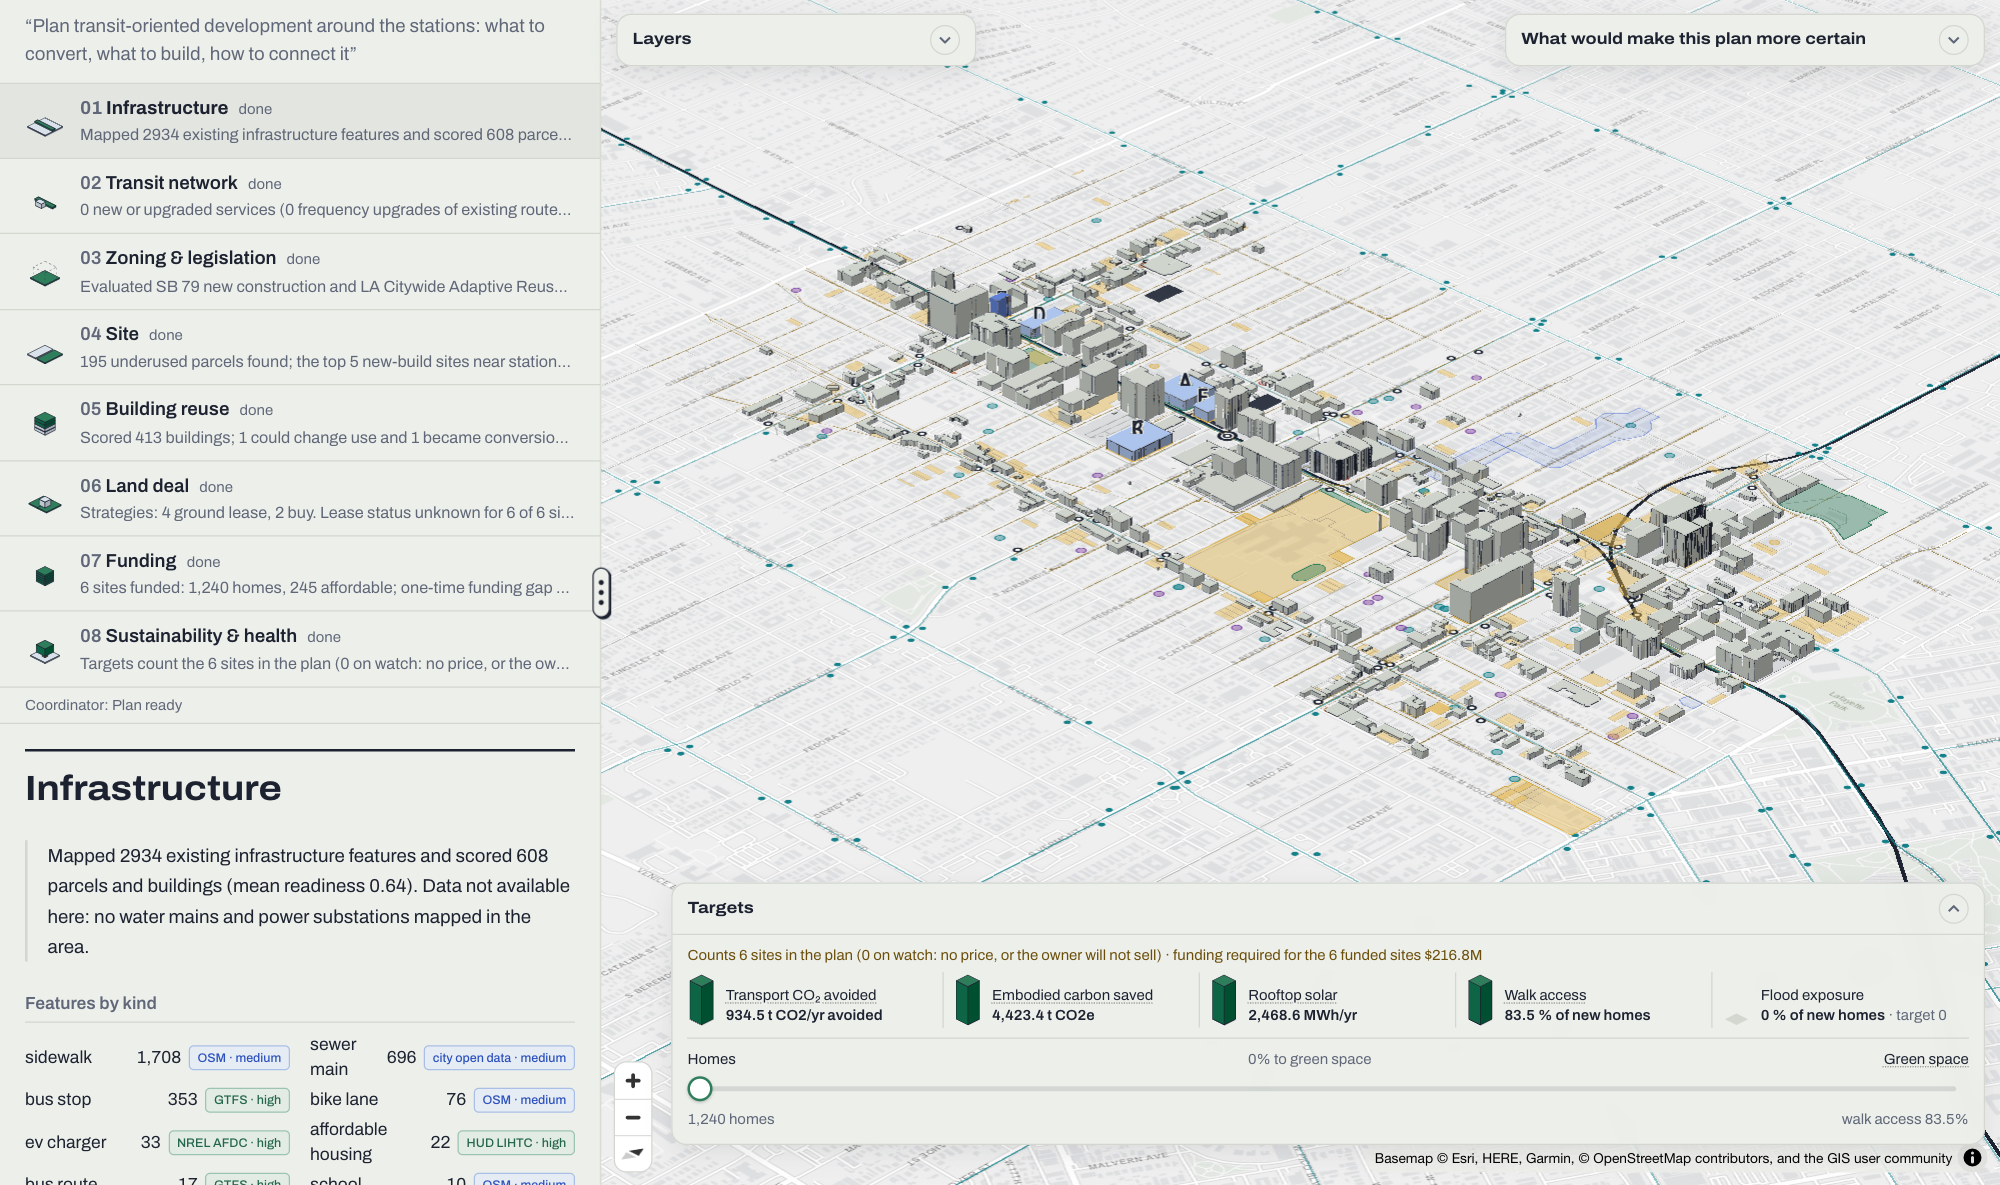
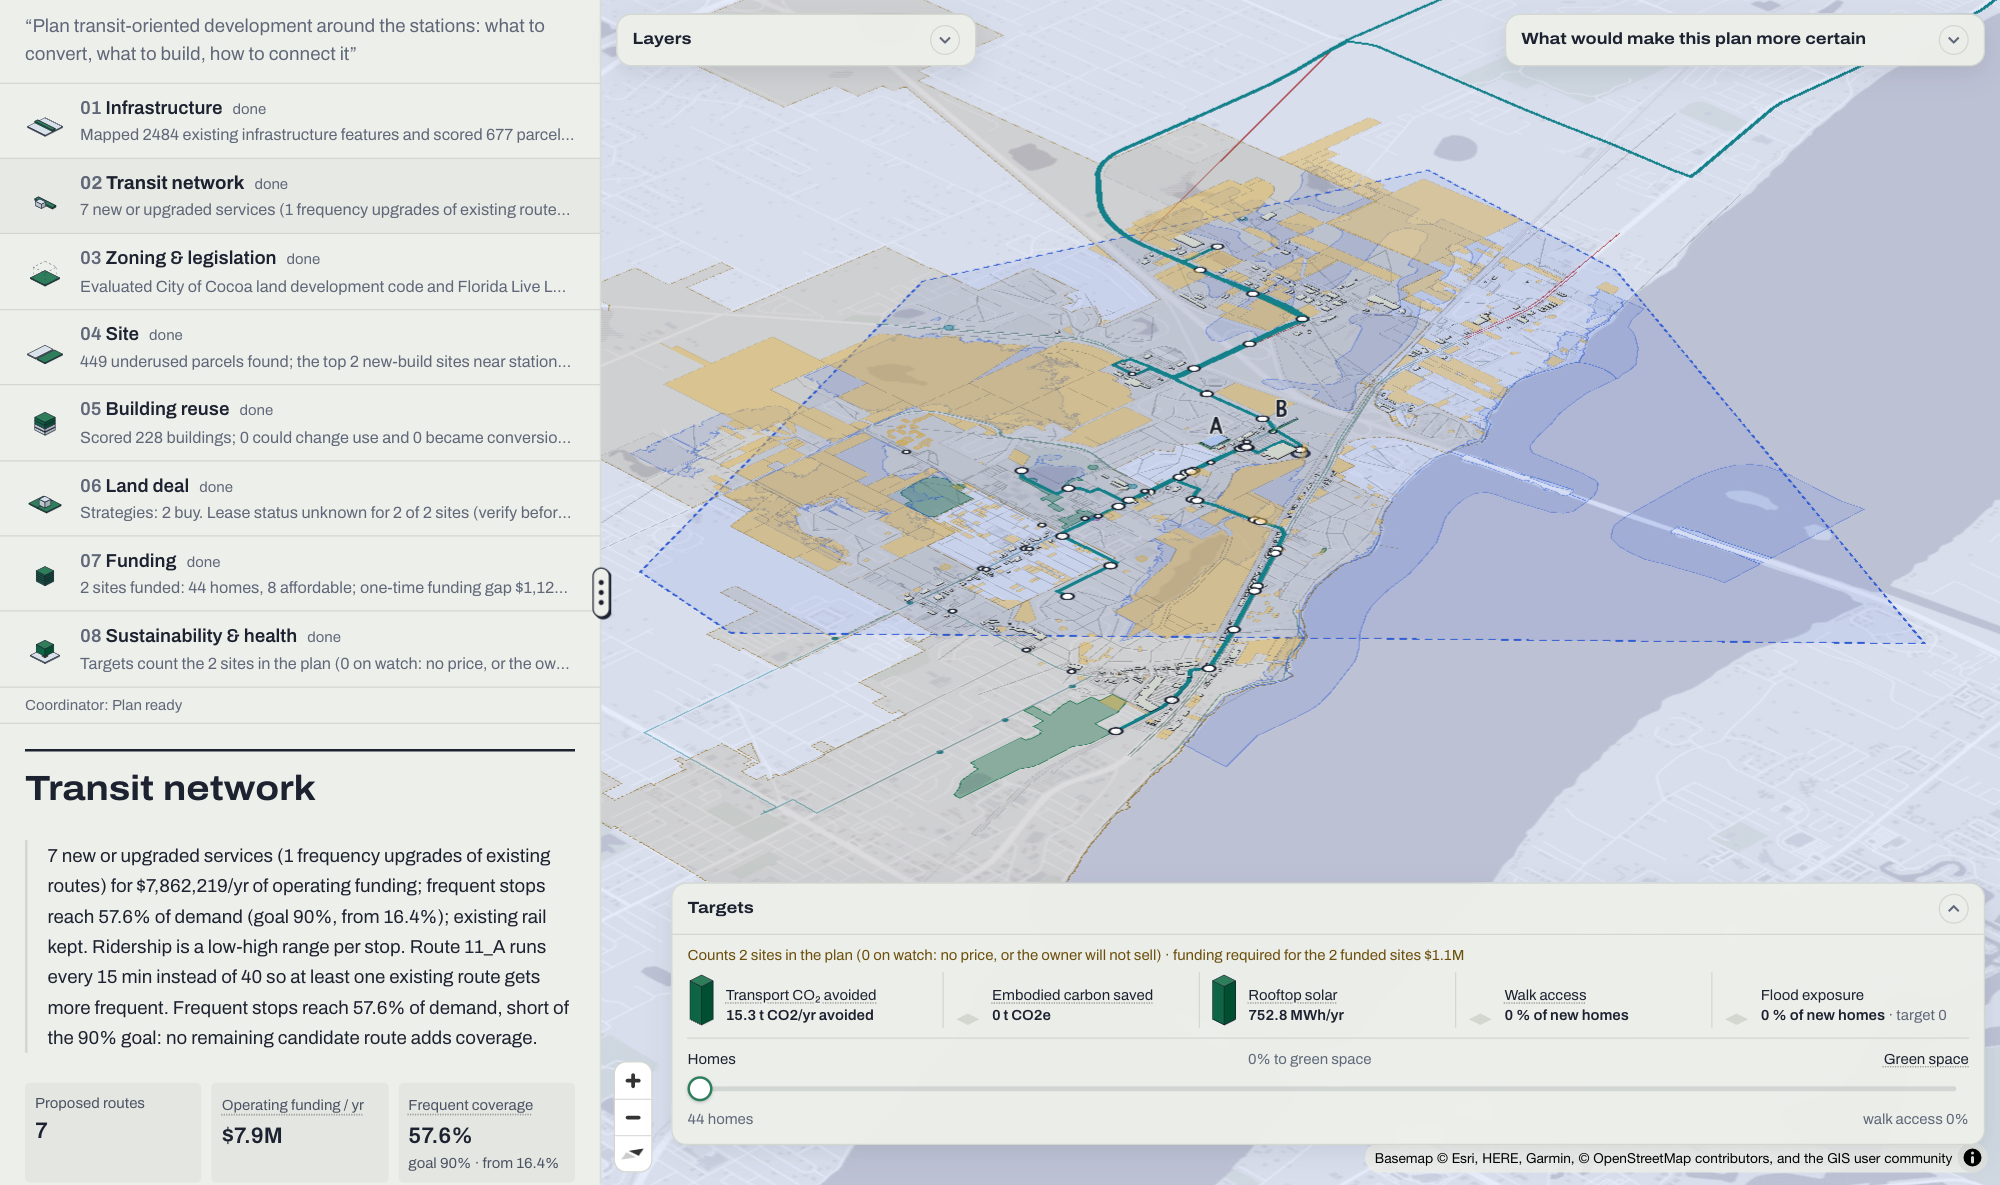
Transitor lets a user type in a place or draw an area on the map, and from there it produces a complete station-area plan. The plan includes the transit and infrastructure that already exist, the buildings that could be converted to other uses, the land that could be built on, what the law allows, how to acquire and pay for the land, and what the plan means for carbon emissions and health.
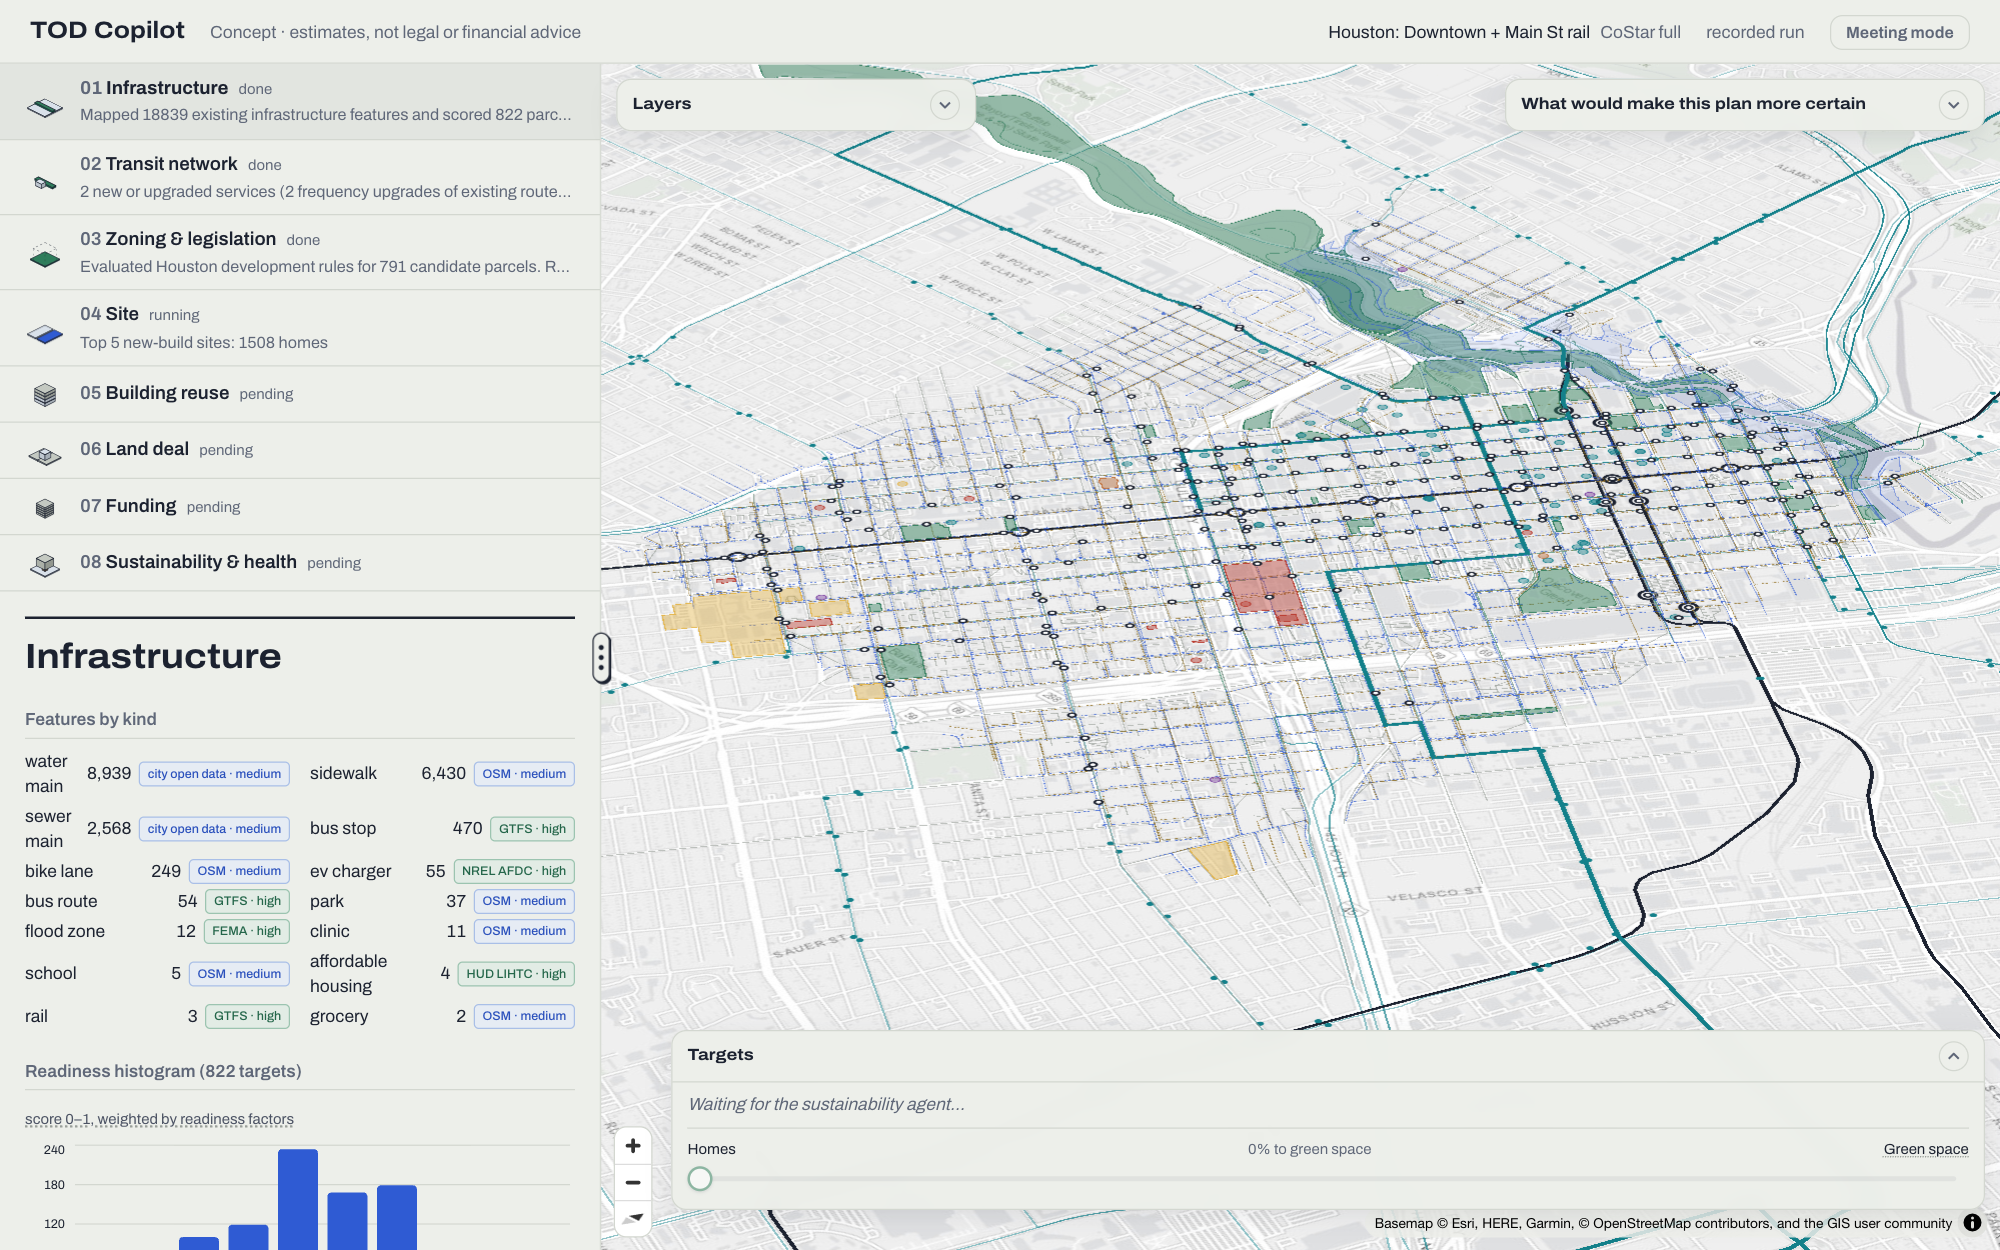
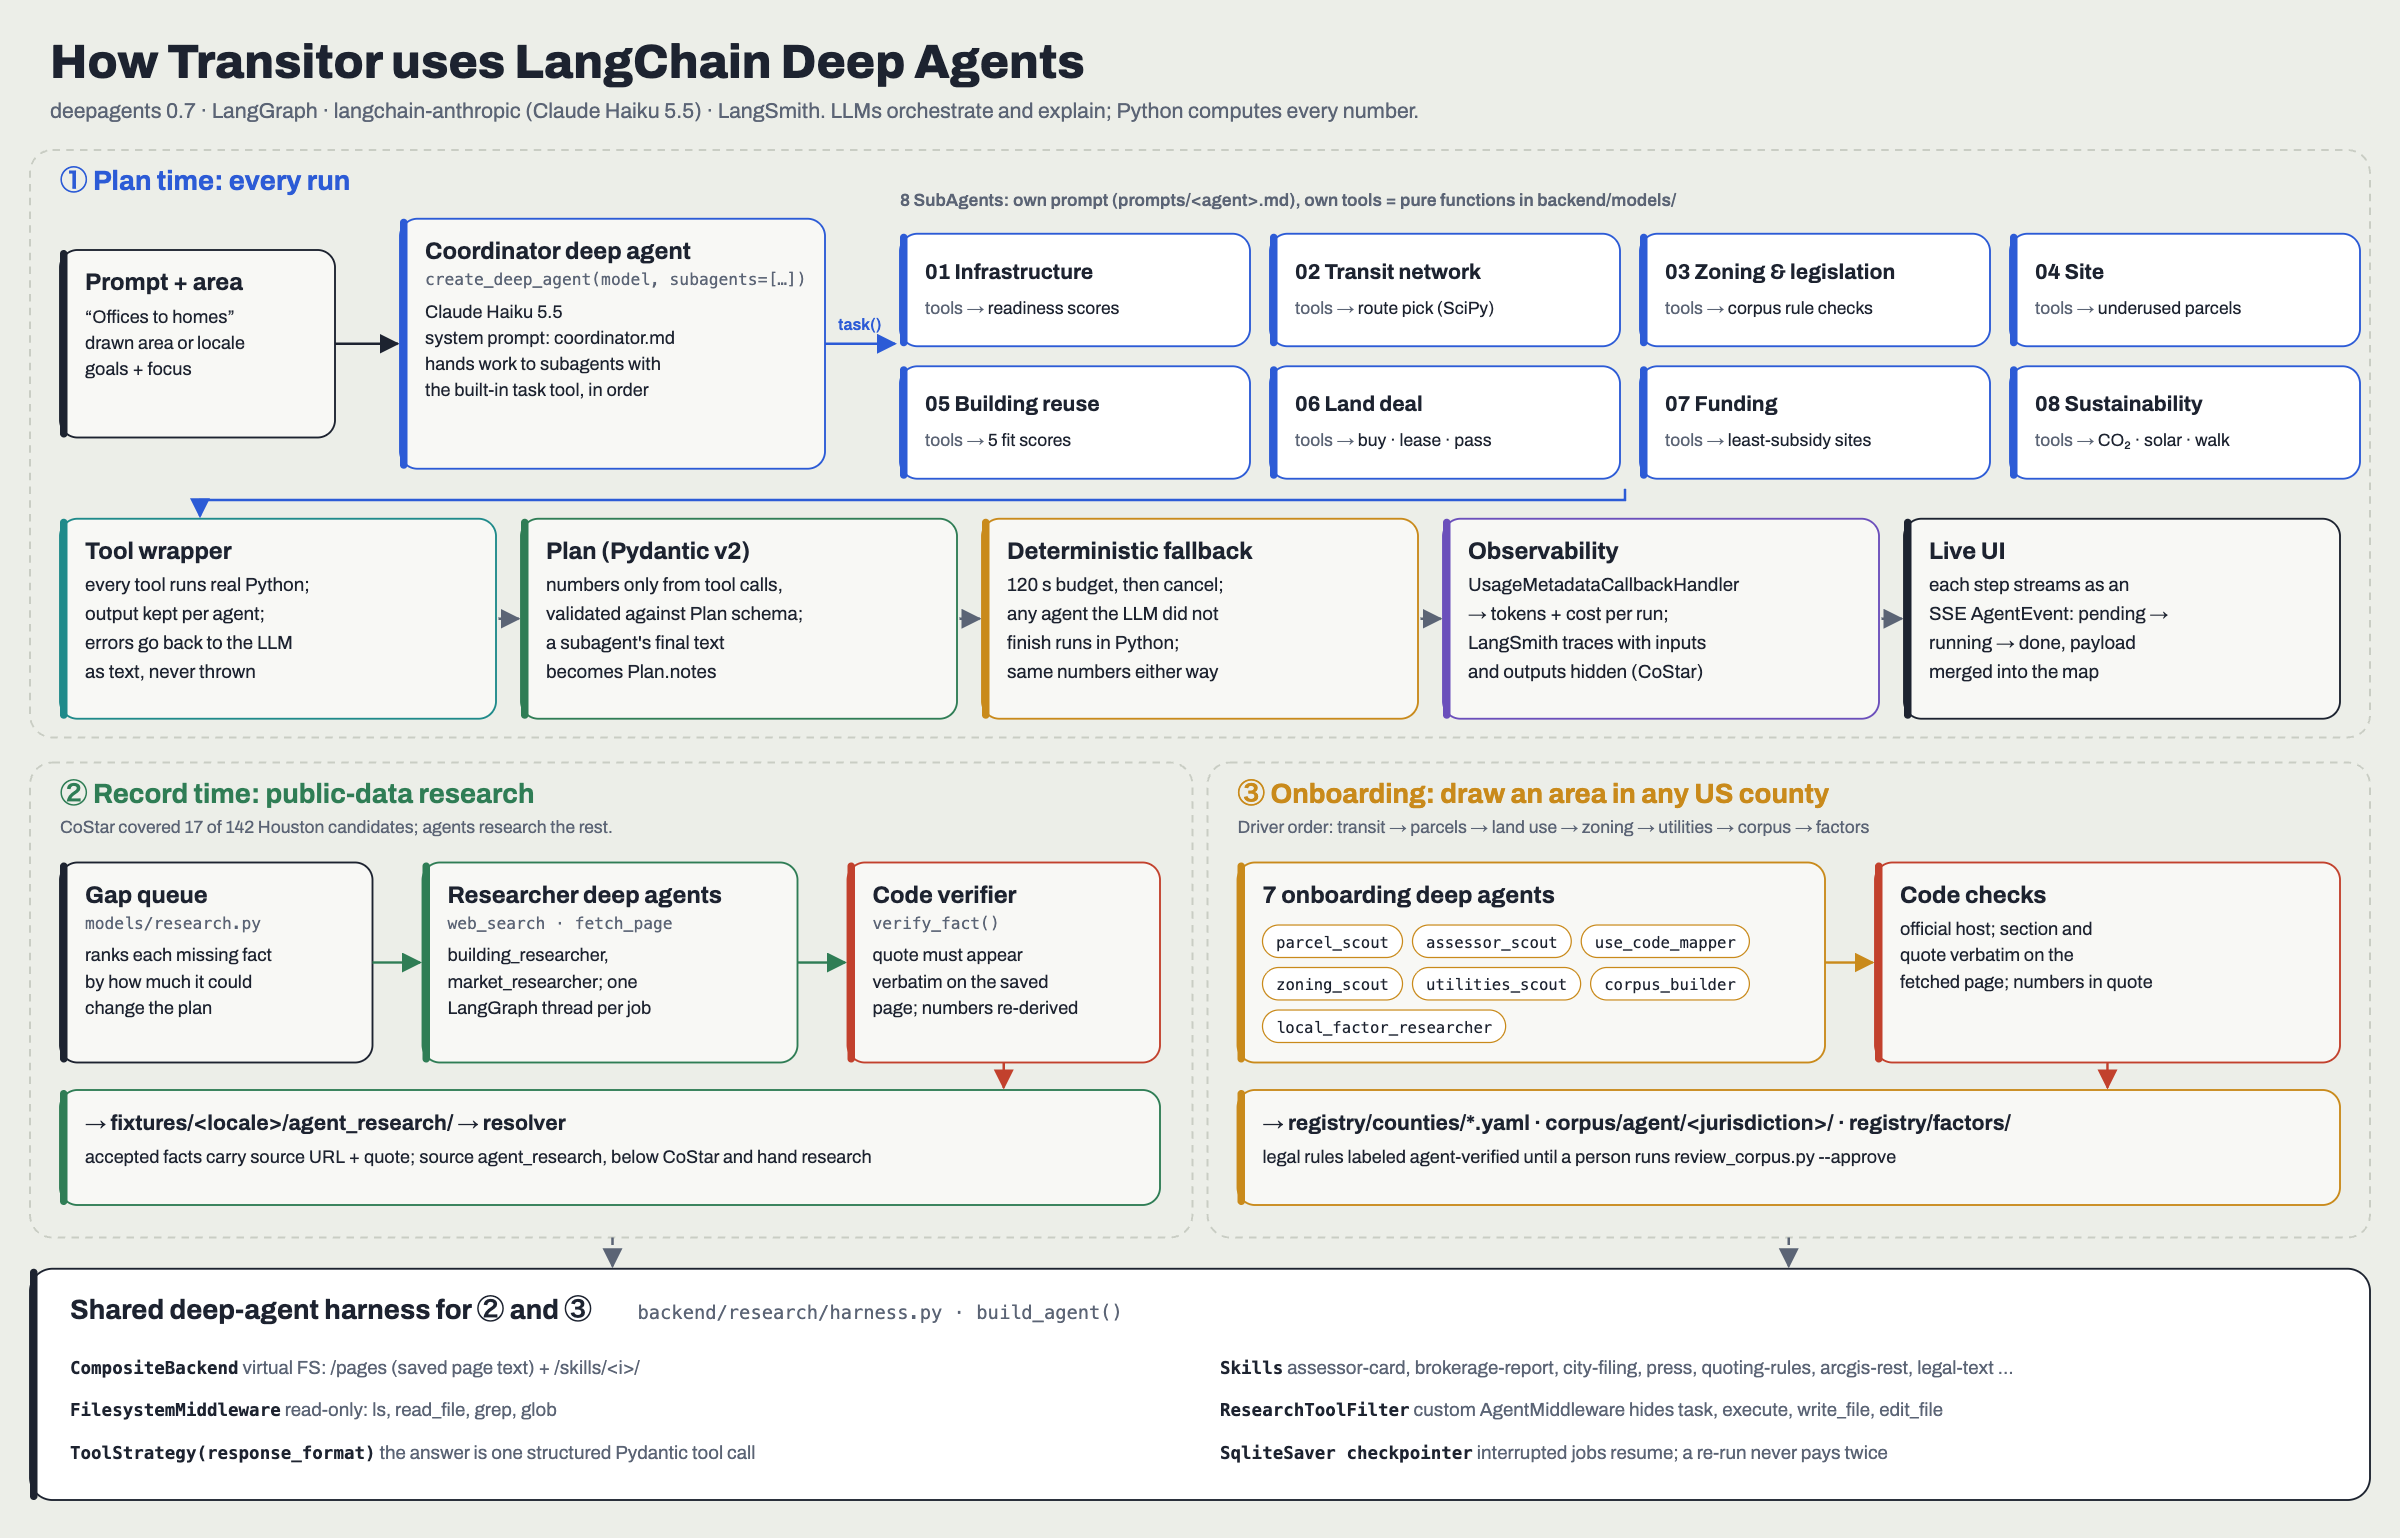
To create this plan, Transitor uses eight Deep Agents, each with a specific role:
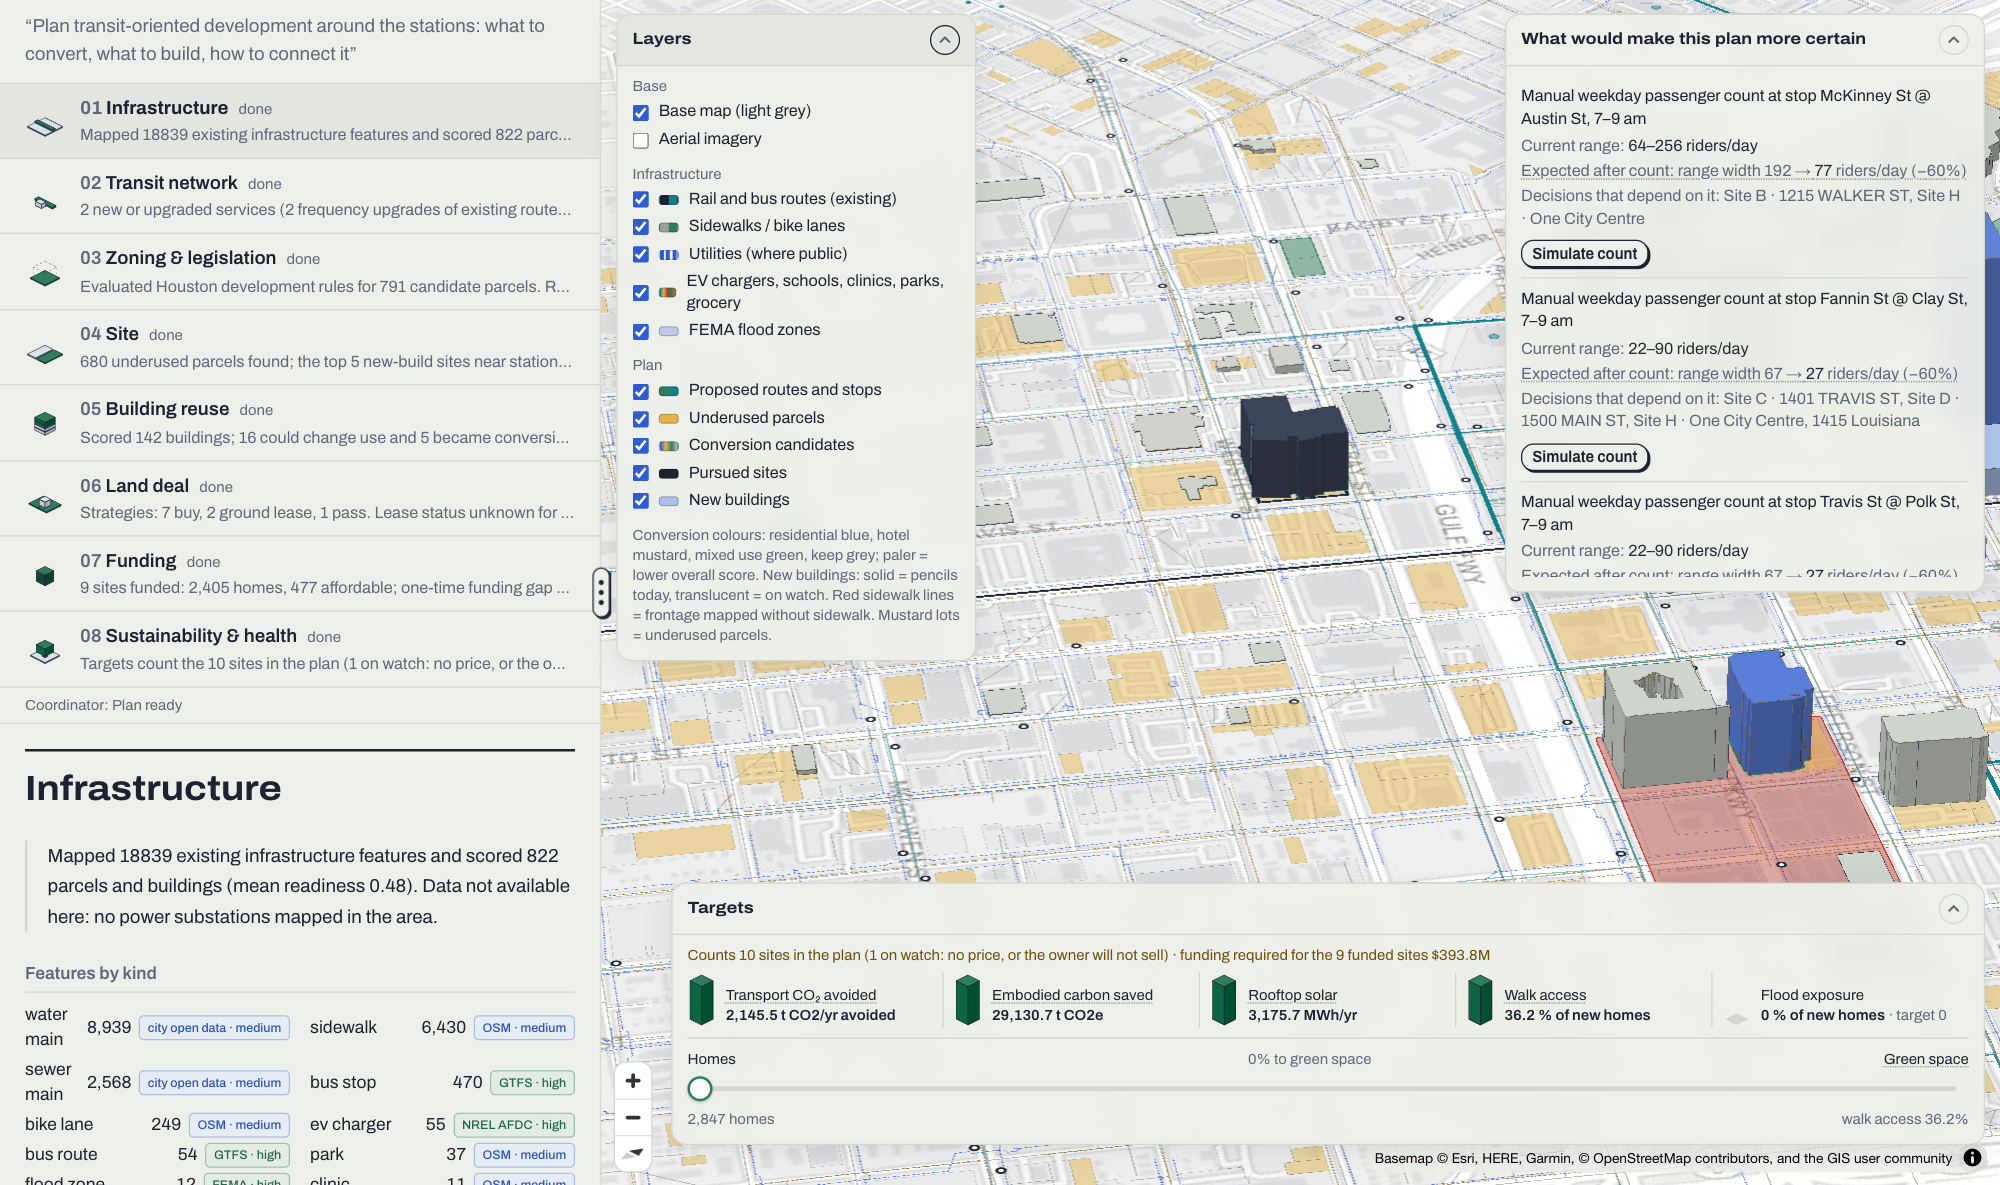
- Infrastructure: maps the existing transit, streets, utilities, EV chargers, broadband, schools, clinics, parks, grocery stores and flood zones, then scores how ready each block is to take on more people.
- Transit network: designs a phased network that starts with on-demand vans, then frequent buses, then BRT, all within a yearly operating budget. Ridership is always shown as a range, and the agent names the measurement that would narrow that range the most.
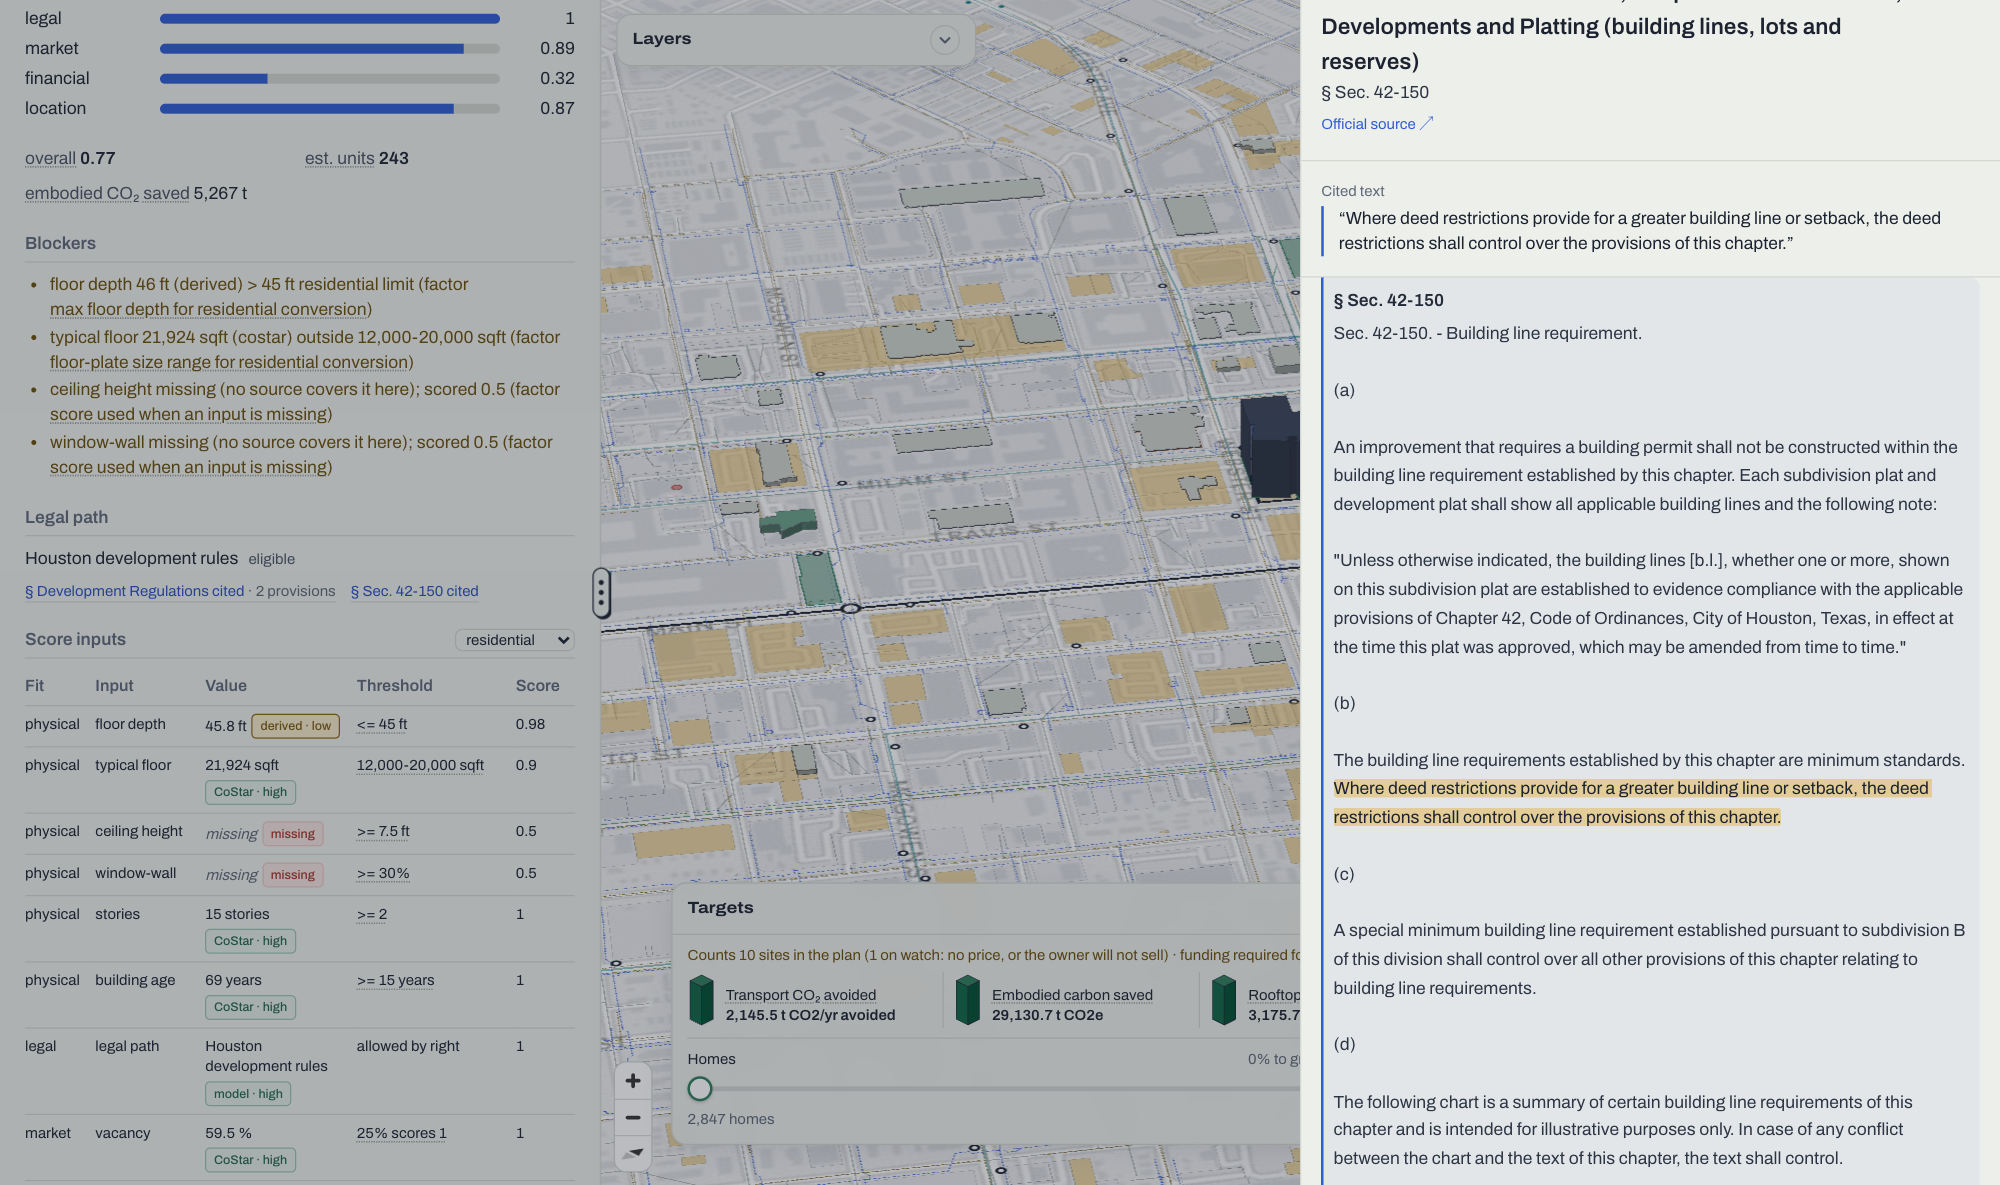
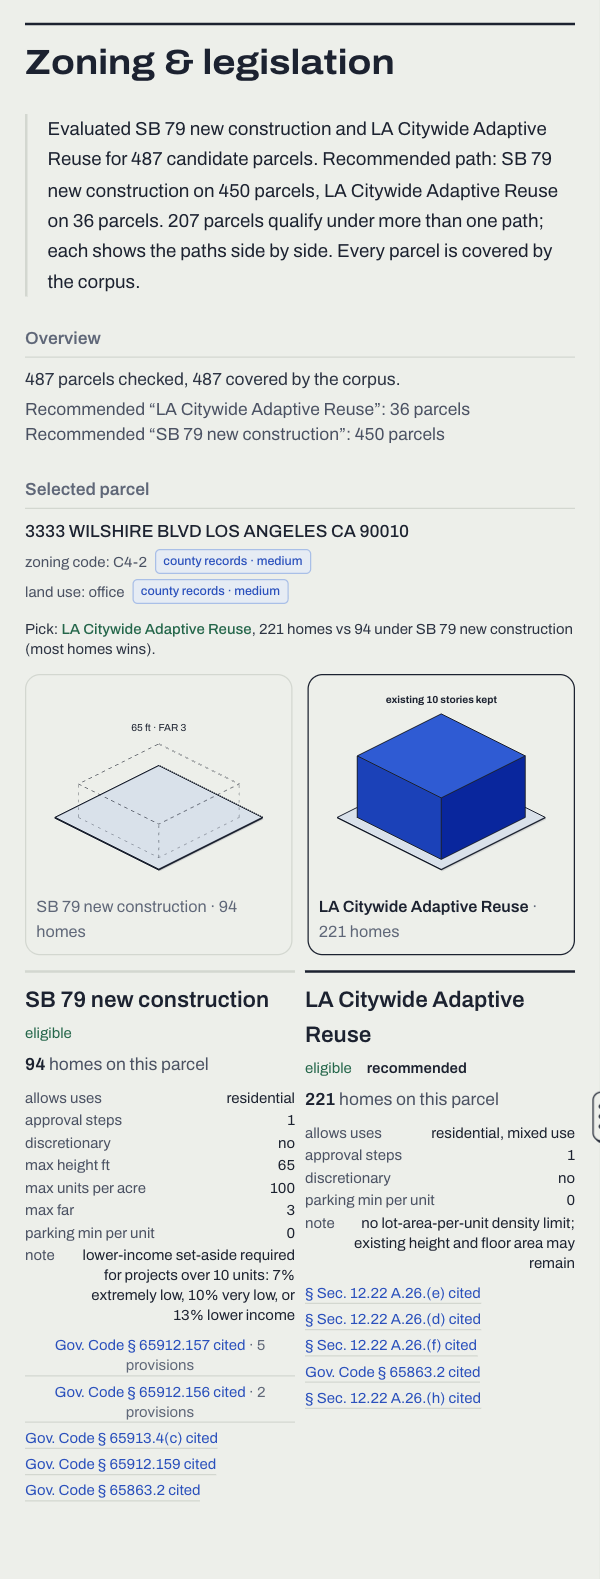
- Zoning and legislation: determines which legal paths apply to each parcel and what each path allows, citing the exact text of the law.
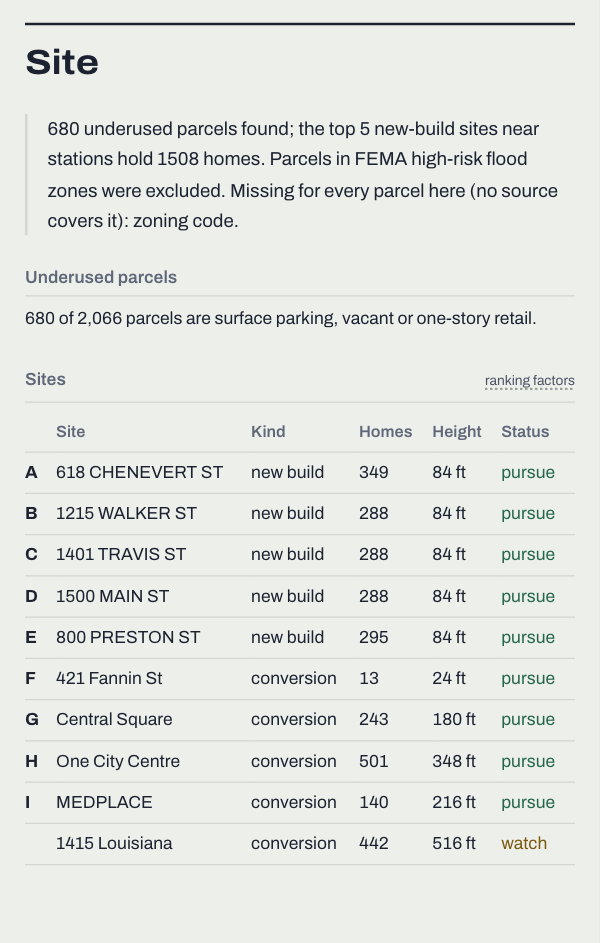
- Site: finds underused land near stops, such as surface parking, one-story retail, vacant lots and lots that could be combined.
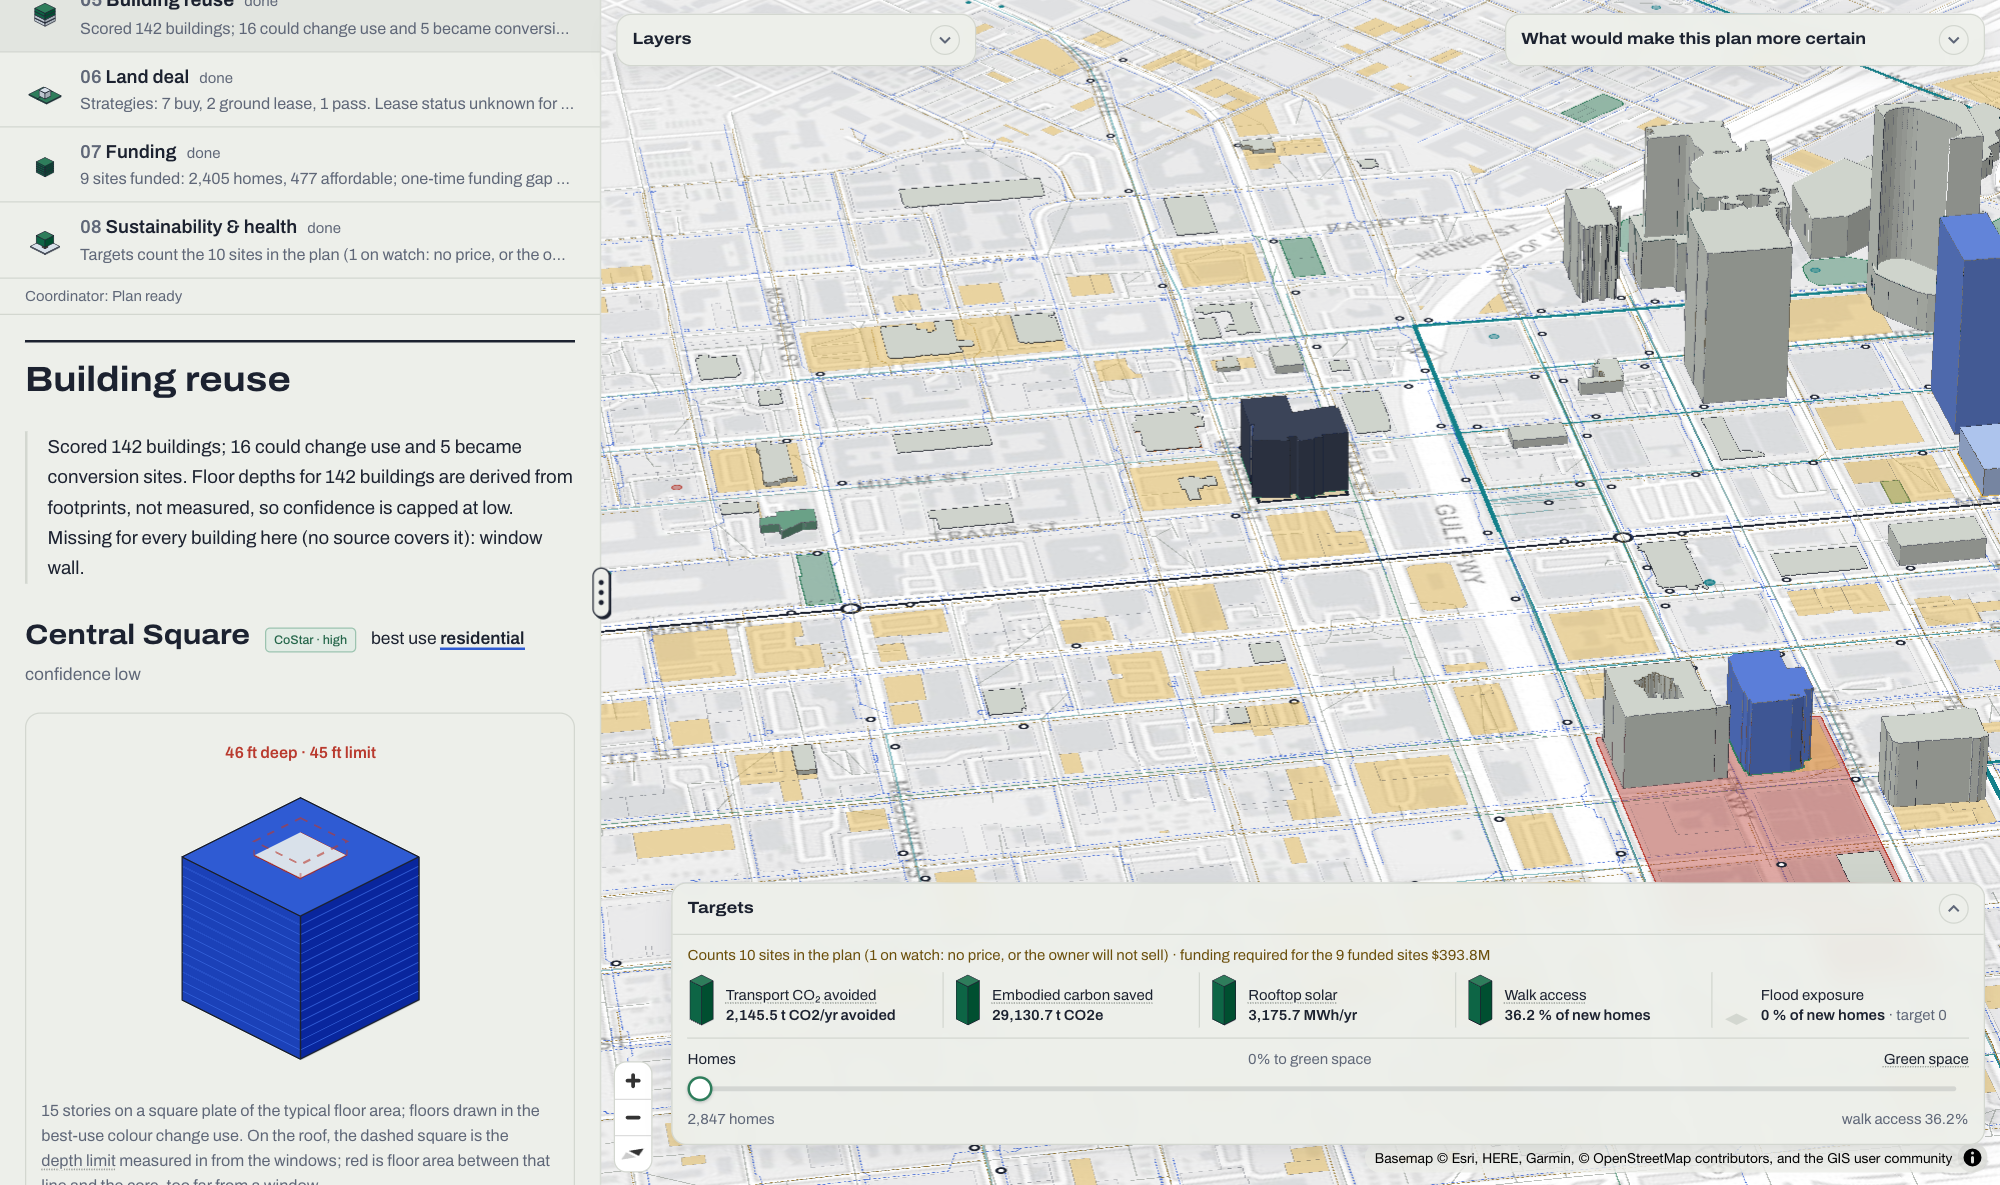
- Building reuse: scores whether existing buildings could become housing, a hotel or mixed use, and lists what is blocking each conversion.
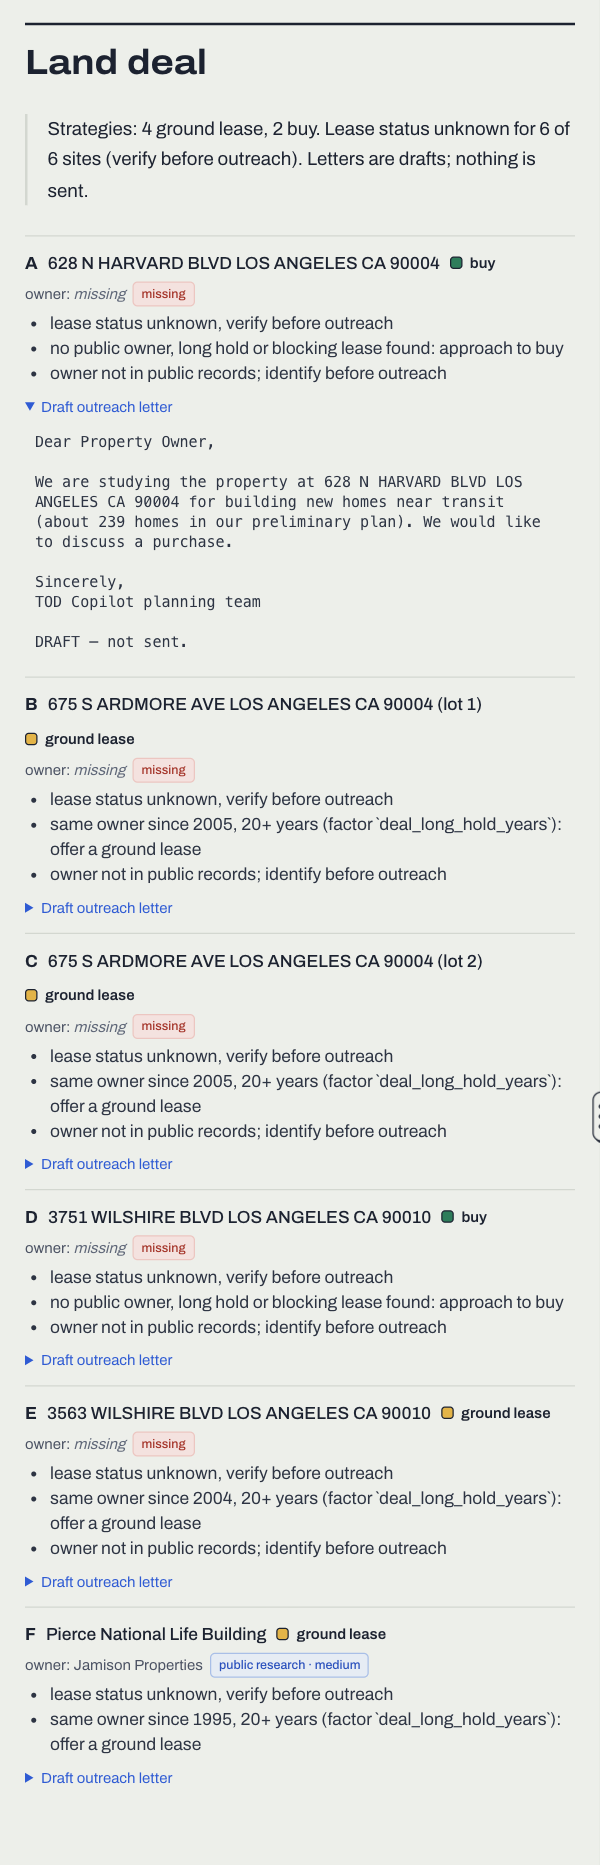
- Land deal: recommends whether to buy, ground lease, partner with the transit agency or pass on a site, and drafts letters to owners. However, nothing is ever sent.
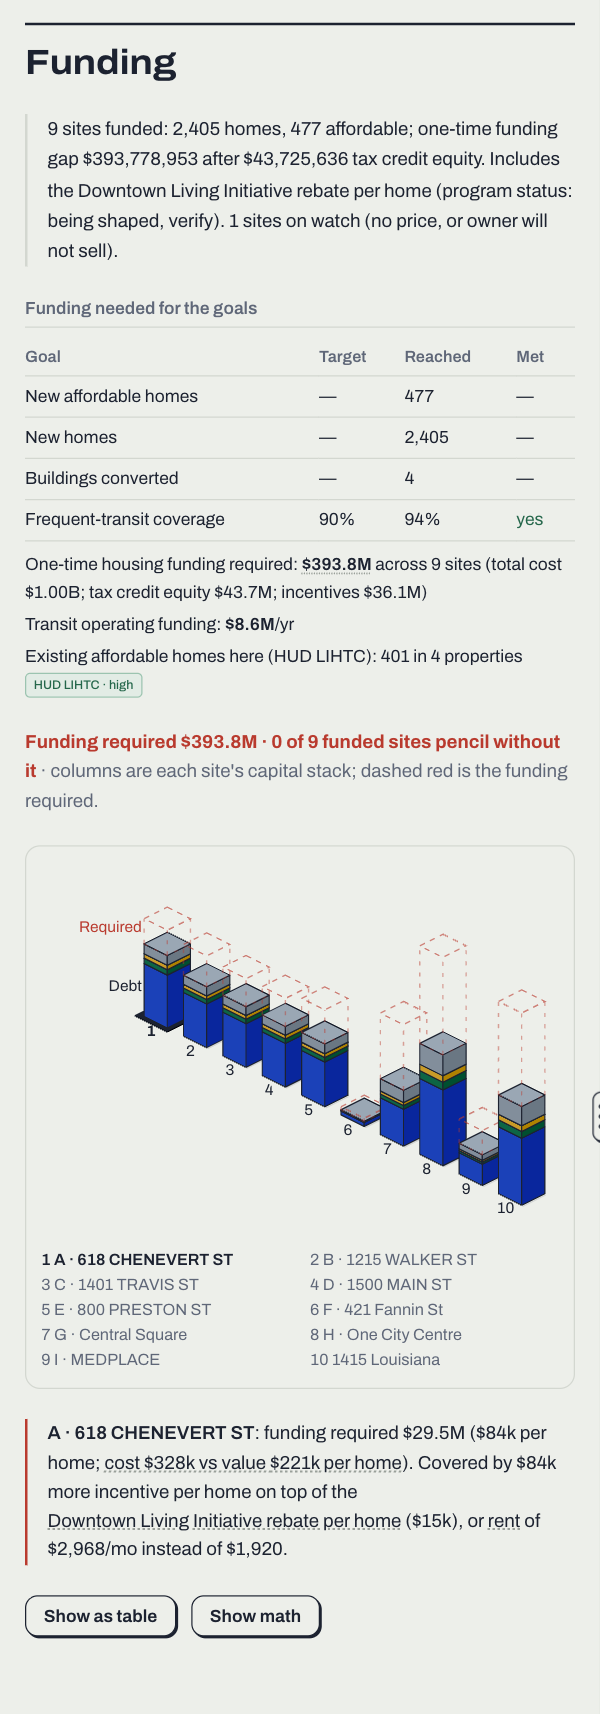
- Funding: takes in the user's goals, such as affordable homes, total homes, conversions and frequent-transit coverage, and picks the sites that reach those goals with the least public funding required.
- Sustainability and health: scores transport CO₂, embodied carbon saved by reusing buildings, rooftop solar, 10-minute walk access and flood exposure.
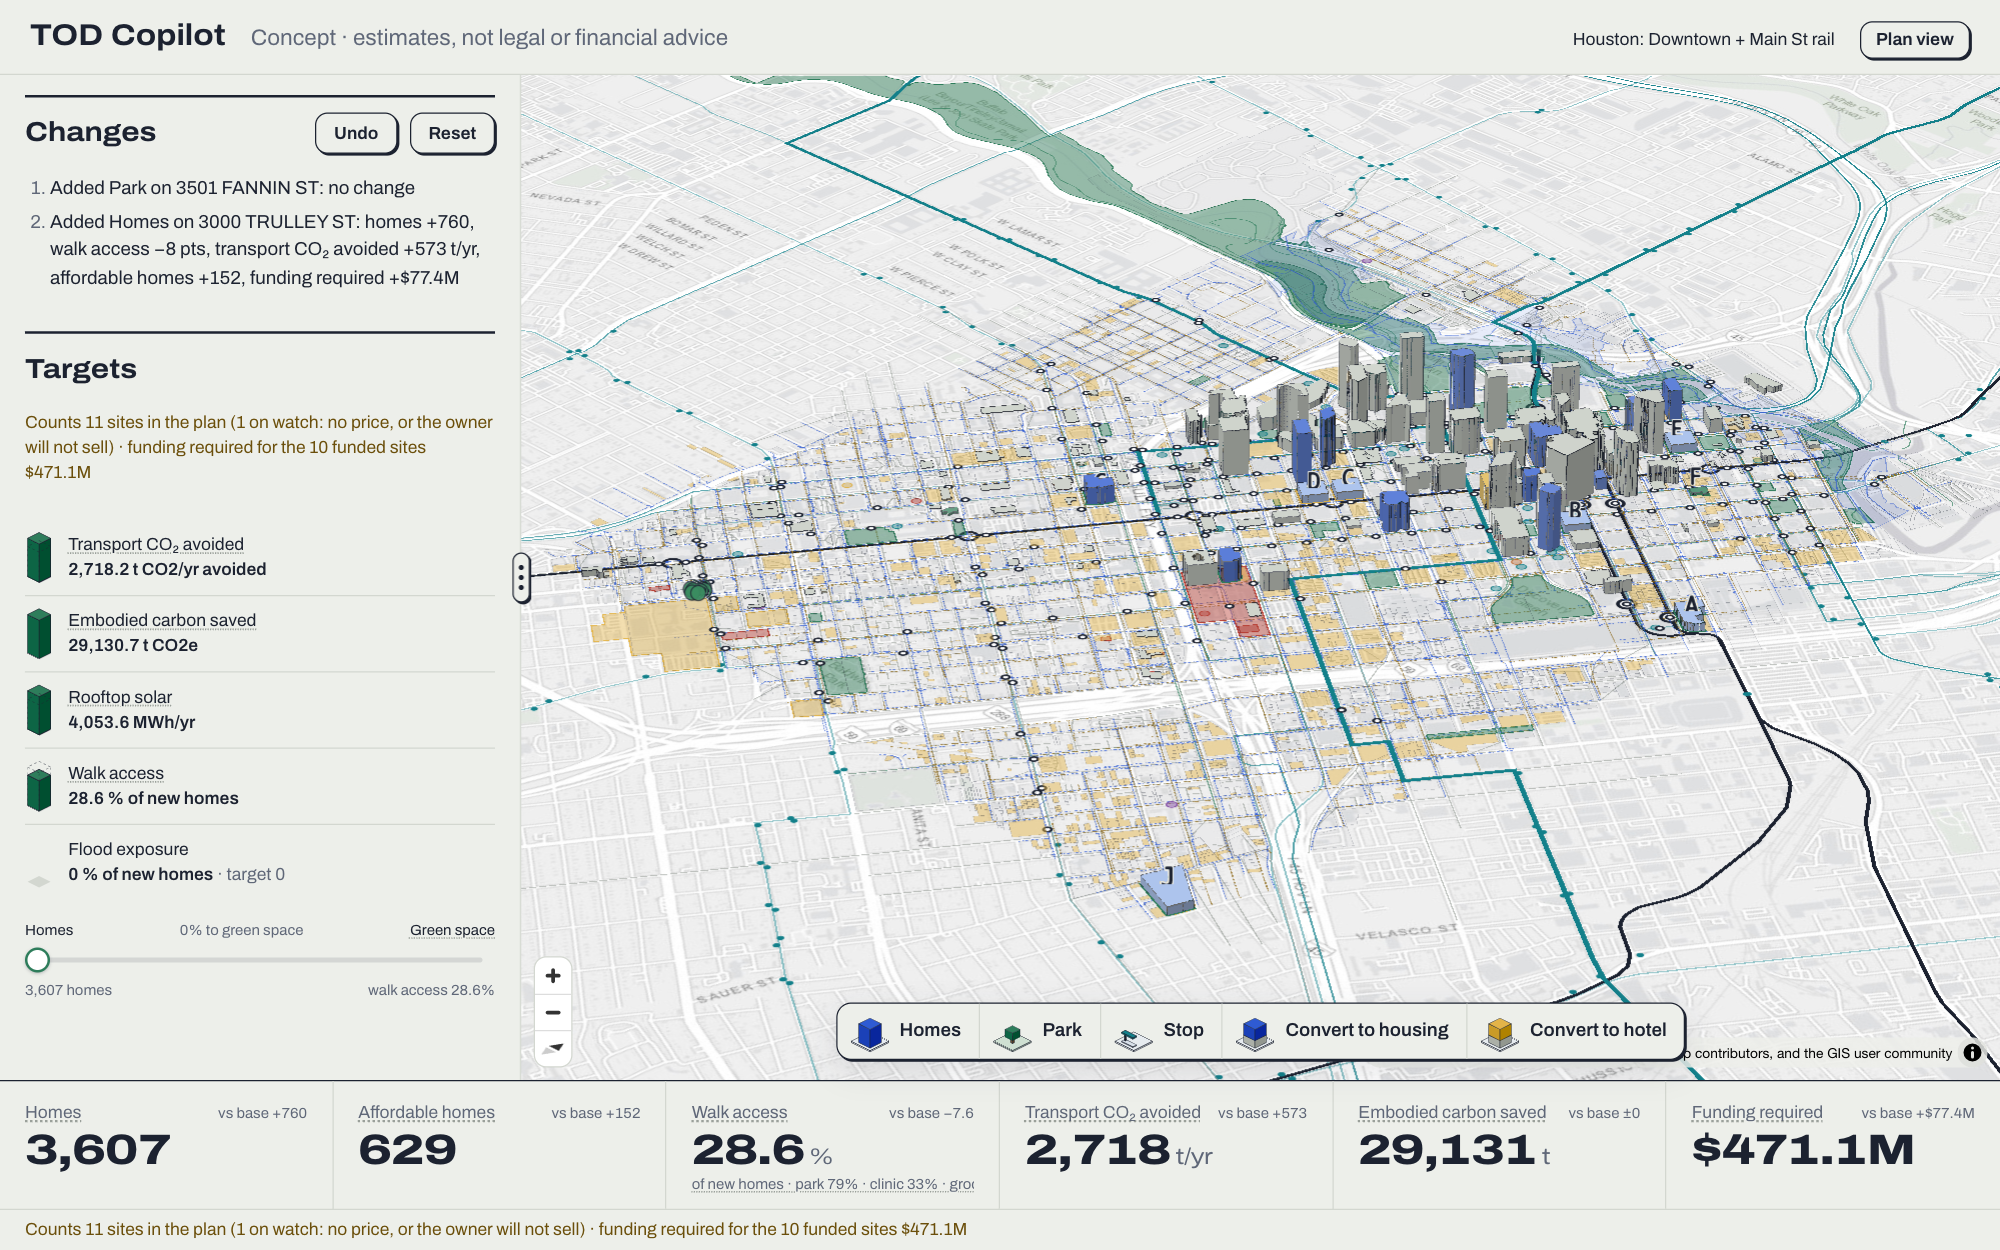
Once the plan is created, city planners are able to reshape it themselves. Edit mode is a large-type, touch-friendly view designed for a projector or tablet. In it, anyone in the room can drag homes, parks, stops or conversions onto the map, and the plan re-scores in under a second. In addition to edit mode, the uncertainty queue lists the cheapest measurements that would make the plan more certain, such as a manual passenger count at a single stop.
Every number in the plan is computed by code rather than by an LLM, and every value shows its source along with a confidence badge. Additionally, clicking on any legal value cites the law it came from. Thus, users can trust and check that the plan is grounded in real data rather than guesses.
Note for judges: the live site at transitor.us runs on a server with only 2 GB of RAM, so please use the demo areas (Houston, Los Angeles and Brevard County, FL). Creating a new custom area requires more memory than the server currently has.
How we built it
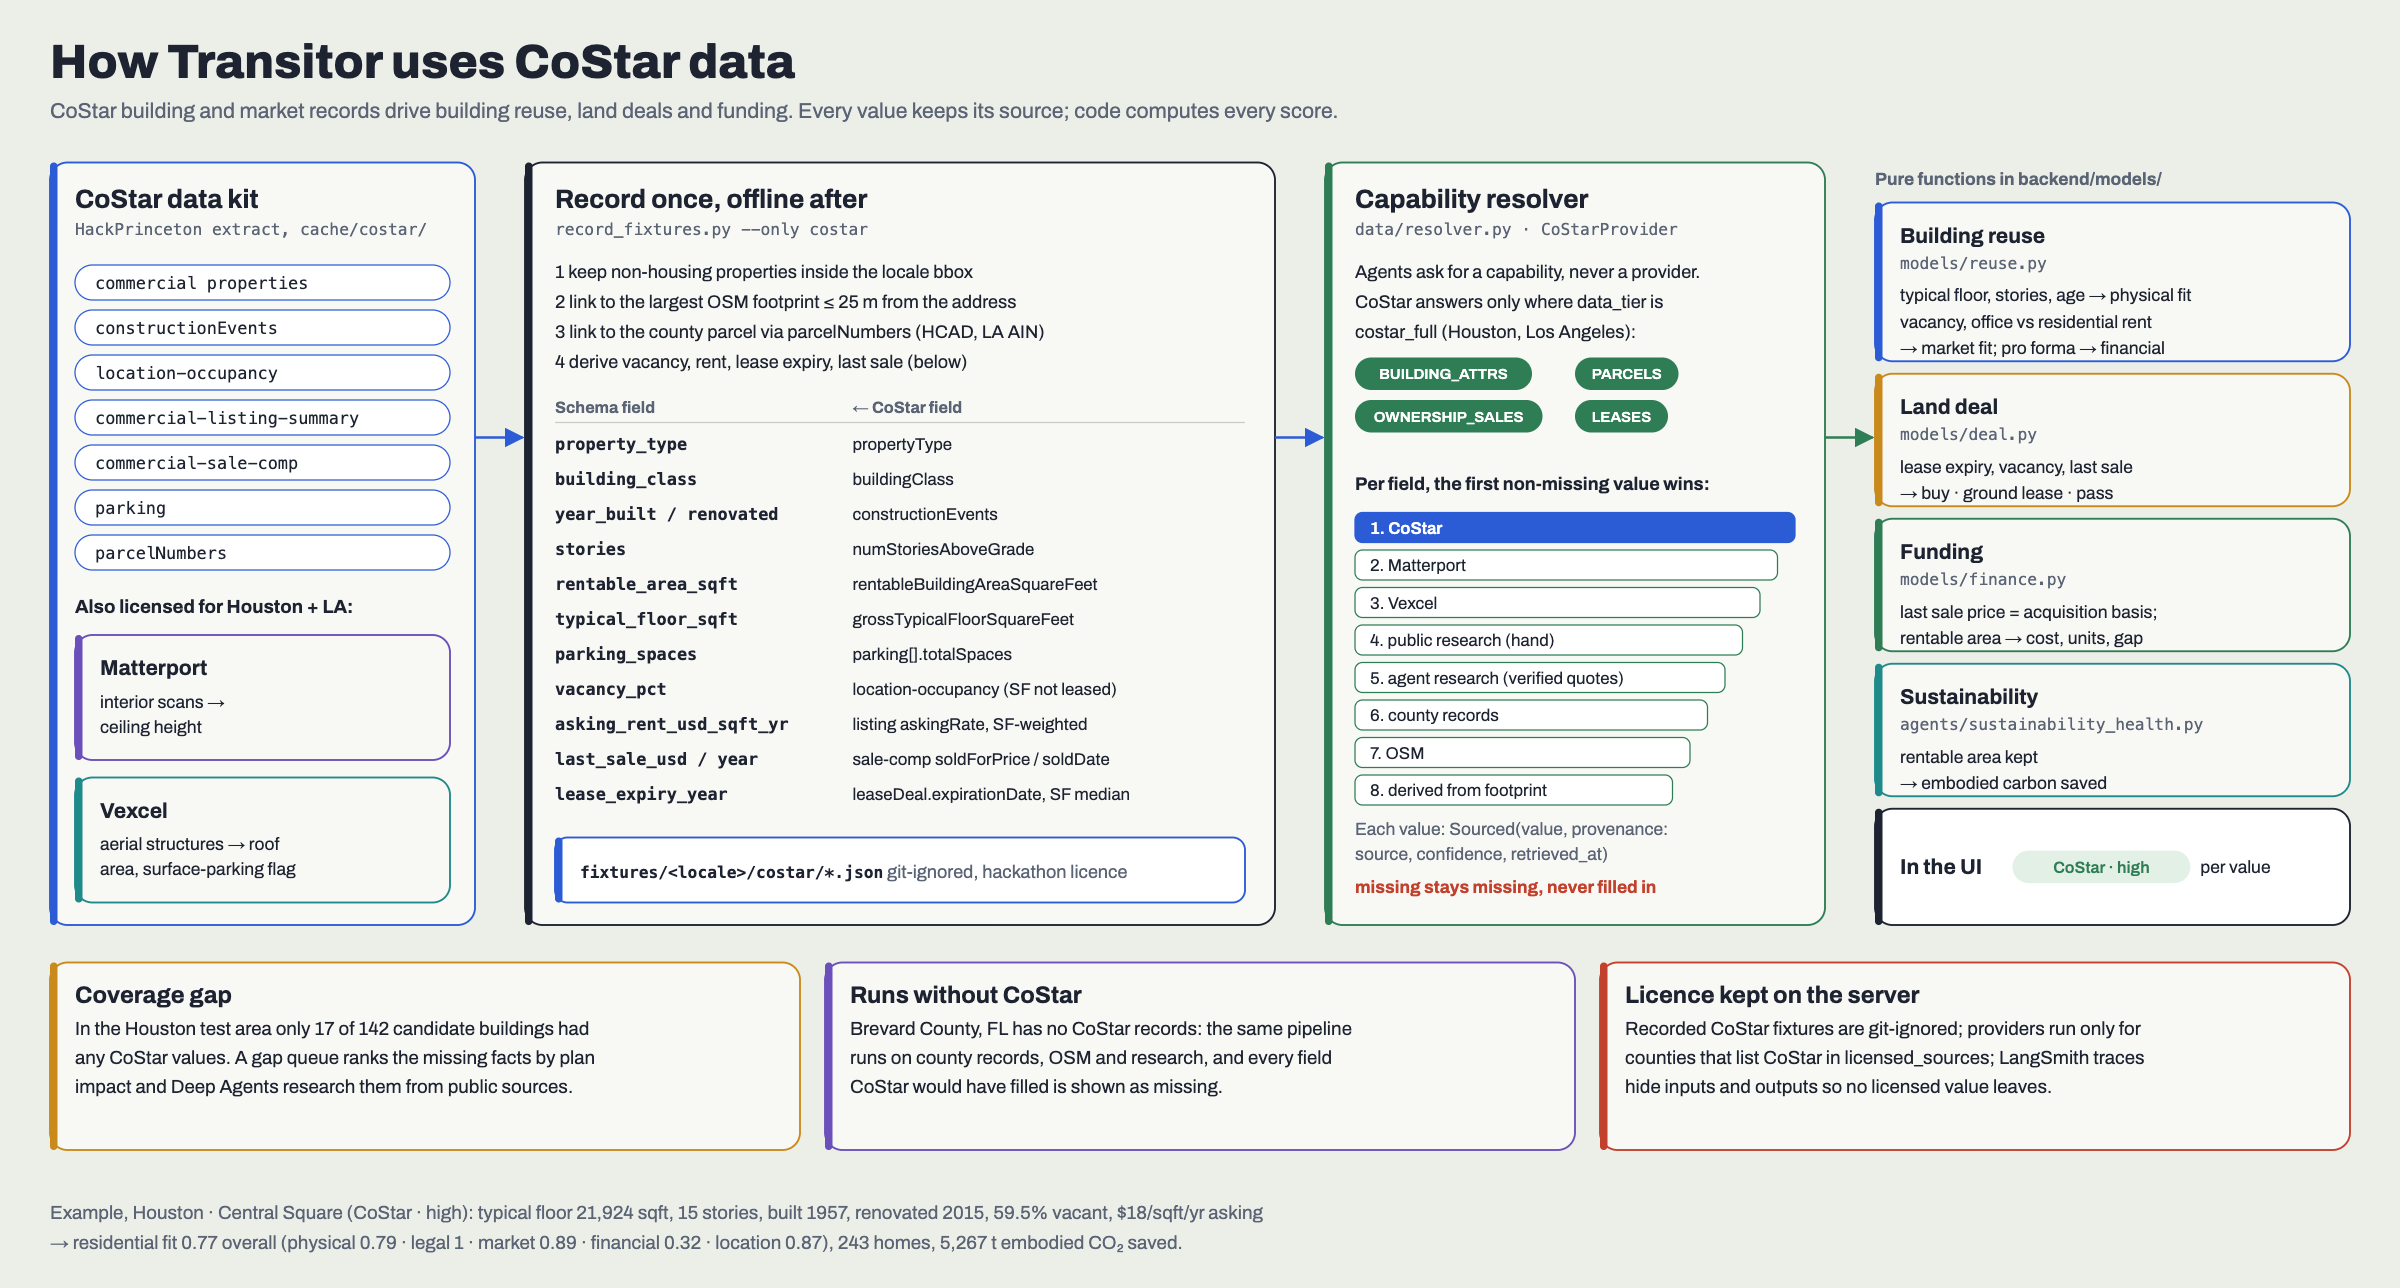
For data, we used CoStar's building and market data, along with Matterport interiors and Vexcel aerial imagery, to score how well existing buildings could be reused. While CoStar is the best source available, it does not cover every building. For example, in our Houston test area, only 17 of the 142 candidate buildings had any CoStar values. Thus, we built a second path that is able to run without CoStar. This path uses LangChain Deep Agents research subagents to search public sources, such as assessor records, city filings, brokerage reports and press articles, for the facts that would change the plan the most. Code then checks each fact, and a value is only accepted if its quote actually appears in the saved source page. Additionally, we used public data from OpenStreetMap, GTFS, the Census, FCC broadband maps, HUD and Zillow. We tested on three locales, each chosen for a specific purpose: Houston tests building reuse, Los Angeles tests overlapping laws, and Brevard County tests the fallback when there is no CoStar data.
For the agents, a Deep Agent coordinator runs the eight subagents in sequence: infrastructure, transit, zoning, sites, building reuse, land deals, funding and sustainability. Each subagent's tools are plain Python functions, which means the LLM only orchestrates the work and writes plain-language notes. If a subagent fails, the same functions run without the LLM, and the plan's numbers stay exactly the same. In addition to the planning agents, a separate set of onboarding agents runs first whenever someone draws an area in a new US county. These agents find the county's parcels, land use, zoning, utilities and legal documents, and work out its local cost factors.
To choose a model, we benchmarked Claude Haiku 5.5, Sonnet 5.5, Opus 5.5 and Sonnet 4.6 as the coordinator. Haiku 5.5 was the only model that finished every run in time without a fallback, and 93% of the numbers in its notes matched the tool outputs. Additionally, all three test runs together cost only about $0.07. Thus, Haiku 5.5 became our default model.
We used LangSmith to trace every agent run, with inputs and outputs hidden so that licensed CoStar values never leave our server. The backend is built with FastAPI and Pydantic, and it streams each agent's progress to the browser as the agent works. The math, which includes transit optimization, walk routing, finance and carbon, uses GeoPandas, Shapely, OSMnx, NetworkX, NumPy and SciPy. The frontend is built with React, TypeScript and Vite, with MapLibre and deck.gl for the 3D map and Tailwind for styling.
Challenges we ran into
One of the largest challenges we faced was getting the agents to gather the data needed for the plan efficiently. Early on, the agents would research whatever they found first rather than what mattered most. To fix this, we added a queue that ranks each missing fact by how much it could change the plan, so the agents work on the most important gaps first.
Another challenge was keeping the numbers honest. LLMs tend to estimate values, which is not acceptable for a planning tool. Thus, we made a hard rule that every figure must come from code, and we measured how often the agents' notes matched the tool outputs. Through this, we found that the larger models were often slower and timed out, while Haiku 5.5 was both faster and more accurate.
In addition to issues with the agents, we also ran into issues with data access. Some sources block automated access. For example, RentCafe blocked our scripts, so we switched to Zillow's public rent index. This lowered our rent estimates, and the Brevard plan went from one of two sites paying for itself to zero. That is a less impressive result, but a more honest one.
Scope was also a challenge. We initially started with nationwide coverage, but we narrowed it down to two counties in order to get the data right. Afterwards, we built the onboarding agents so that a drawn area is able to work in any US county.
Legal research presented its own challenge as well. While agents are able to draft a legal corpus, the law is not something that can be guessed at. Thus, any source found by an agent is labeled "agent-verified" in the UI until a person approves it.
Finally, the UI design took several iterations. We went through multiple full redesigns before settling on a full-screen map with a floating prompt bar, because a planning tool has to show a large amount of information without overwhelming the people in the meeting.
Accomplishments that we're proud of
We are proud of building an interactive tool that actually works for a real purpose. In edit mode, a user is able to move a single tile and immediately see what happens to homes, funding, carbon and walk access. Thus, the tool is able to succinctly demonstrate the impact of each decision to a planner, a developer or a resident at a public meeting. We are also proud of the UI's polish, especially the detailed 3D models in plan and edit mode.
What we learned
The biggest lesson we learned is that, just like buildings, agents need the proper infrastructure in order to work. In this case, that infrastructure is adequate guidelines and data pipelines. The largest improvements to Transitor came from tighter rules and better data, rather than from smarter prompts or bigger models.
What's next for Transitor
Moving forward, we want to expand Transitor's ability to work outside the scope of CoStar's data with greater accuracy by growing the public-data research pipeline. Additionally, we want to bring more counties on board with reviewed legal sources and run Transitor on a server large enough to plan any area live.
Built With
- census
- costar
- deepagents
- fastapi
- geopandas
- gtfs
- langchain
- langgraph
- langsmith
- maplibre
- matterport
- numpy
- openstreetmap
- osmnx
- pydantic
- python
- react
- scipy
- typescript
- vexcel
- vite
