Traffic Analysis Dashboard for Smart Transportation About the Project
Traffic congestion is one of the most persistent challenges faced by modern urban environments. Although large volumes of traffic, routing, and location data are generated every day, this data is often distributed across multiple platforms and APIs, making it difficult to analyze in a unified manner. As a result, transportation planners and analysts struggle to derive actionable insights related to travel time, congestion patterns, route efficiency, and location-based travel impact.
This project focuses on transforming raw traffic and location data into structured, interactive, and easily interpretable visual insights. The objective was to design and implement an end-to-end data analytics pipeline that demonstrates how data engineering, automation, and visualization can be combined to support smarter transportation planning and data-driven decision-making.
Inspiration
The inspiration for this project came from everyday travel experiences such as unpredictable traffic delays, inefficient route selection, and the lack of clear tools to visually understand congestion trends. As a data science student, I wanted to explore how real-world data and analytics tools could be used to address these challenges.
This project provided an opportunity to apply theoretical concepts learned in data science, Python programming, and visualization to a real-life problem. It also motivated me to work with live APIs and build a system that mirrors how real-world analytics solutions are designed and deployed.
How I Built the Project
The project was implemented as a complete and automated data analytics workflow, covering data collection, processing, storage, and visualization.
Data Collection
Multiple real-world APIs were integrated to collect diverse and meaningful data. Routing APIs were used to fetch distance, travel time, and step-level route instructions. A places API was used to identify nearby supermarket locations to analyze location-based travel impact. IP-based geolocation data provided contextual information about the user’s location, while reverse geocoding APIs were used to convert latitude and longitude coordinates into human-readable addresses.
Data Processing
All API responses were received in JSON format and processed using Python. The data was cleaned, structured, and transformed to ensure consistency across multiple sources. Route-level data, step-level instructions, and location-based attributes were aligned and organized into a tabular format suitable for analysis. Special care was taken to handle missing values, nested structures, and inconsistent API responses.
Data Storage
The processed data was automatically uploaded to Google Sheets using the Google Sheets API. Google Sheets was used as a cloud-based, dynamic data store that allows easy updates and seamless integration with visualization tools. This approach ensures that the data can be refreshed or extended without manual intervention.
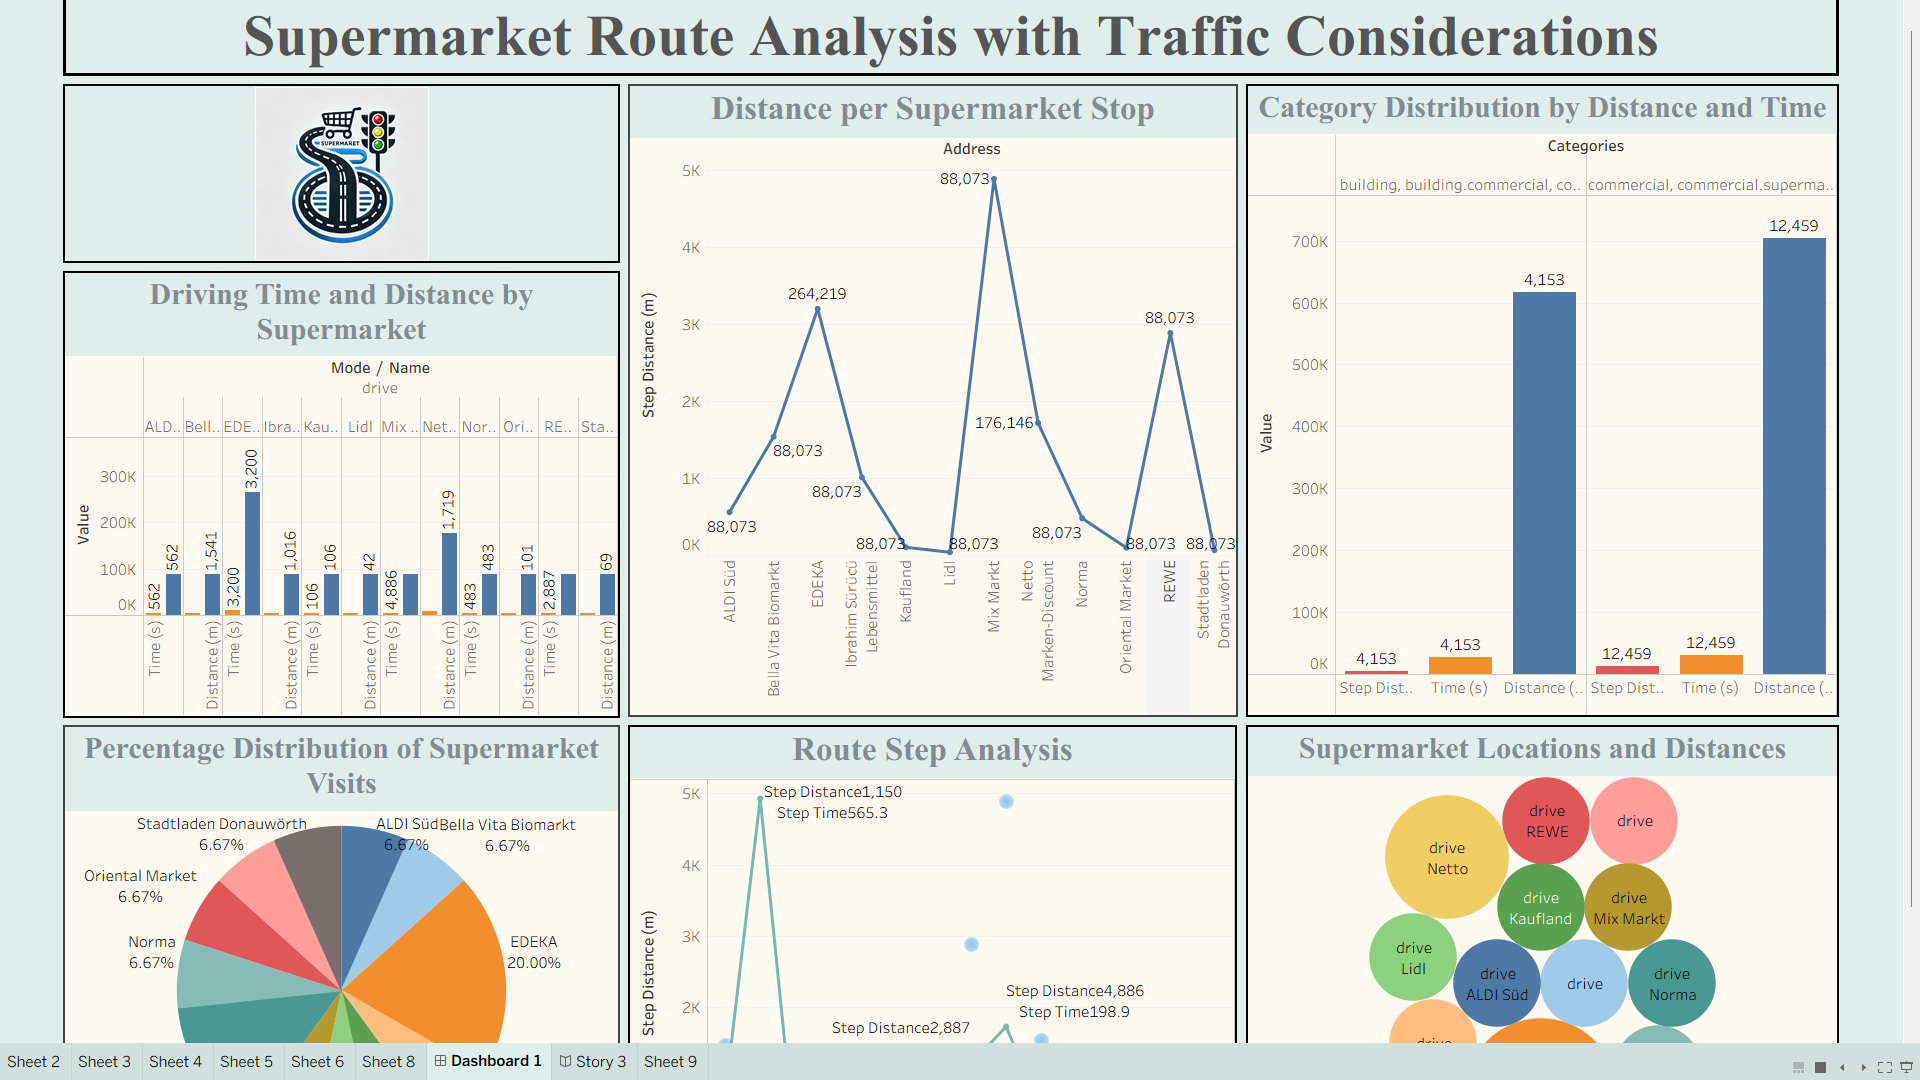
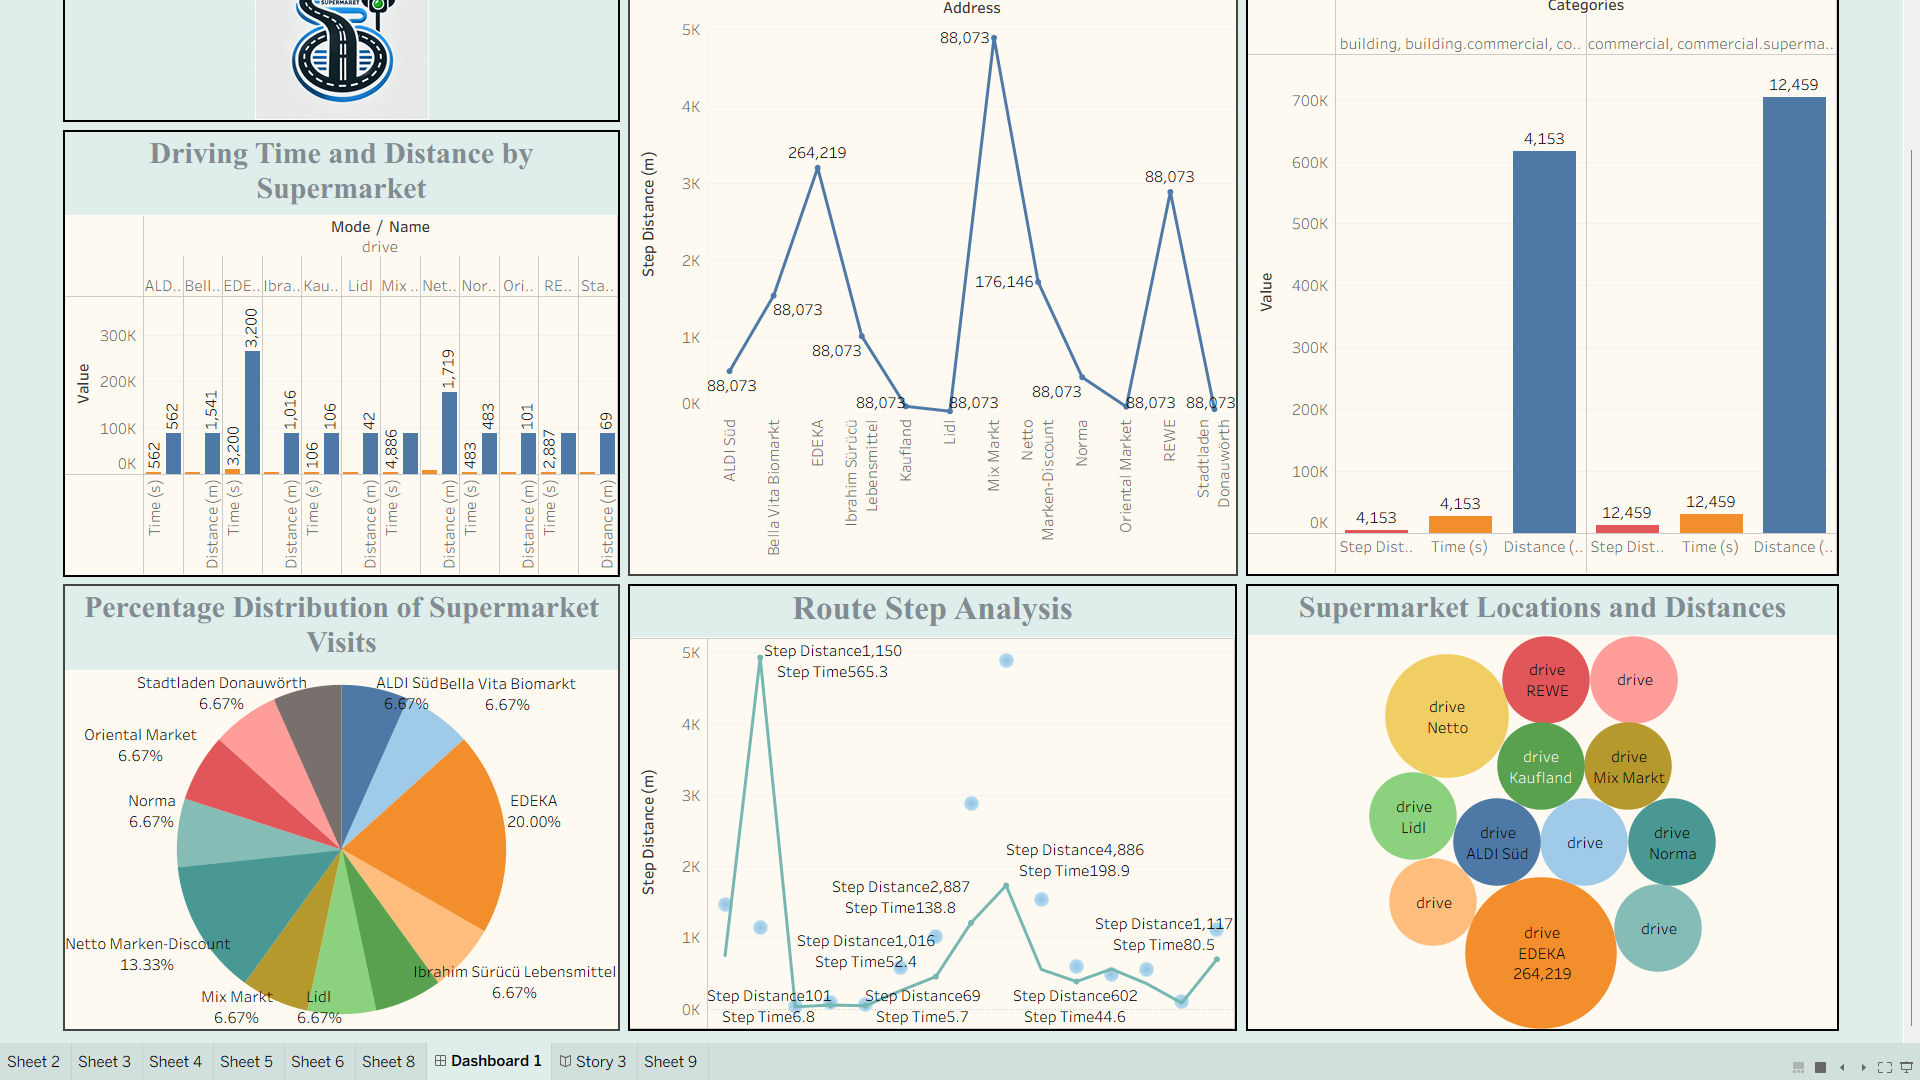
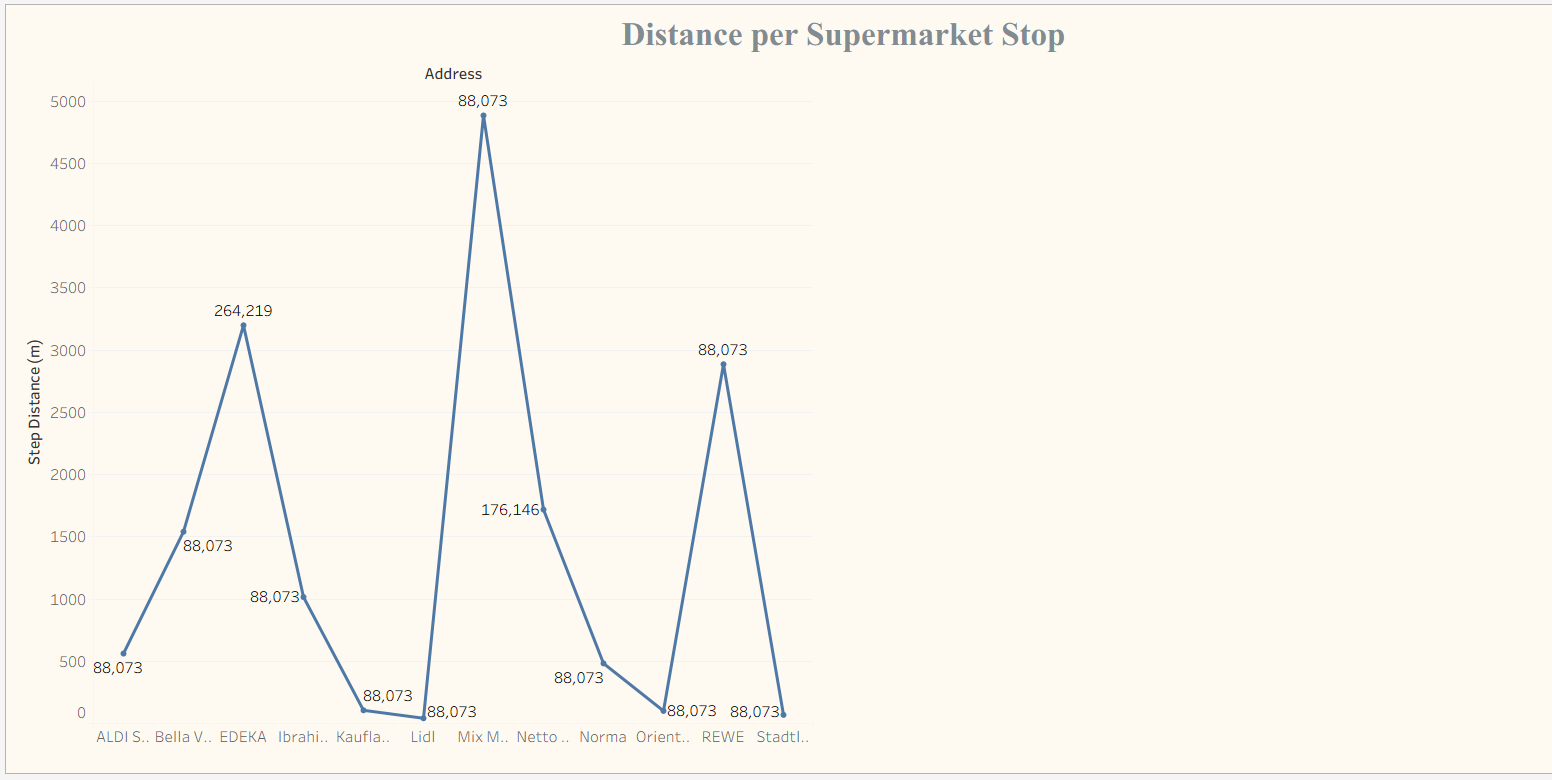
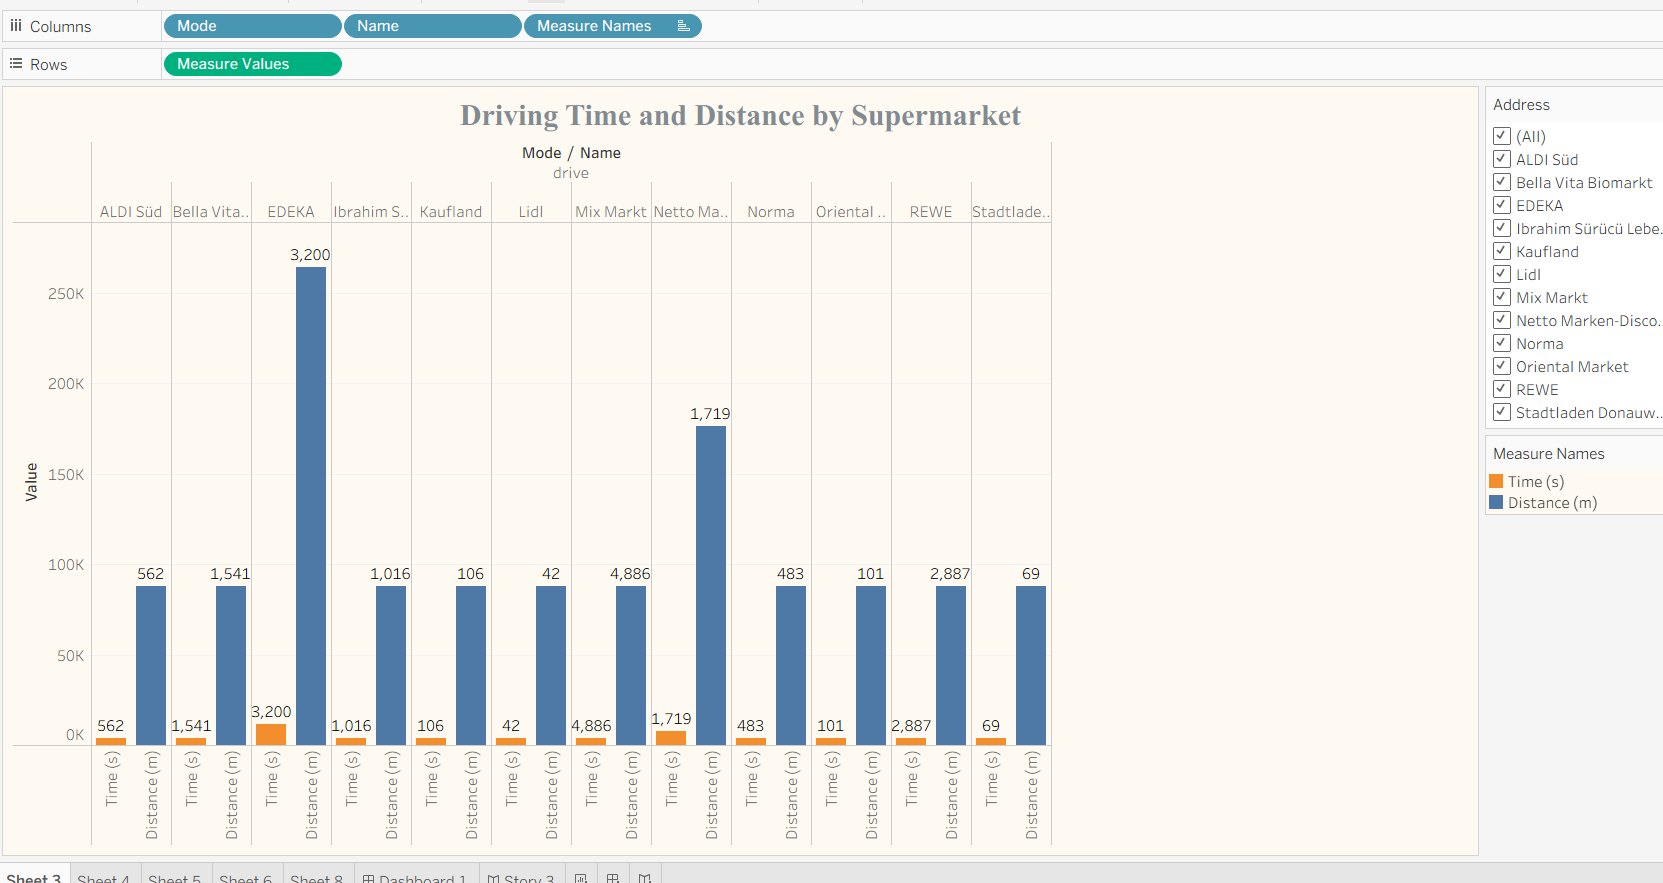
Visualization
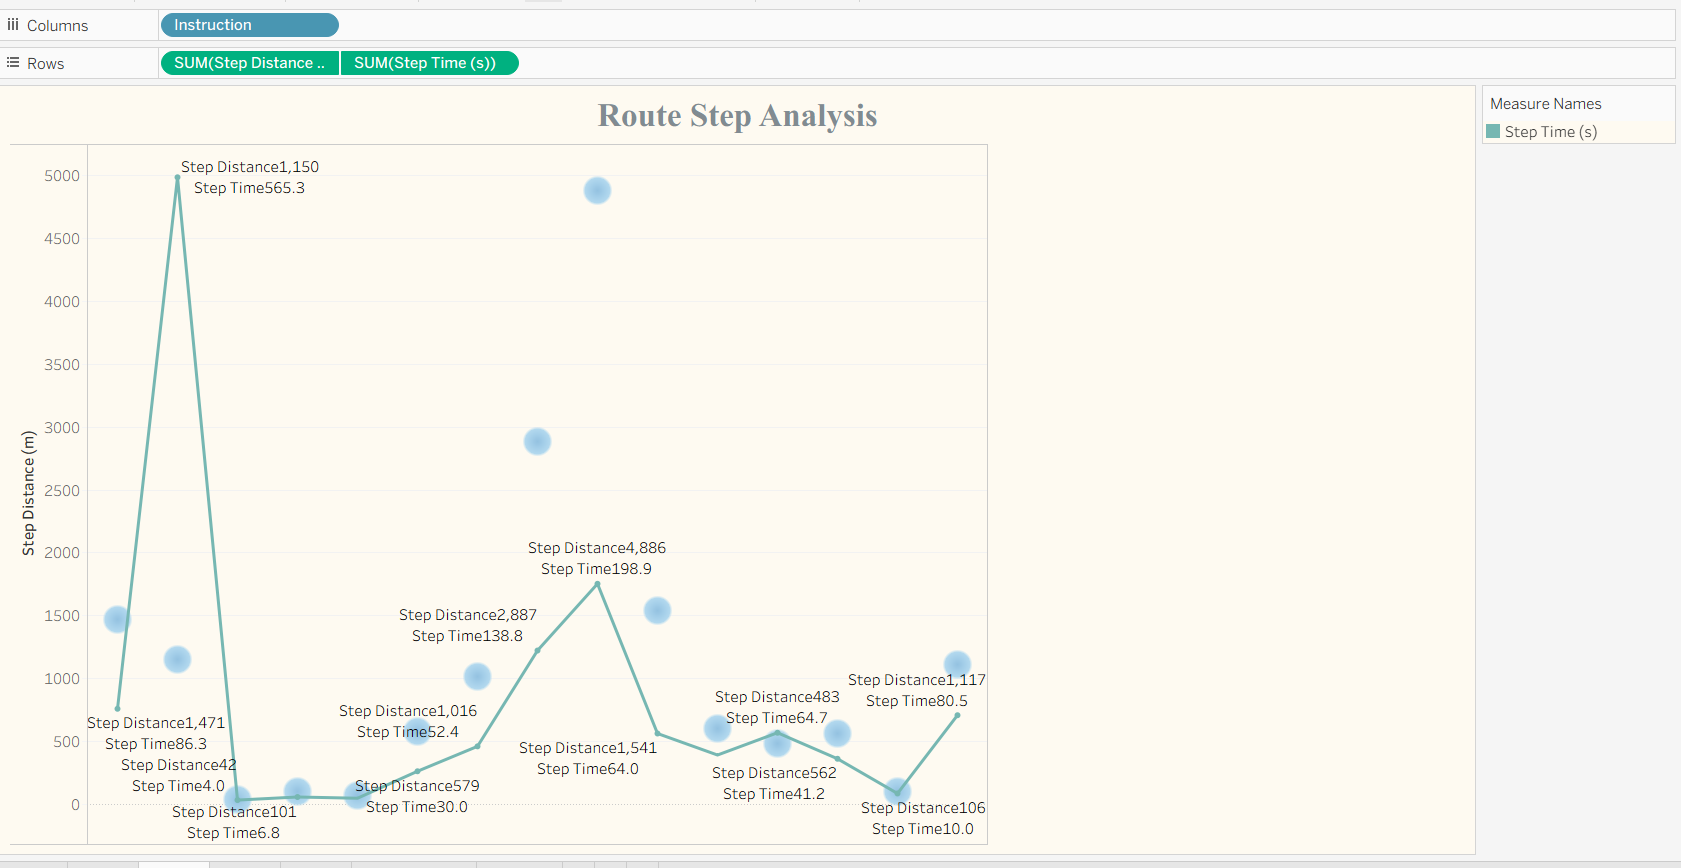
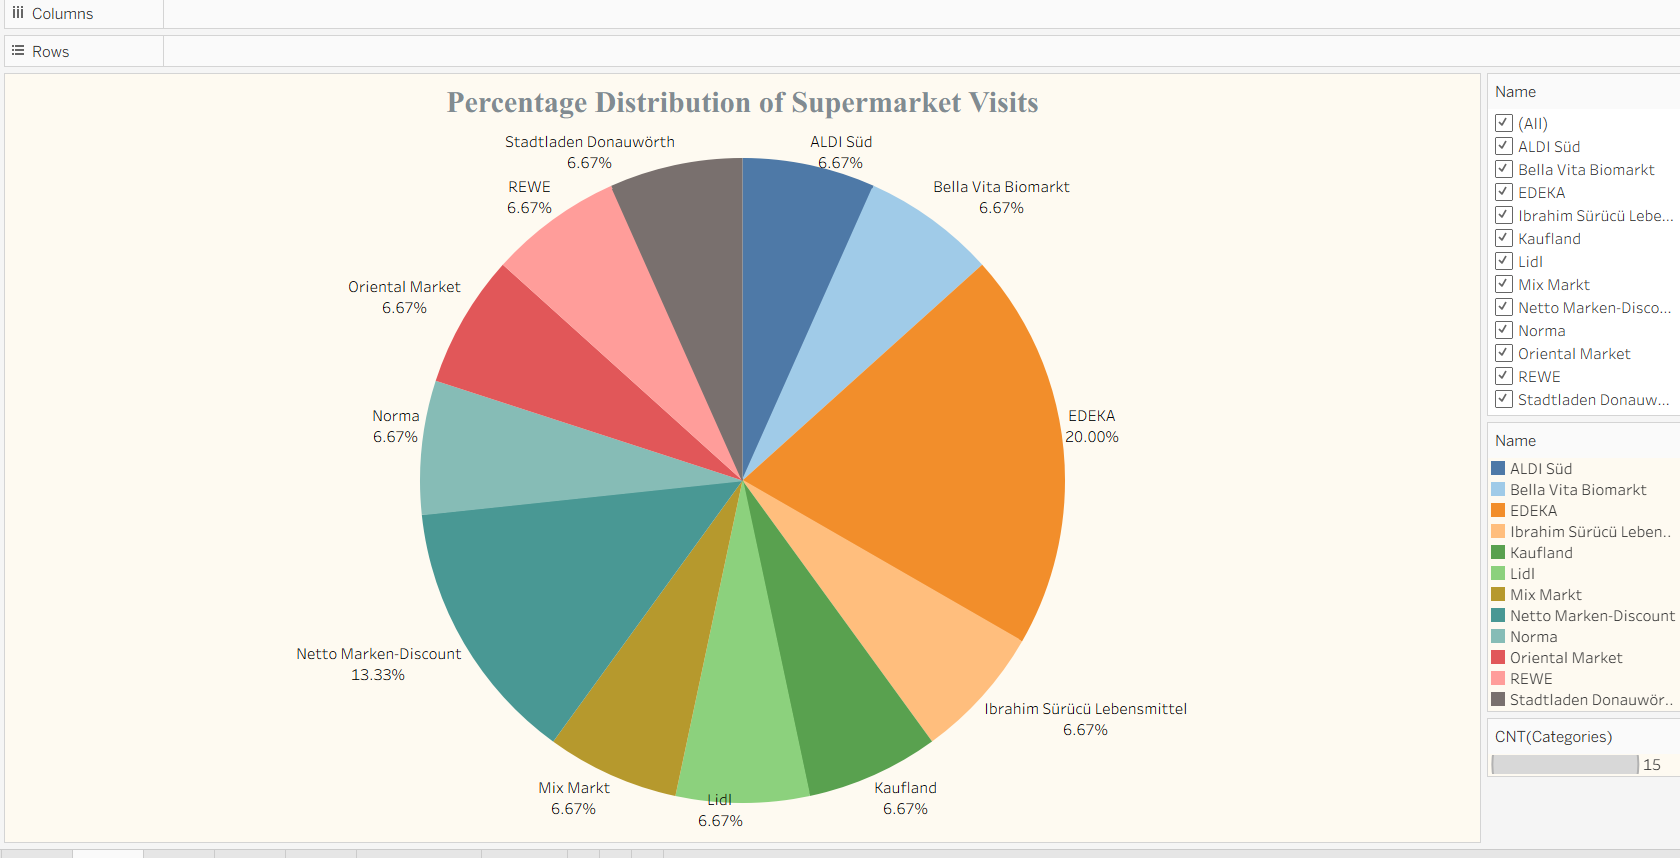
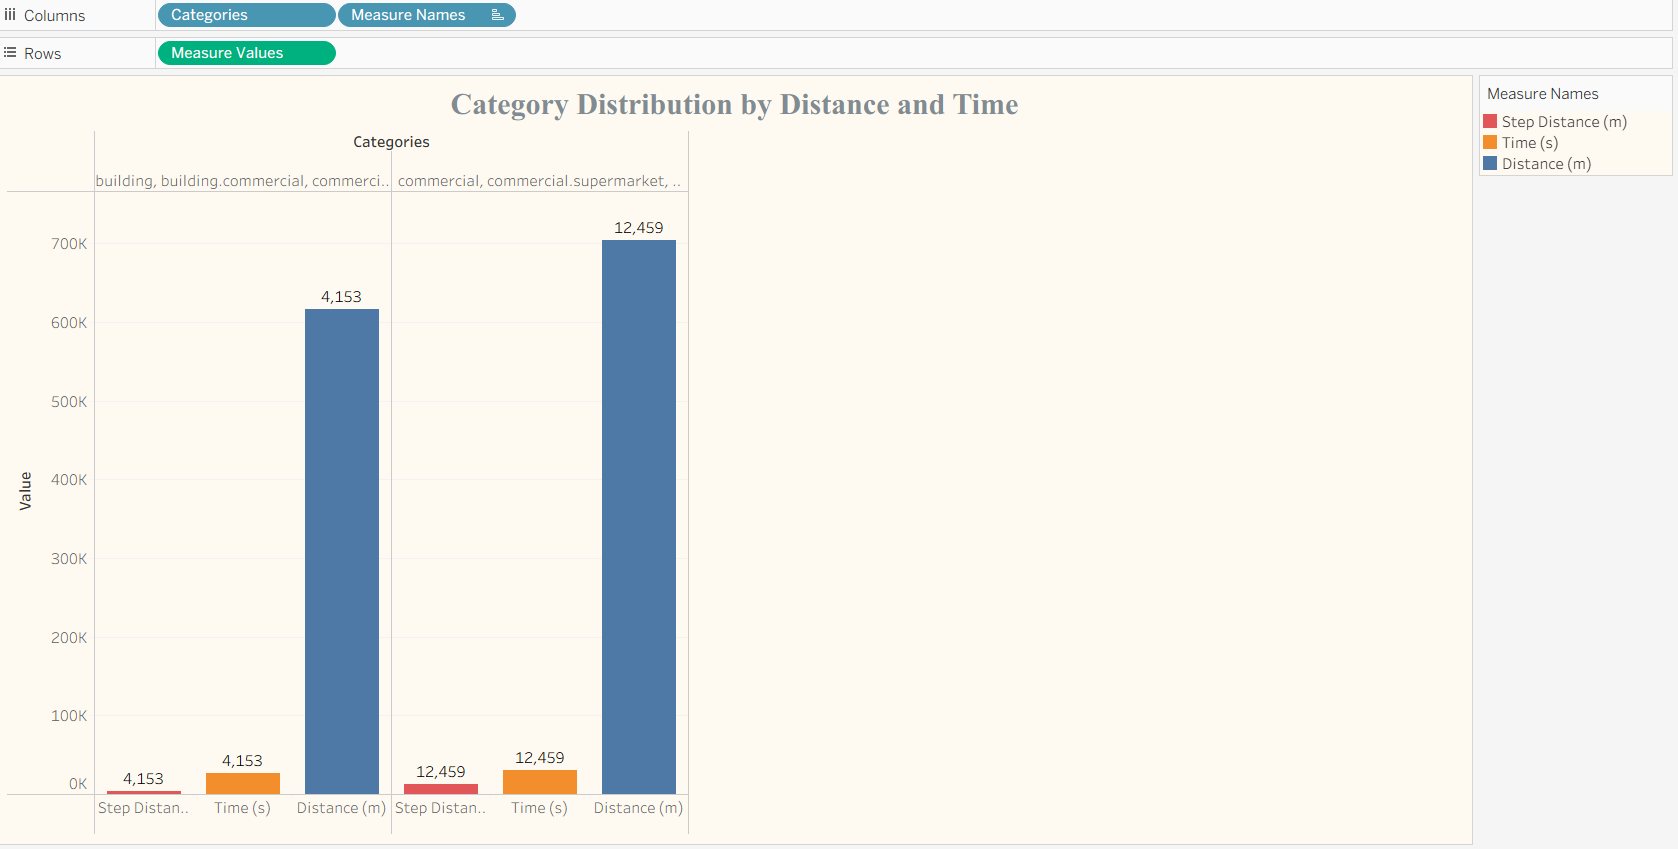
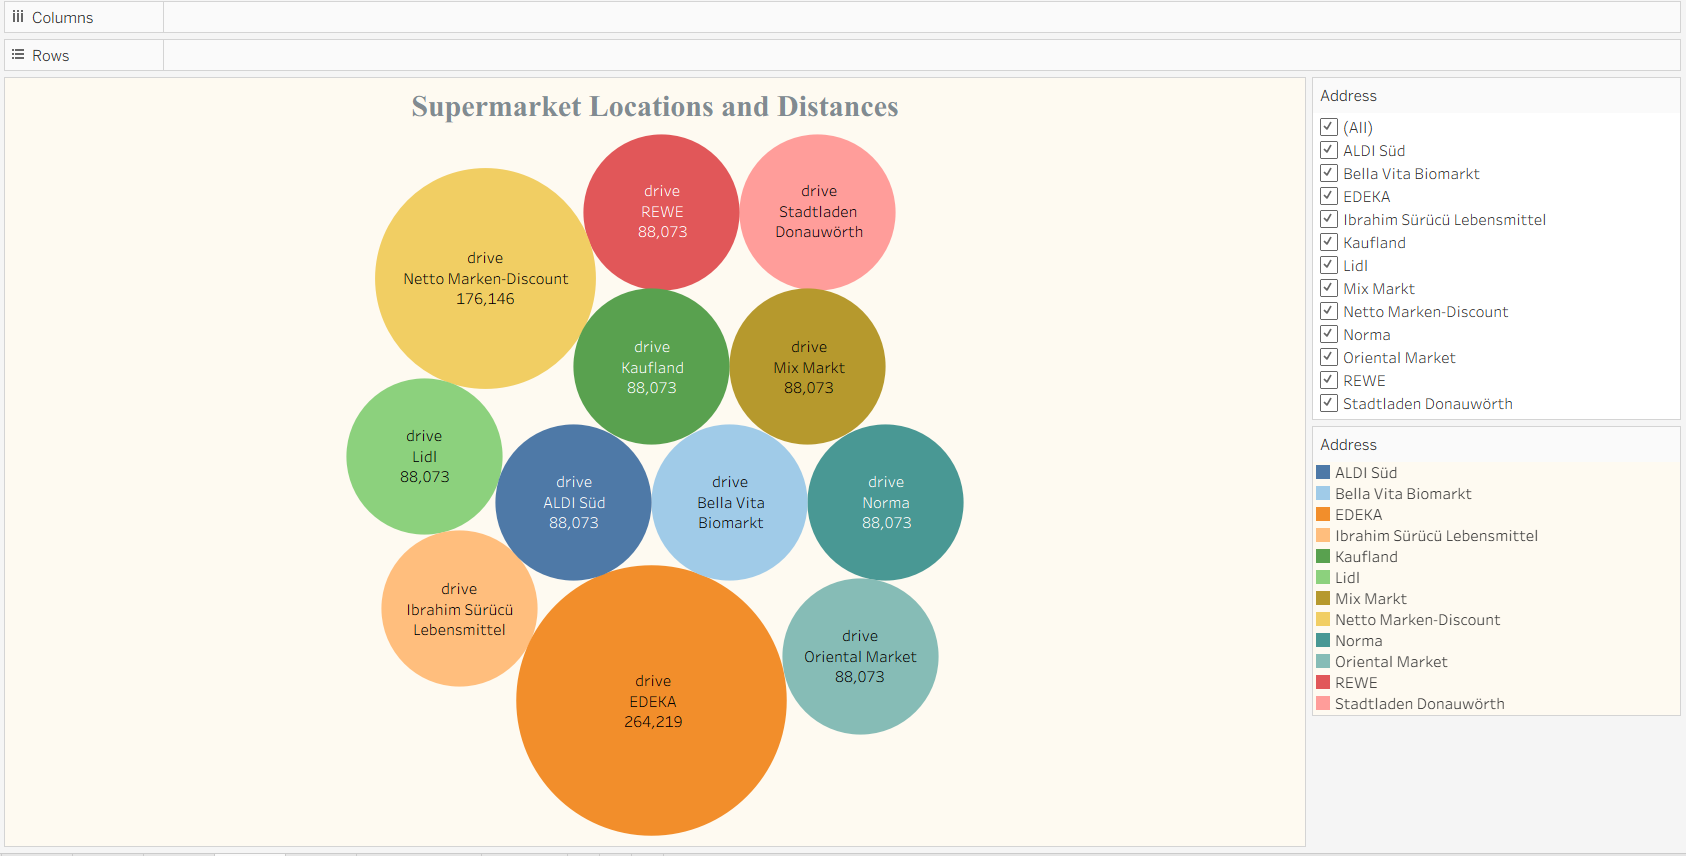
Tableau was connected directly to Google Sheets to create interactive and insightful dashboards. Multiple types of visualizations were designed, including bar charts to compare driving time and distance, line charts for step-by-step route analysis, pie charts for visit distribution, and bubble charts to map supermarket locations and their traffic impact. These dashboards allow users to explore congestion patterns, identify inefficient routes, and compare travel behavior across locations.
What I Learned
Through this project, I gained hands-on experience in several key areas:
Integrating and working with real-world APIs
Handling complex and nested JSON data structures
Building automated data pipelines using Python
Managing live and cloud-based data sources
Designing interactive dashboards that support analytical storytelling
Translating raw data into meaningful and actionable insights
Challenges Faced
The project involved several technical and analytical challenges. Handling deeply nested API responses required careful parsing and validation. Aligning route-level data with location-based and step-level information was complex due to differences in data structure and availability. Additionally, managing missing or inconsistent values and designing dashboards that balanced detail with clarity required multiple iterations. Overcoming these challenges significantly improved my problem-solving, debugging, and analytical thinking skills.
Future Scope
This project can be extended by integrating real-time traffic data feeds to provide live congestion updates. Machine learning models can be applied to predict traffic congestion and travel time based on historical patterns. Additionally, the solution can be scaled for city-level logistics, transportation planning, and urban infrastructure optimization use cases.

Log in or sign up for Devpost to join the conversation.