-
-
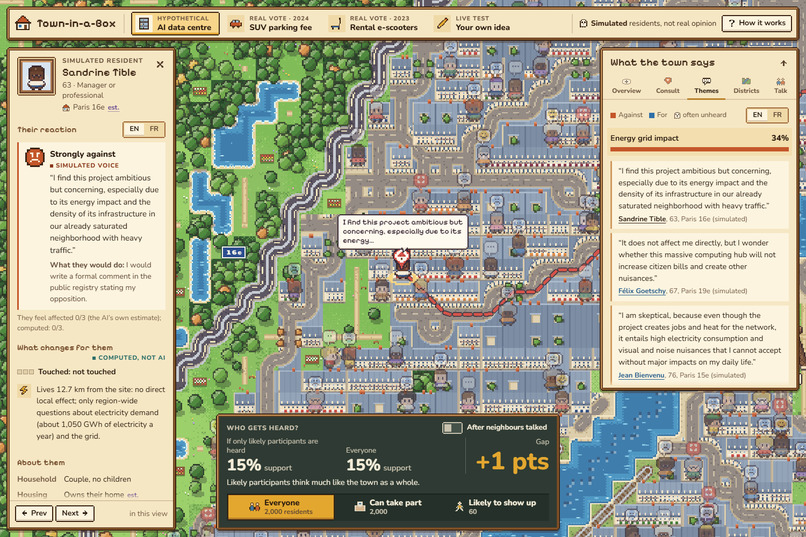
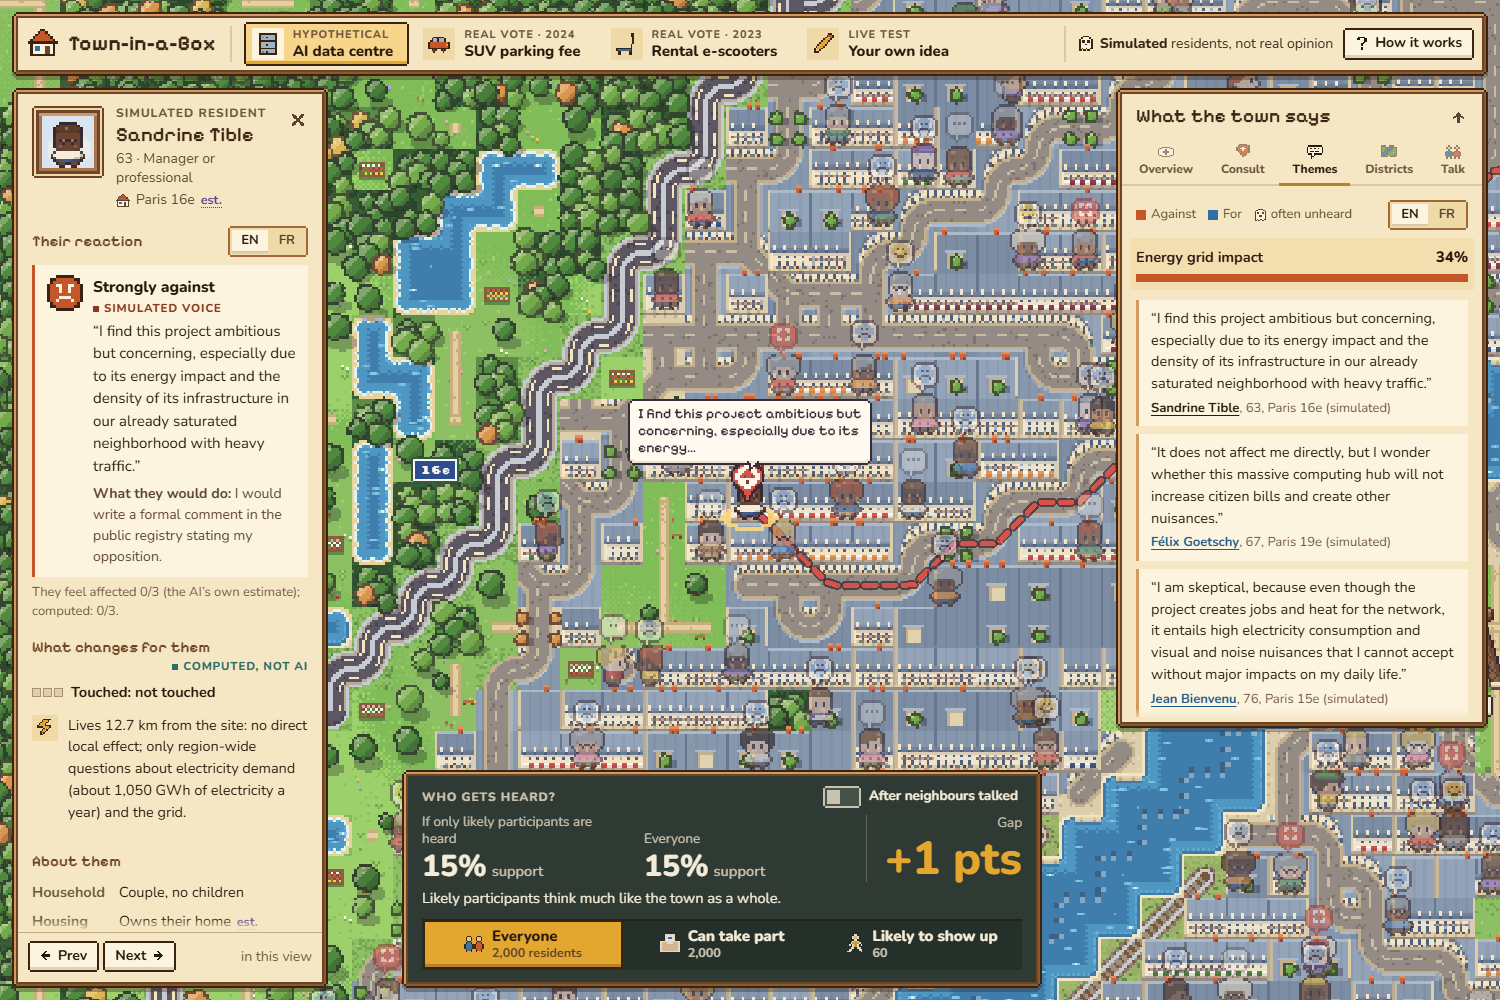
One resident's view: their reaction (NVIDIA Nemotron 3 Nano), what the proposal changes for them (computed) and their commute.
-
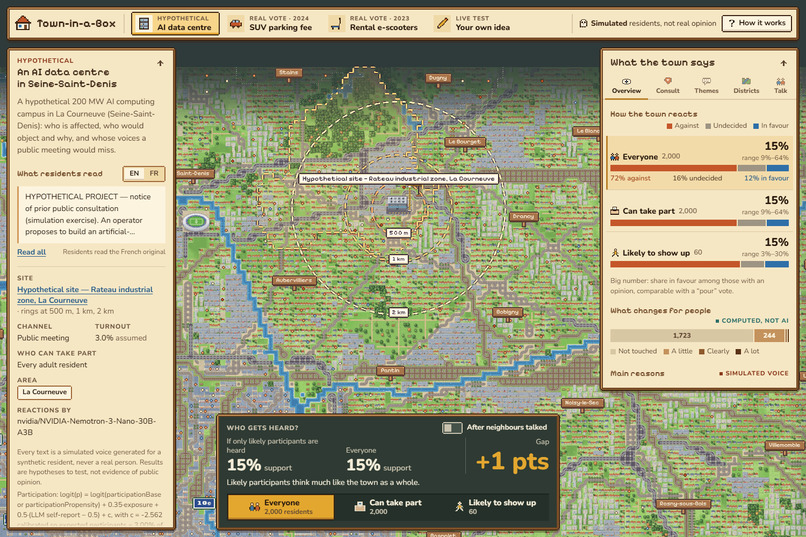
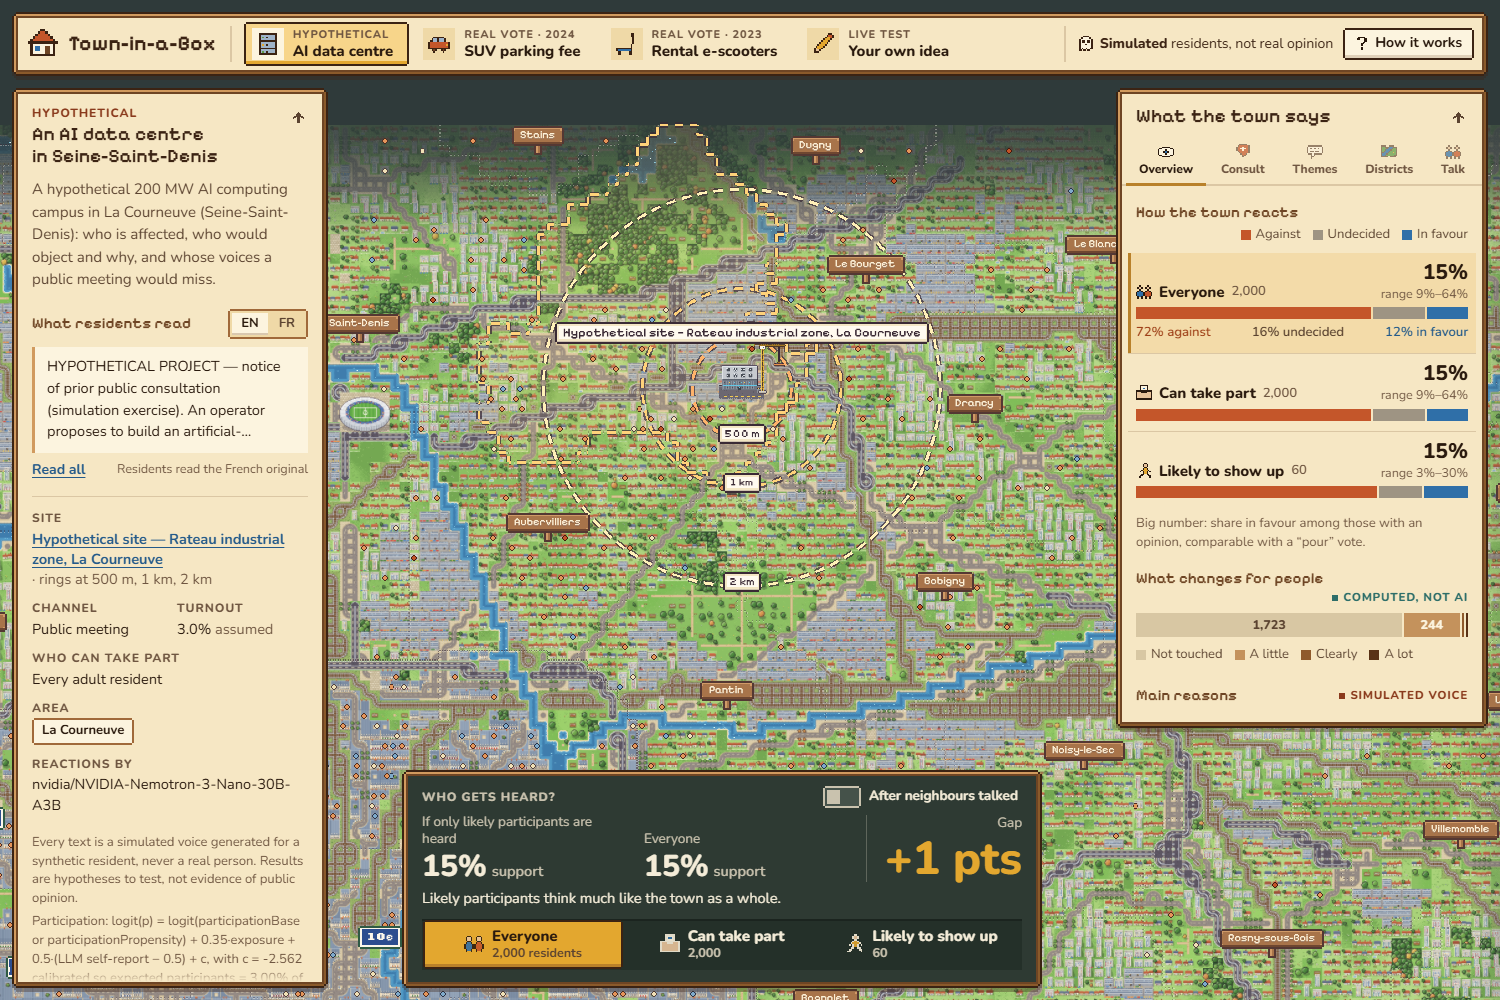
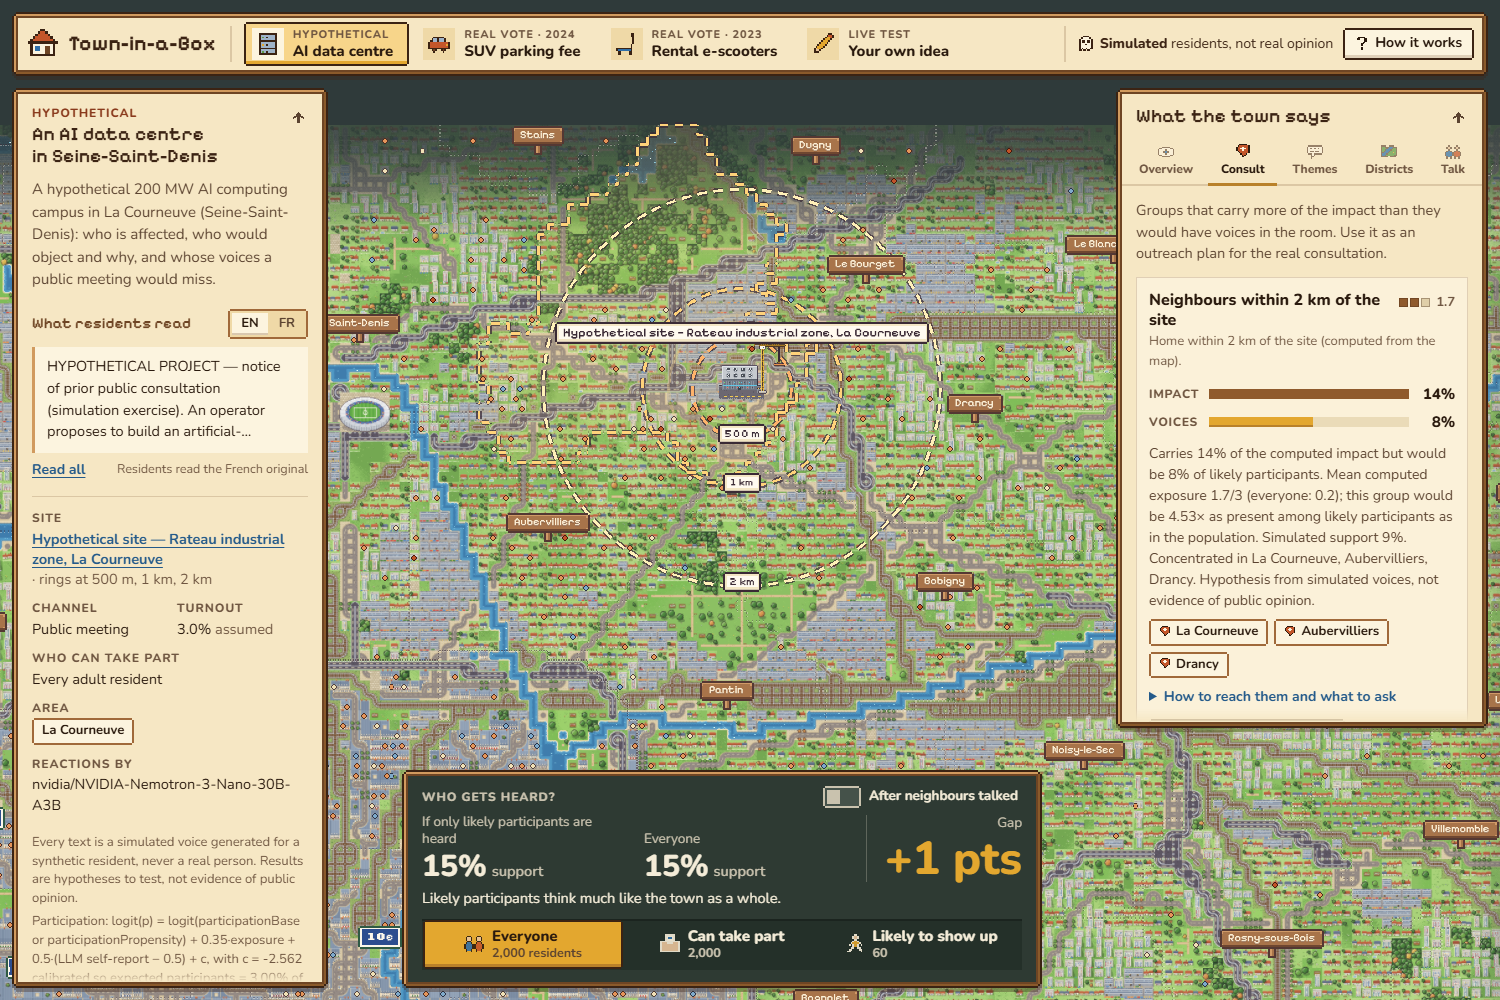
Hypothetical AI data centre in Seine-Saint-Denis: 2,000 simulated residents and the gap between everyone and likely participants.
-
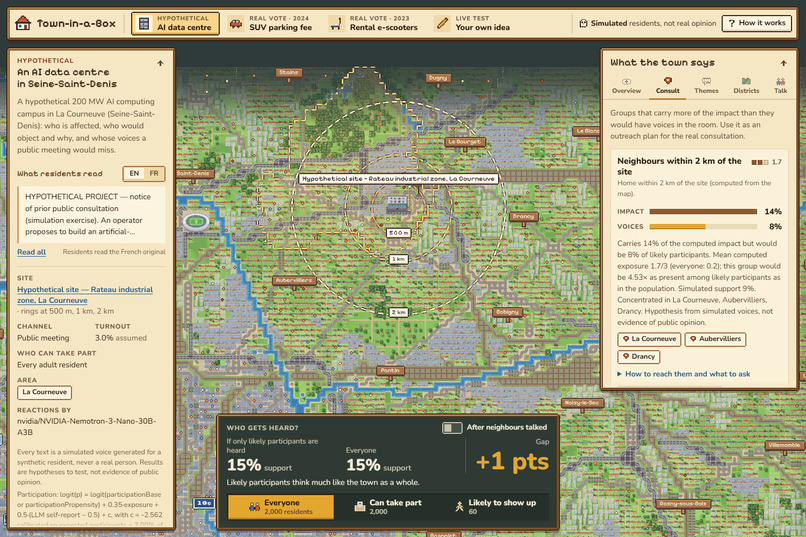
Who to consult: groups that carry more of the impact than they would have voices at the meeting.
-
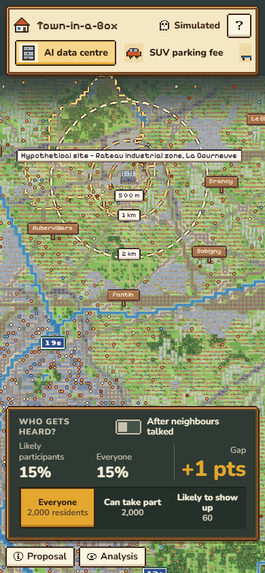
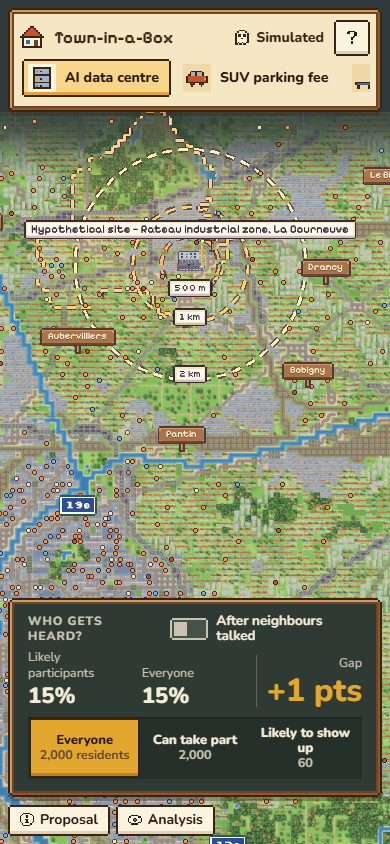
Works on phones too.
-
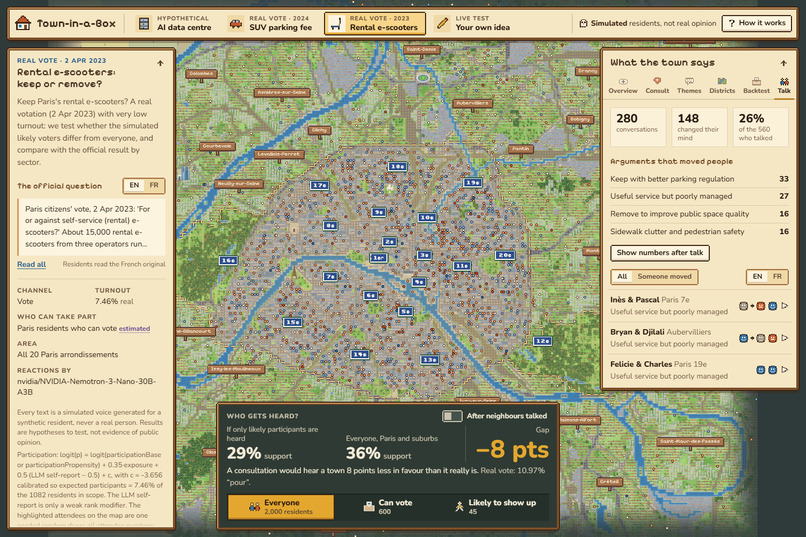
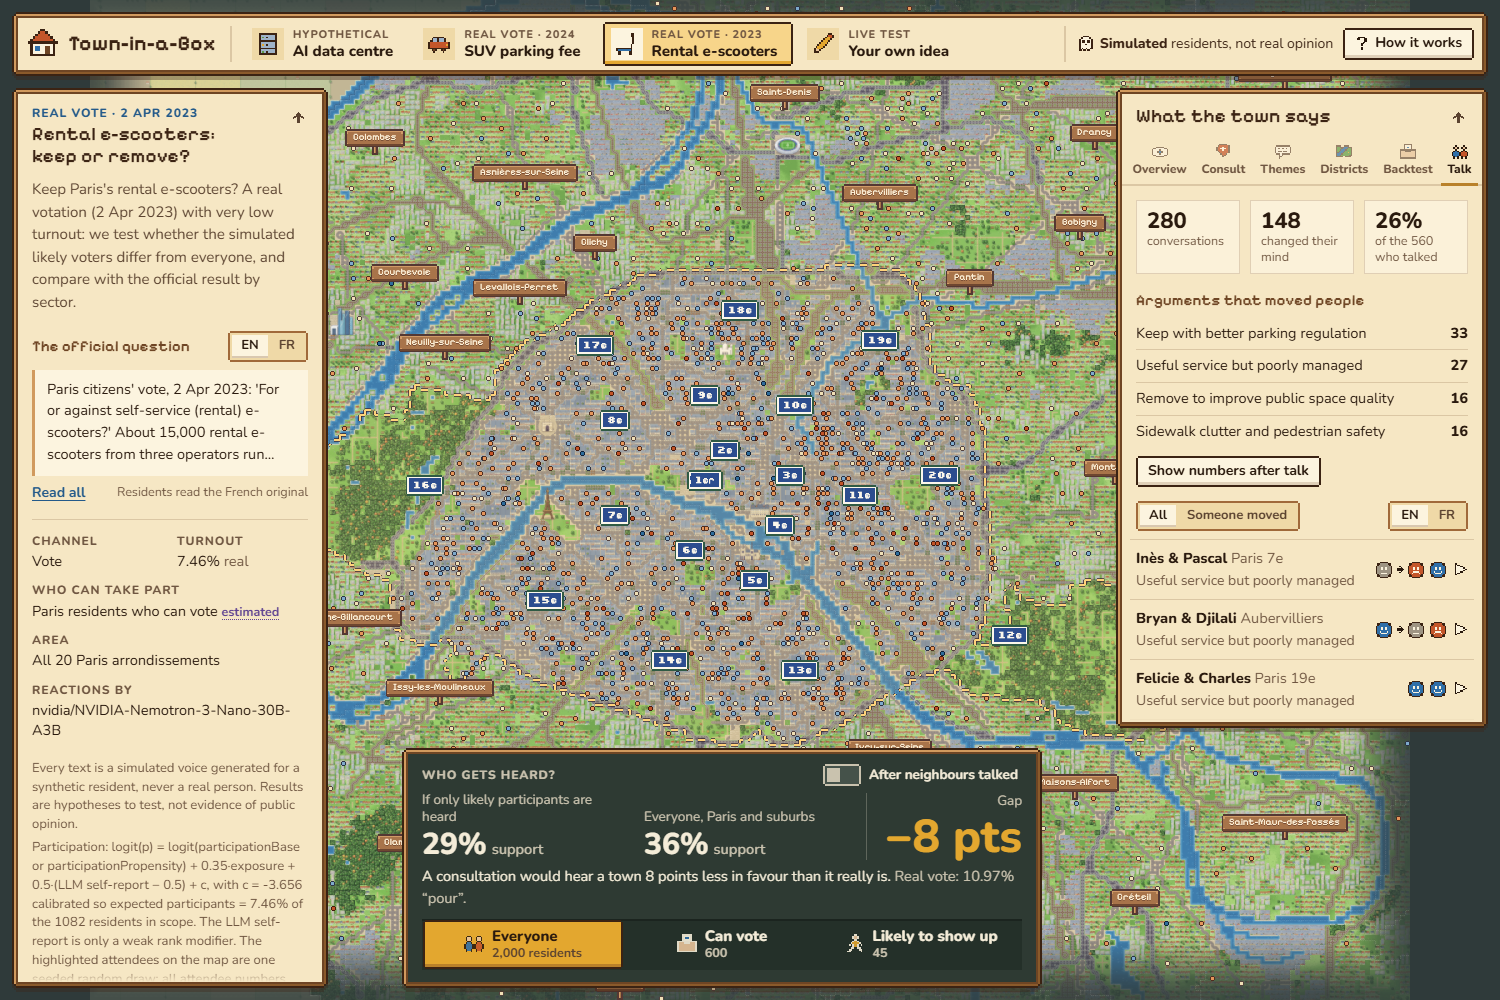
Neighbour conversations written by NVIDIA Nemotron 3 Super: which arguments spread between residents.
-
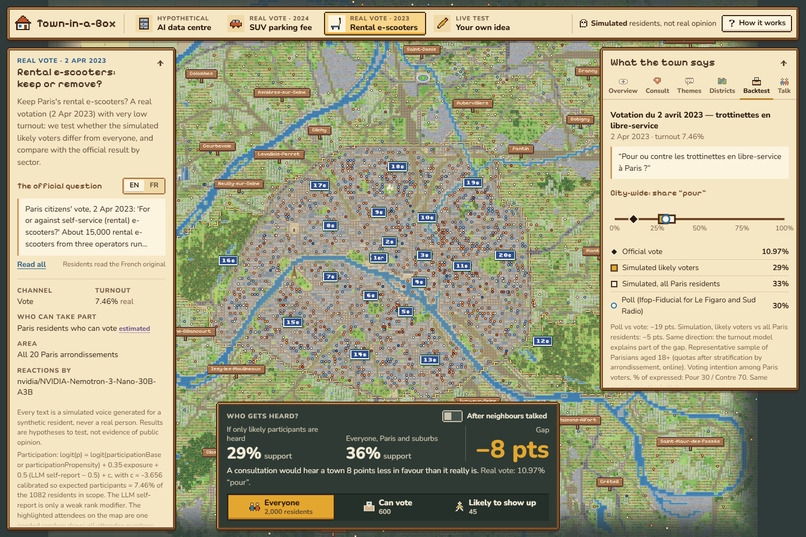
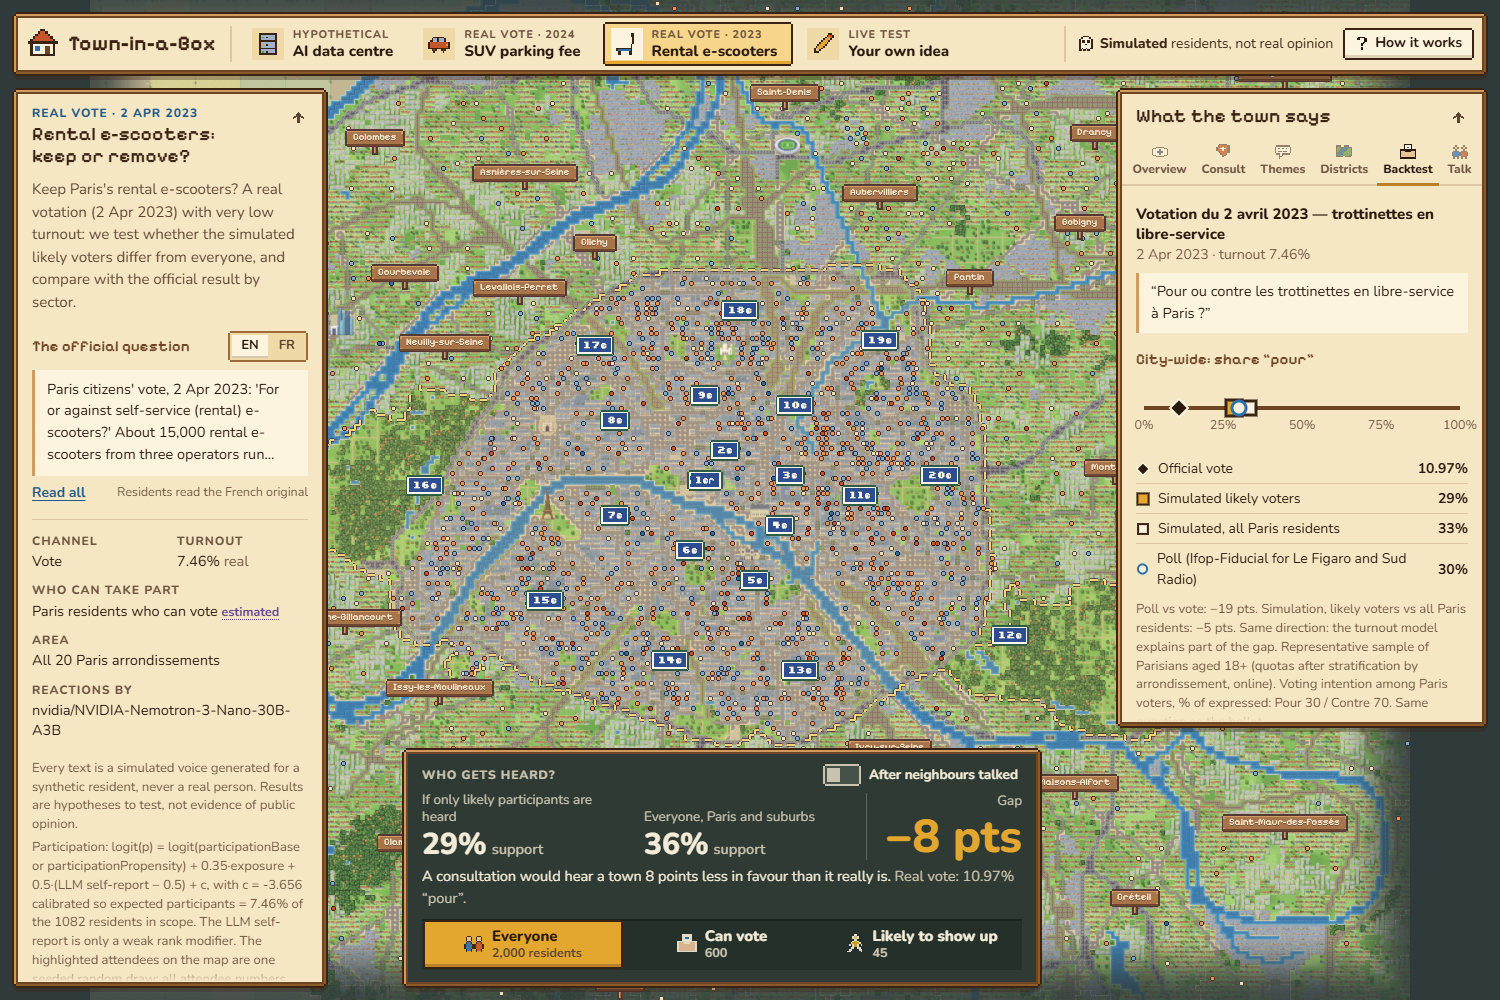
Backtest on the real 2023 Paris e-scooter vote: official result, poll, simulated likely voters and everyone.
Inspiration
Public consultations hear the few. In the 2023 Paris vote on rental e-scooters, turnout was 7.46%. A poll asking the same question found 30% in favour; the vote gave 10.97%. People who show up at public meetings are older, more often homeowners and far more likely to vote than the people a project affects. A planner cannot fix who shows up after the fact, but they can rehearse the consultation first.
What it does
Town-in-a-Box lets a city planner test a proposal on 2,000 simulated residents of Paris and its inner suburbs, on a cozy pixel-art map of the real city, before the public consultation.
- The gap. "If only likely participants are heard: X% support. Everyone: Y%." Switch between Everyone, Can vote and Likely to show up; non-participants fade to ghosts on the map.
- One citizen's view. Click any resident to see their home and commute, exactly where and how the proposal touches them (computed from geography, not decided by the AI), their reaction in their own words, how likely they are to take part, and what a neighbour told them. You can ask them a follow-up question live.
- Who to consult. Groups that carry more of the impact than they would have voices in the room, where they live and how to reach them.
- Themes. The arguments residents gave, flagged where they are stronger among people who will not show up.
- Neighbour talk. 280 pairs of neighbours discuss the proposal. Watch them talk on the map and see which arguments spread.
- Backtest. Two real Paris votes (2023 e-scooters, 2024 SUV parking fee), sector by sector, against baselines and a leakage probe.
- Your own idea. Write any proposal in English or French, pick districts or place a site, choose the channel (vote, public meeting, online consultation) and run 150 residents live.
Three ready scenarios: a hypothetical 200 MW AI data centre in Seine-Saint-Denis, and the two real votes.
How we built it
- Population. We took every row of NVIDIA Nemotron-Personas-France for Paris and the three inner-suburb départements (125,211 rows), raked them to INSEE 2022 census margins and drew 2,000 residents. The dataset has no car, housing tenure, nationality, voter registration or commute, so we impute these per district from INSEE and label them "imputed" everywhere.
- Computed exposure. What a proposal changes for each resident (distance to the site, parking zone versus workplace, and so on) comes from deterministic rules on the map. The LLM never decides exposure; it only reacts to the computed facts.
- Nemotron on Nebius Token Factory. Every model call goes through Token Factory's OpenAI-compatible API, with three model sizes matched to three jobs:
- Nemotron 3 Nano: 2,000 reactions per scenario (strict JSON schema: stance, reason in French and English, behaviour, "would you take part"), theme assignment, live questions and live custom runs.
- Nemotron 3 Super: the neighbour conversations, and a second model for the uncertainty runs.
- Nemotron 3 Ultra: one theme-discovery call over a stratified sample of reasons, with low-participation voices weighted double.
- Calibrated participation. Turnout comes from INSEE turnout gradients (age, diploma, tenure) plus exposure, solved so the weighted turnout matches the real one (5.68% and 7.46%). The model's own "would you take part" only nudges the ranking.
- Pipeline. A Python async client with a rate limiter, retries, a disk cache and a spending ledger with a hard cap. About 3,900 calls per scenario in about 41 minutes; 0 failed calls and 9 retries out of 11,694 requests; $0.87–0.91 per scenario, $2.78 for the whole project.
- Web app. React and TypeScript. The map is a PixiJS renderer on a 264×200 grid of 100 m tiles built from OpenStreetMap and official boundaries; all art and characters are original and drawn in code. Live features run in serverless functions that keep the API key server-side, with per-visitor and daily limits.
Challenges we ran into
- The dataset does not know who rents, drives or can vote. We imputed these from census statistics and label them in the app.
- Half of the Paris rows have no arrondissement, and their texts invent one (often the 12th). We assign the district jointly with occupation, age and education instead of at random.
- Model settings mattered more than personas. Turning "thinking" on moved the same 60 test residents from 32% to 100% in favour. We kept it off, as planned, rather than picking the setting that matched the result.
- Leakage. Both votes predate the models' training cutoff. Our probe shows Super and Ultra recall the results when asked directly; Nano, which writes the reactions, does not seem to.
Accomplishments that we're proud of
- An honest backtest. The simulation does not beat a simple demographic baseline, and we say so. On the scooter vote it gets the direction of the turnout effect right (likely voters are less favourable than everyone, as in reality).
- Every number is traceable. Each fact is tagged as dataset, imputed, computed or simulated voice.
- The whole project cost under $3 of Token Factory calls.
What we learned
Who shows up matters as much as what people think. The impact-versus-voice comparison holds up even when the simulated yes/no shares are weak, and it is the part a planner can act on: whom to go and consult on purpose.
What's next
- An out-of-sample backtest on a vote held after the models' training cutoff.
- Other French cities: the pipeline is driven by open INSEE and OpenStreetMap data.
- Exporting the "who to consult" outreach plan for planners.
Every resident is synthetic and every text is a simulated voice. Results are hypotheses to check with real people, not evidence of public opinion.
Built With
- duckdb
- insee
- nebius-token-factory
- nemotron-personas
- nvidia-nemotron
- openstreetmap
- pandas
- pixijs
- python
- react
- typescript
- vercel
- vite

Log in or sign up for Devpost to join the conversation.