-
-
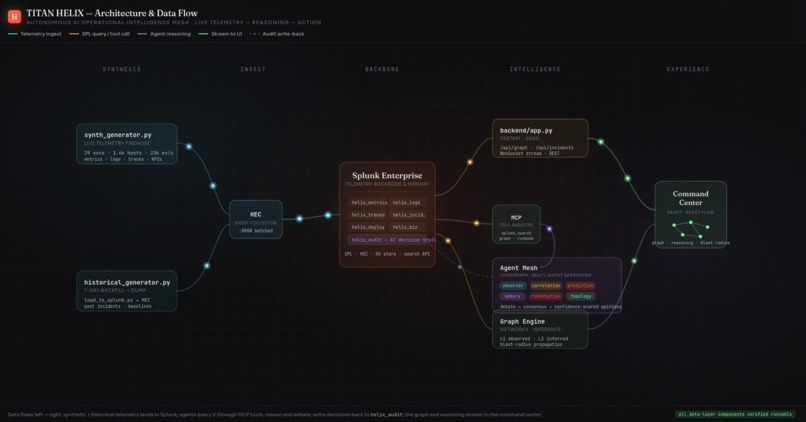
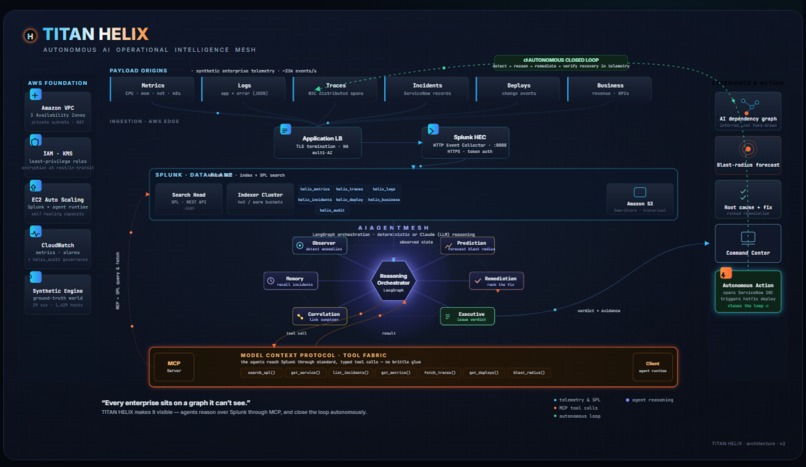
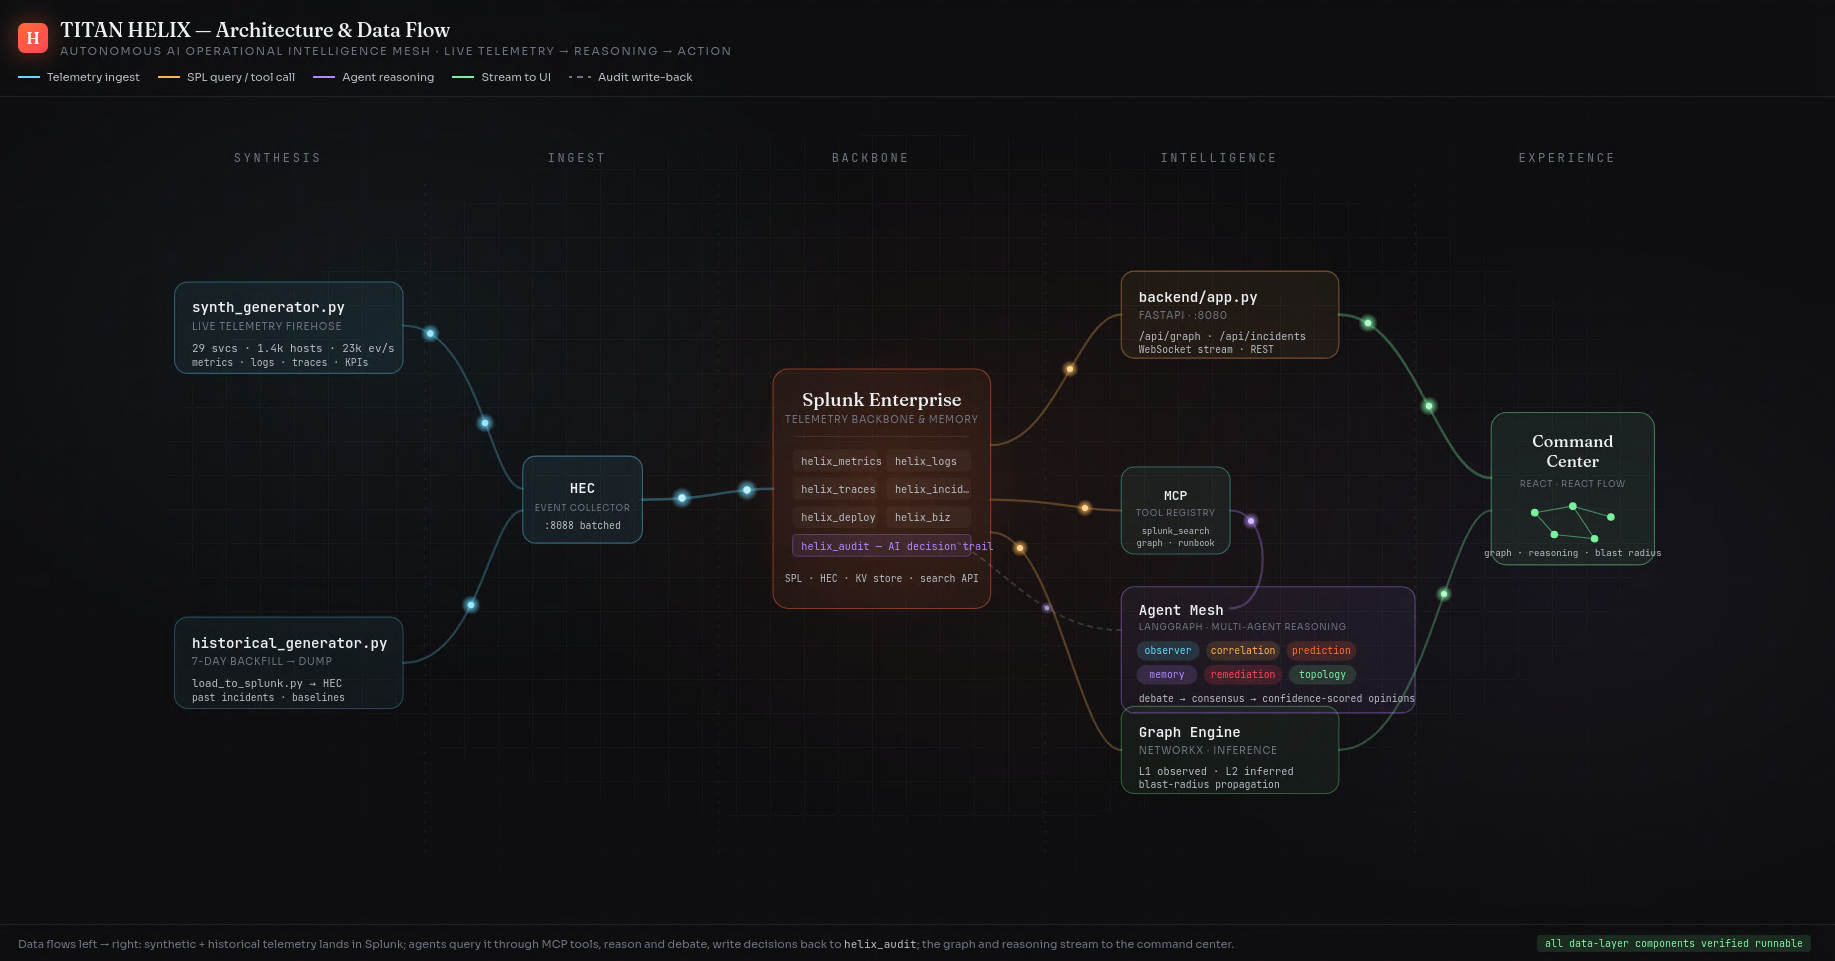
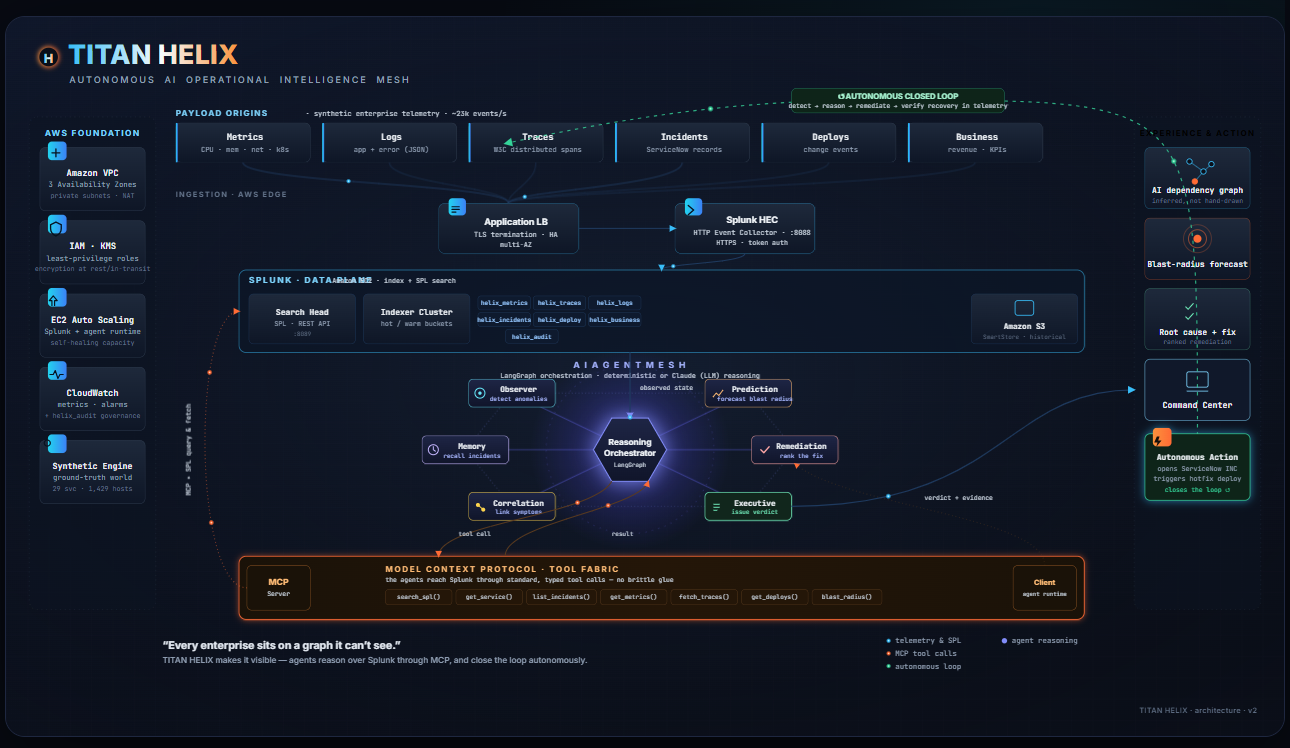
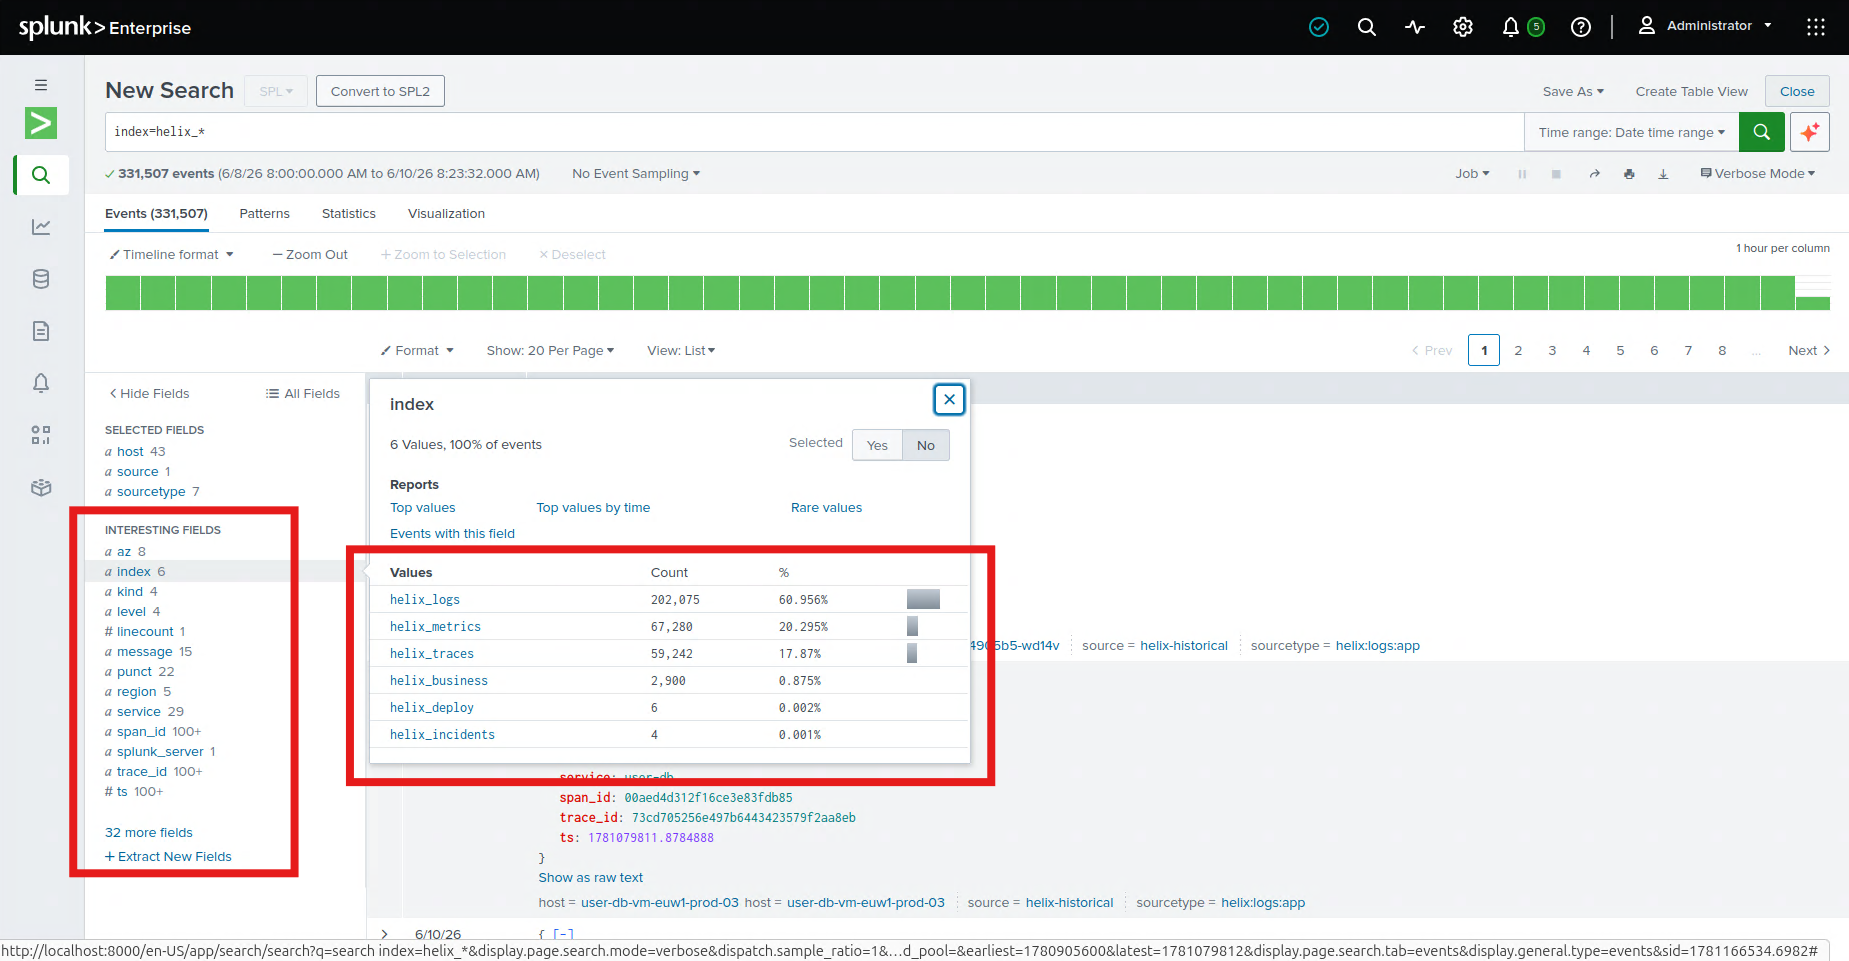
Left to right: synthetic + historical telemetry lands in Splunk, agents query it via MCP, reason, and write decisions back to helix_audit.
-
-

-
-
-
-
-
-
-
-
-
-
Inspiration
Every incident I've ever worked started before the alert did.
I run Splunk Enterprise at scale for a living, and the pattern never changes. A dependency deep in the stack starts to struggle — a database at 94% CPU, say — but it's slow, not down. It still answers every request with 200 OK. Error-rate alerting stays silent. Then the queue behind it backs up, a service that depends on it times out, the service that depends on that starts throwing 503s, and ninety seconds later a dozen dashboards are red and someone's been paged. The first thirty minutes of the outage are then spent doing something almost embarrassing for an industry this advanced: a room full of engineers redrawing the dependency graph on a whiteboard from memory, arguing about which red box started it.
The maddening part is that Splunk Enterprise already has all of it — the metrics, the traces, the deploy markers, the past incident that looked exactly like this one. The data isn't missing. The reasoning is. The work of connecting symptom to cause still happens in human heads under pressure.
When the Model Context Protocol turned "let a model use a tool" into a clean, standard seam, it suddenly felt possible to move that reasoning out of the war room and put it directly on top of Splunk Enterprise. The Splunk Agentic Ops Hackathon was the excuse to actually build it.
What it does
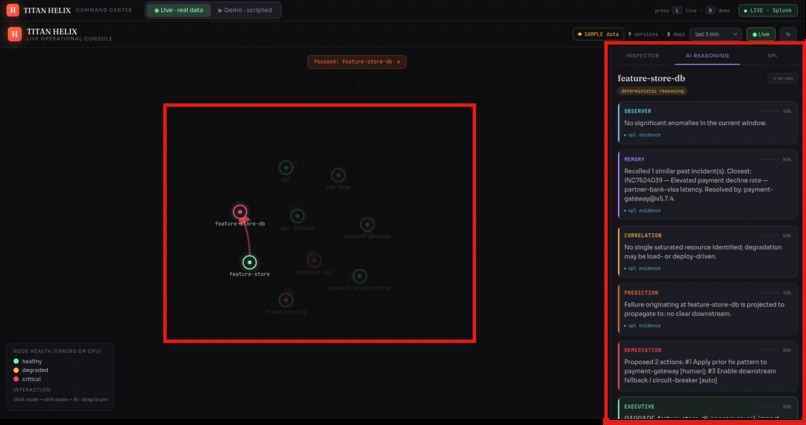
TITAN HELIX is an autonomous reasoning mesh that sits on Splunk Enterprise and explains failures while they unfold.
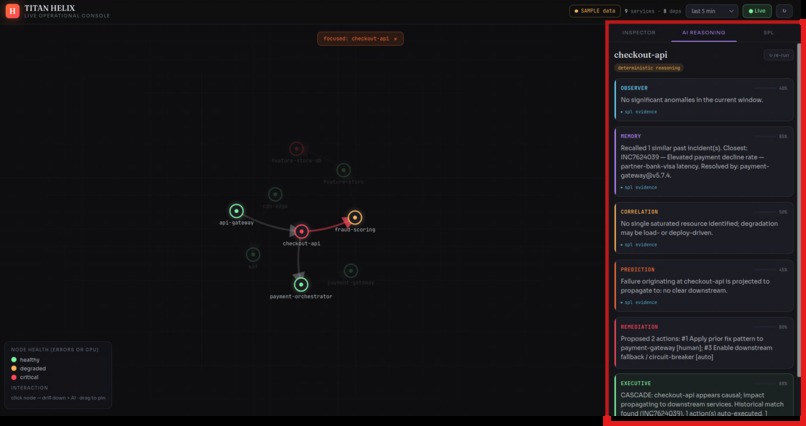
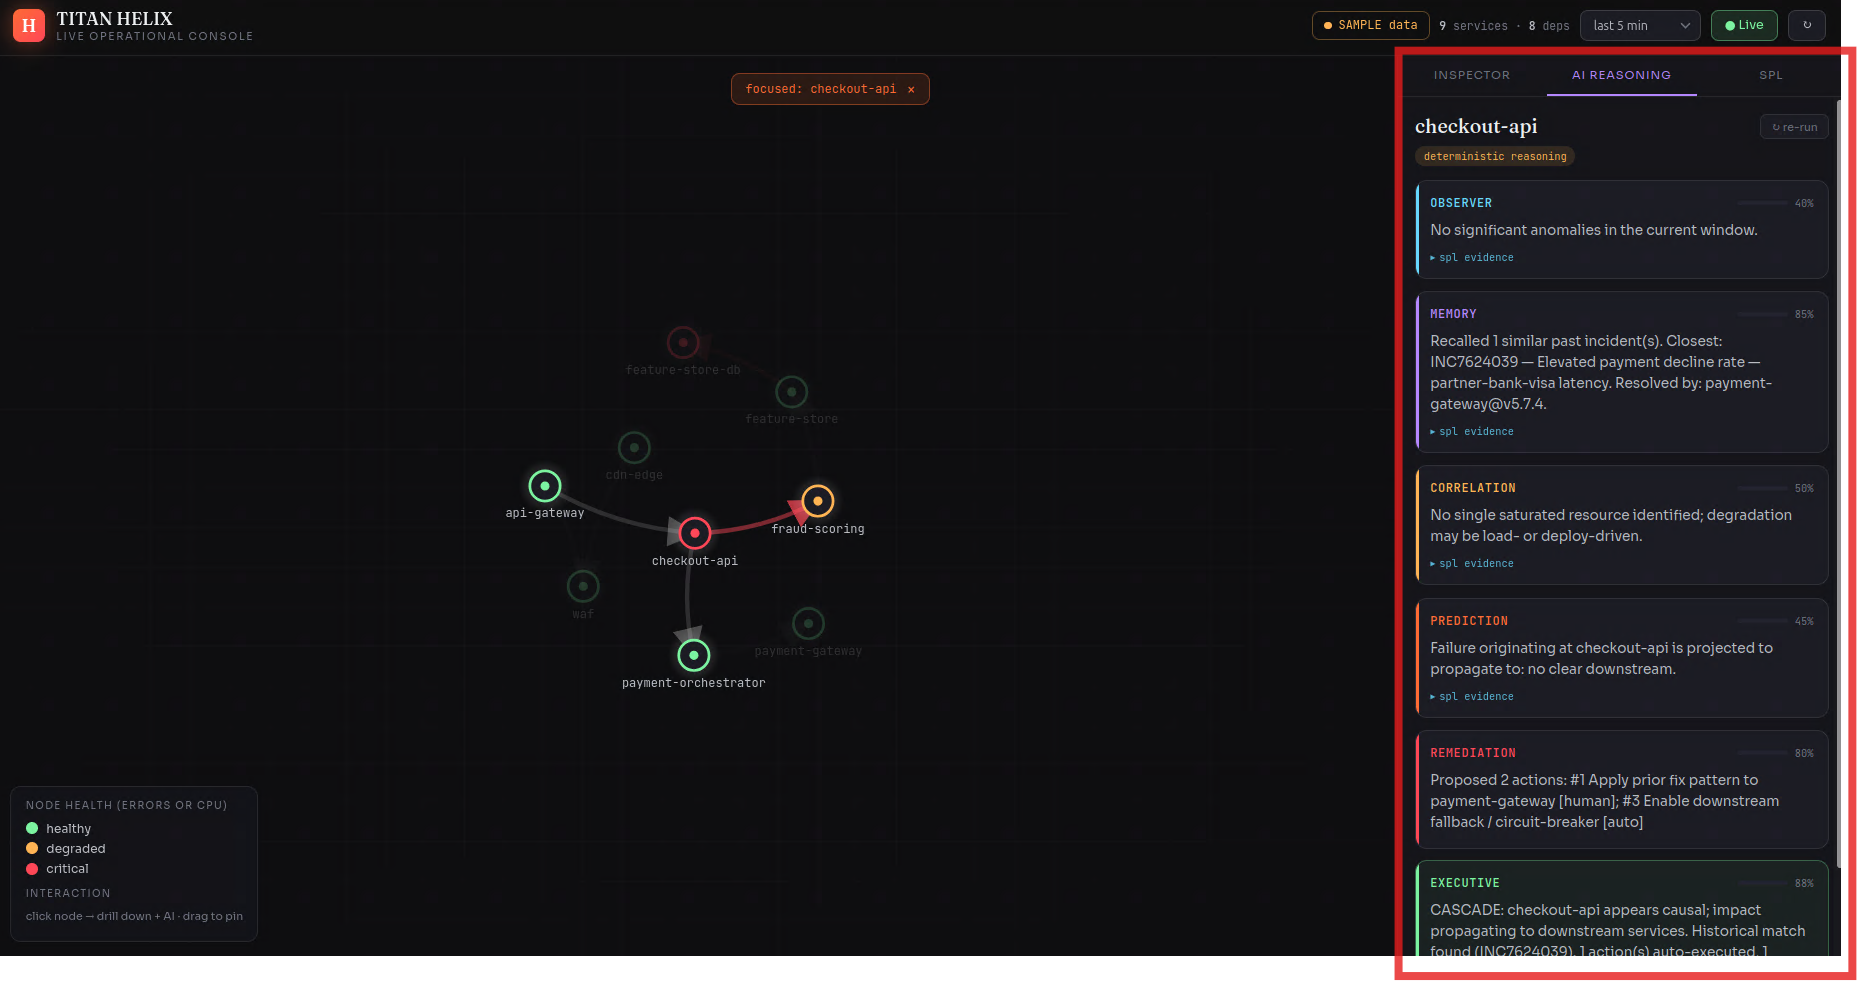
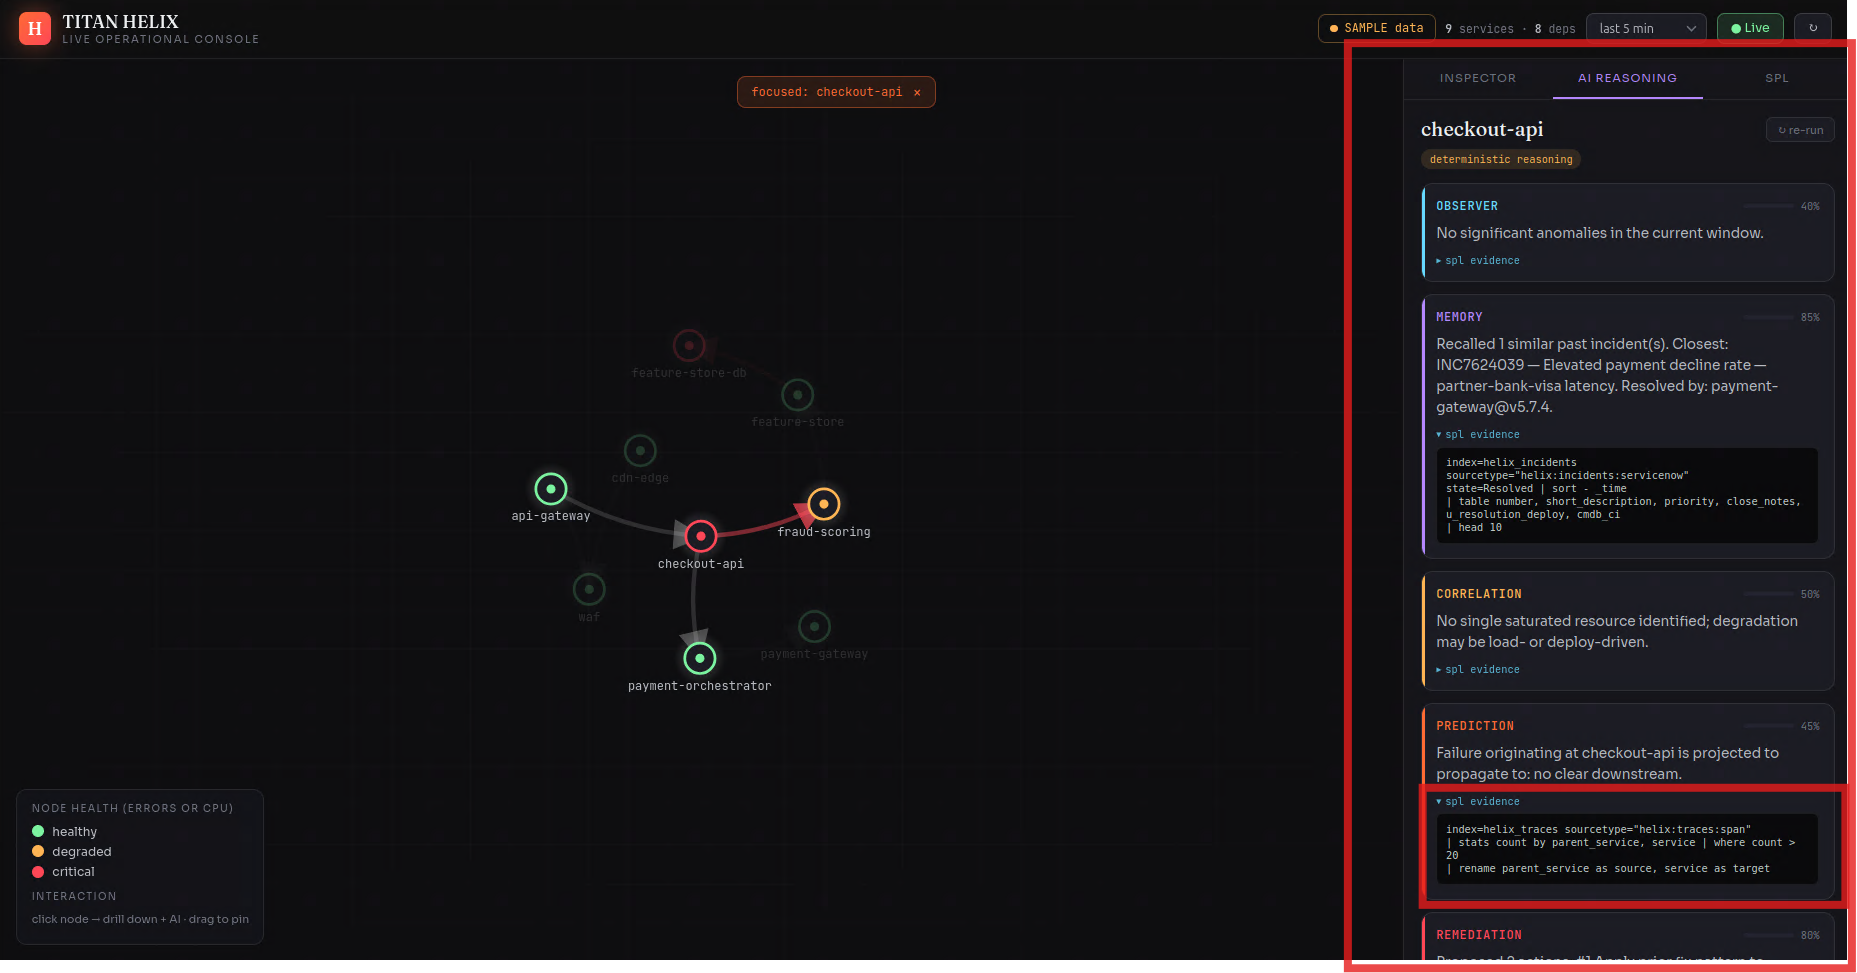
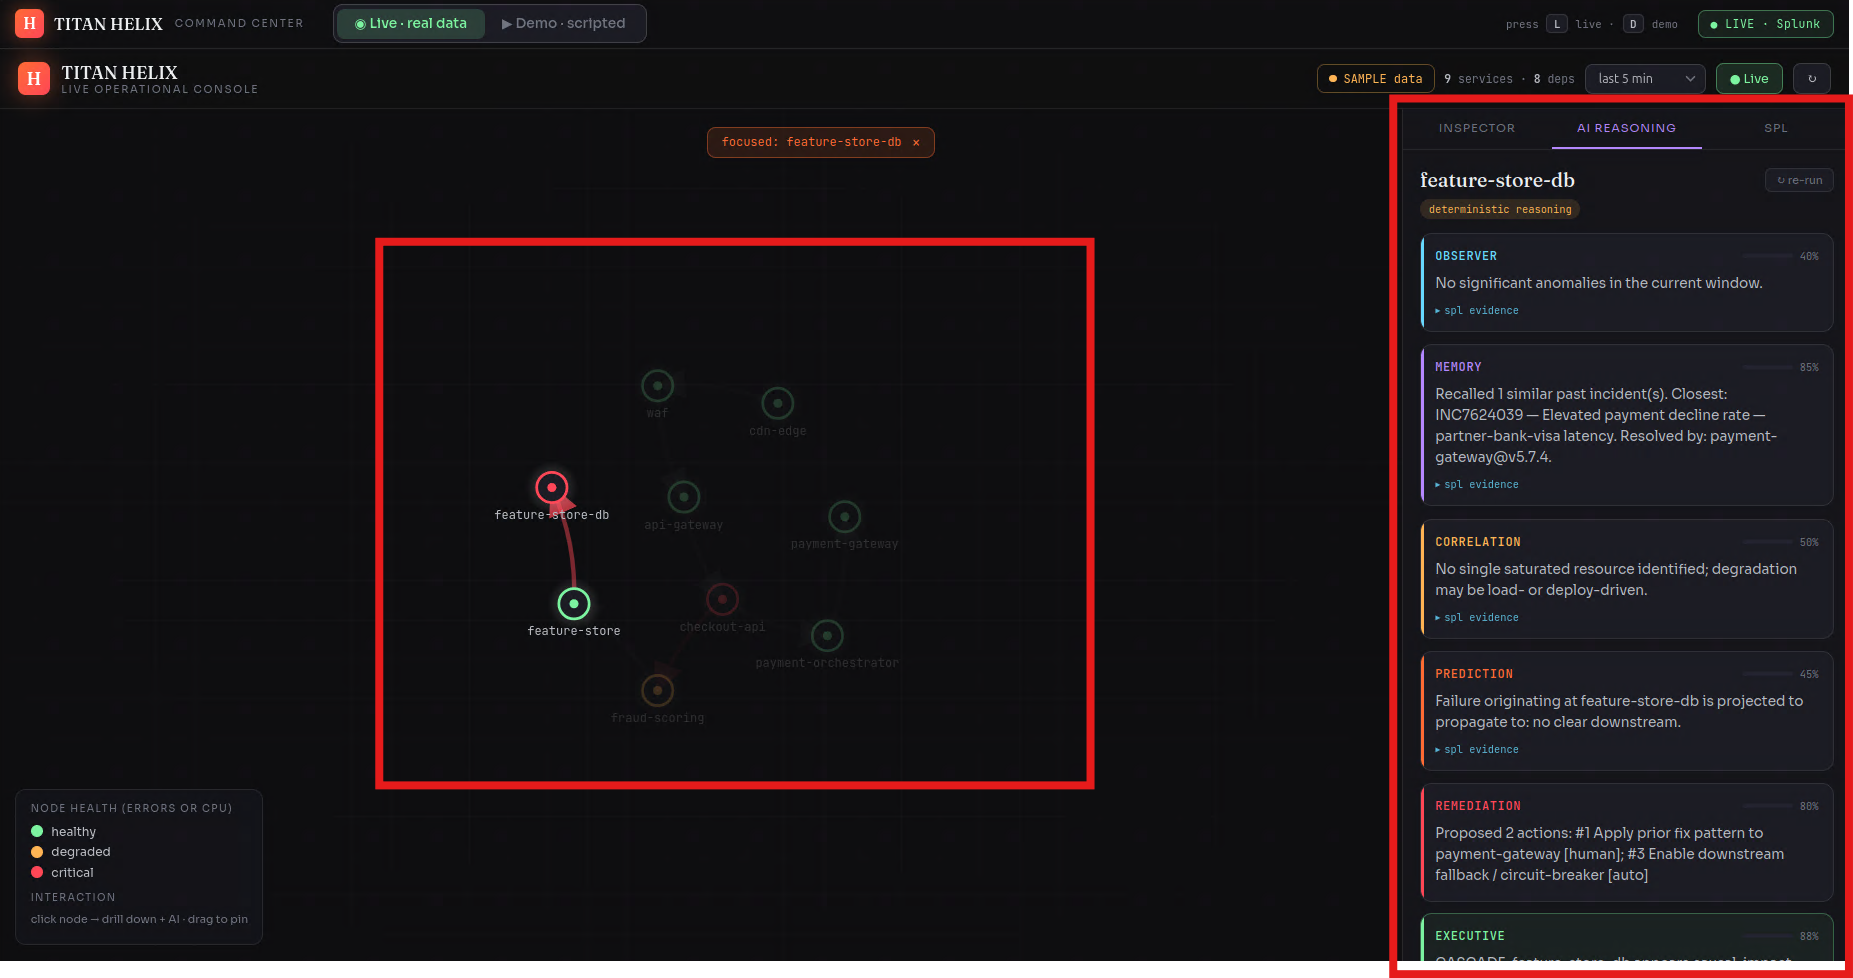
It stands up a synthetic-but-complete enterprise — 29 services across ~1,429 hosts — streaming metrics, logs, W3C traces, ServiceNow incidents, deploy events and business KPIs into Splunk Enterprise in real time. On top of that data runs a mesh of six specialist agents that behave like a good war room instead of a dashboard:
- observer catches the leading signal — the silent CPU climb, before any errors appear
- memory recalls the near-identical incident from weeks ago and how it was closed
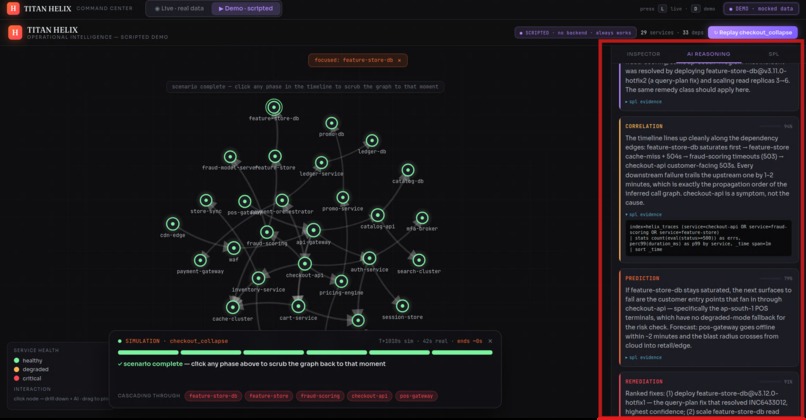
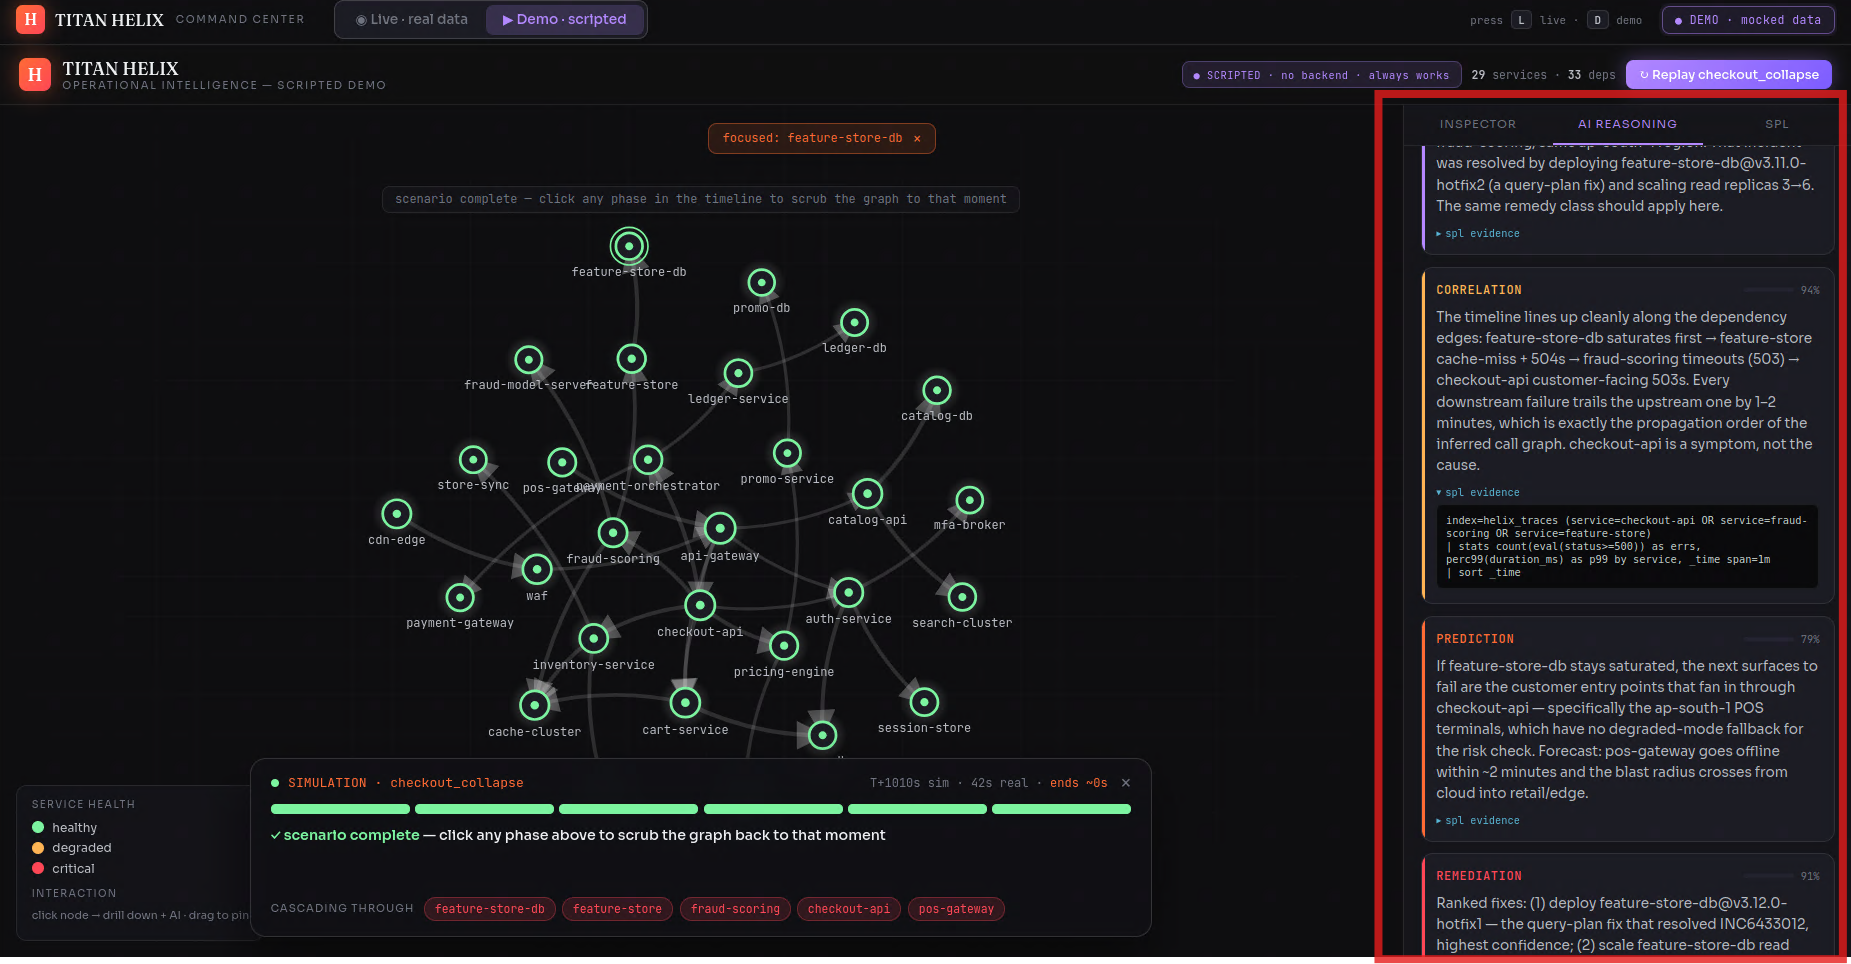
- correlation walks the call graph and proves which red service is a symptom and which is the cause
- prediction forecasts the blast radius — what fails next, and roughly when
- remediation ranks the fix by confidence
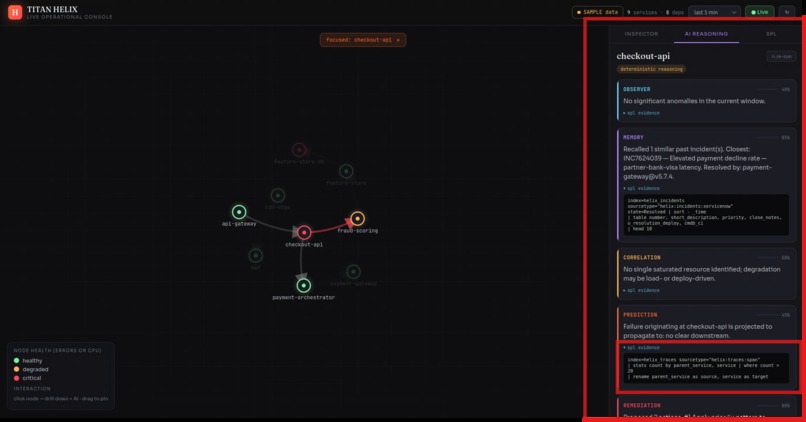
- executive writes the verdict, with the exact SPL behind every claim
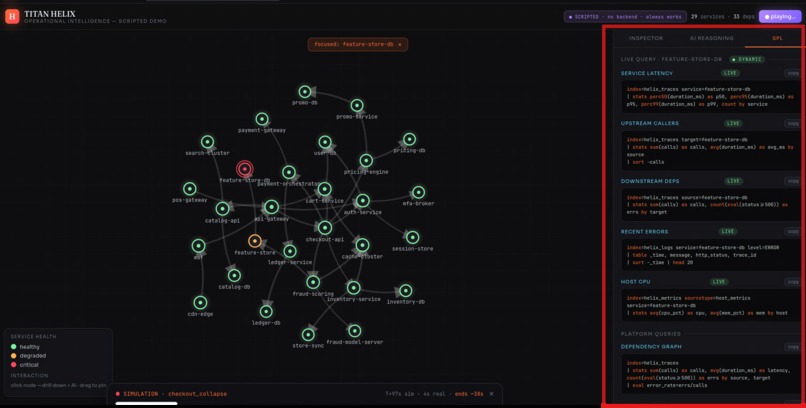
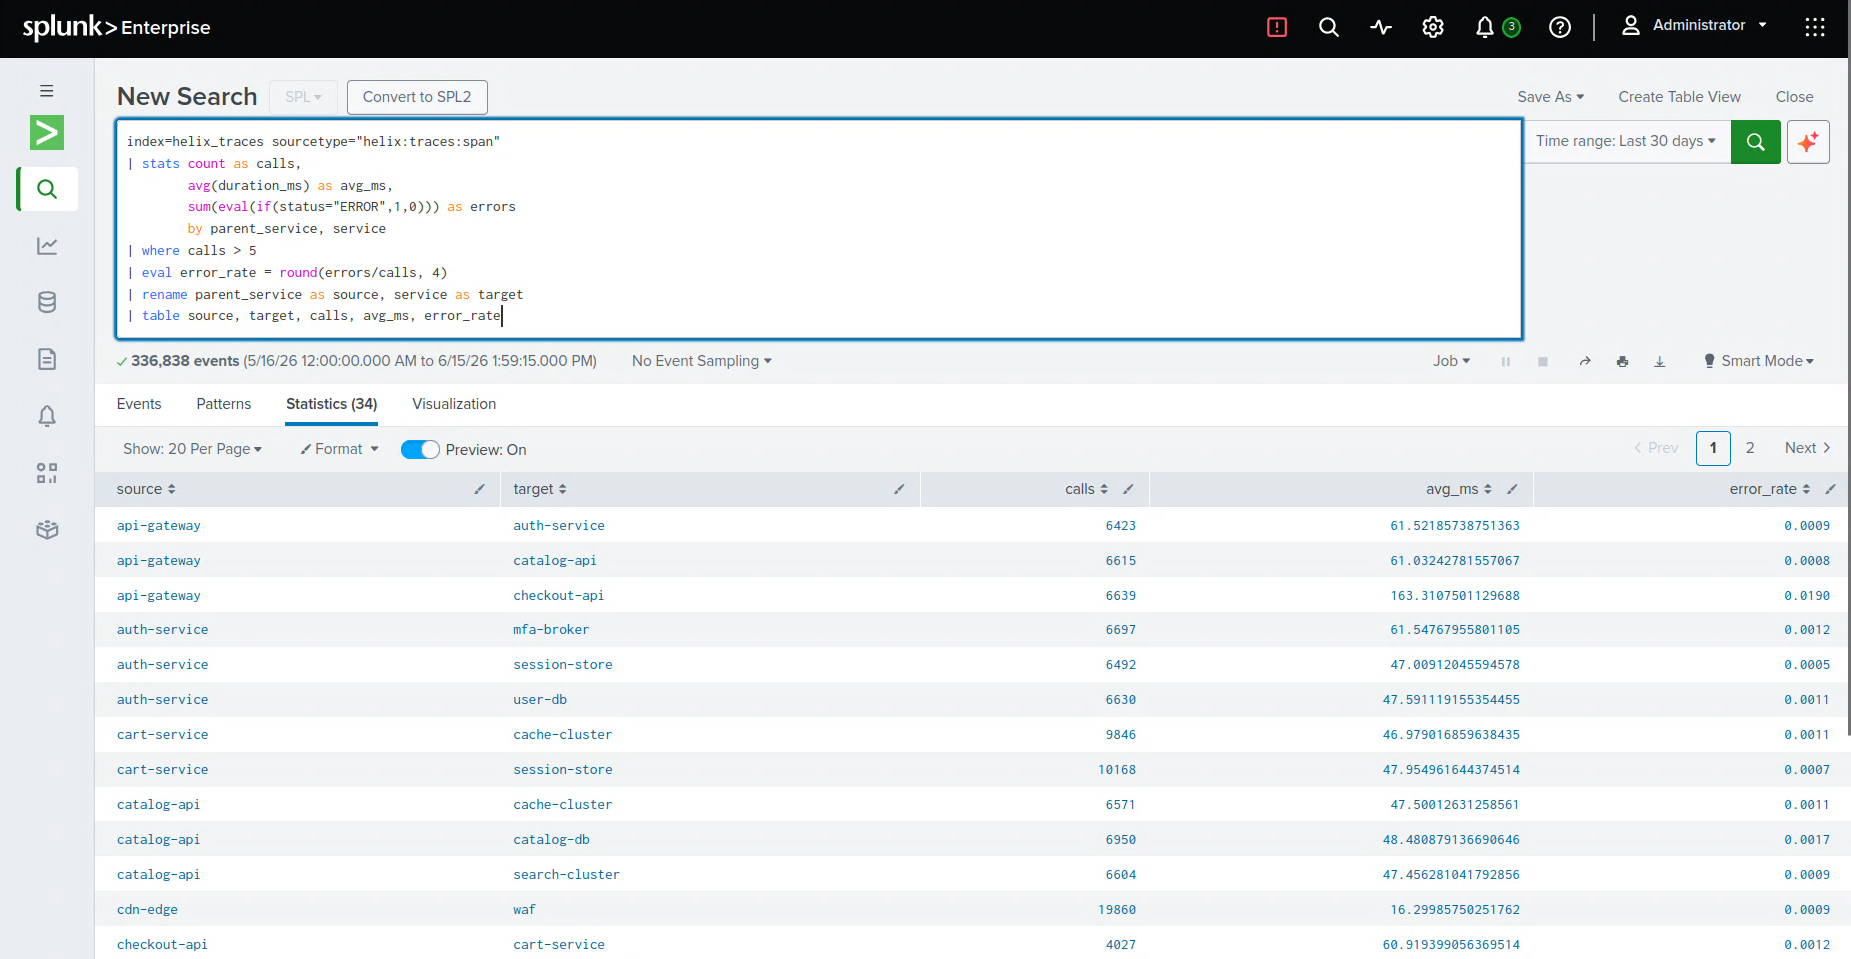
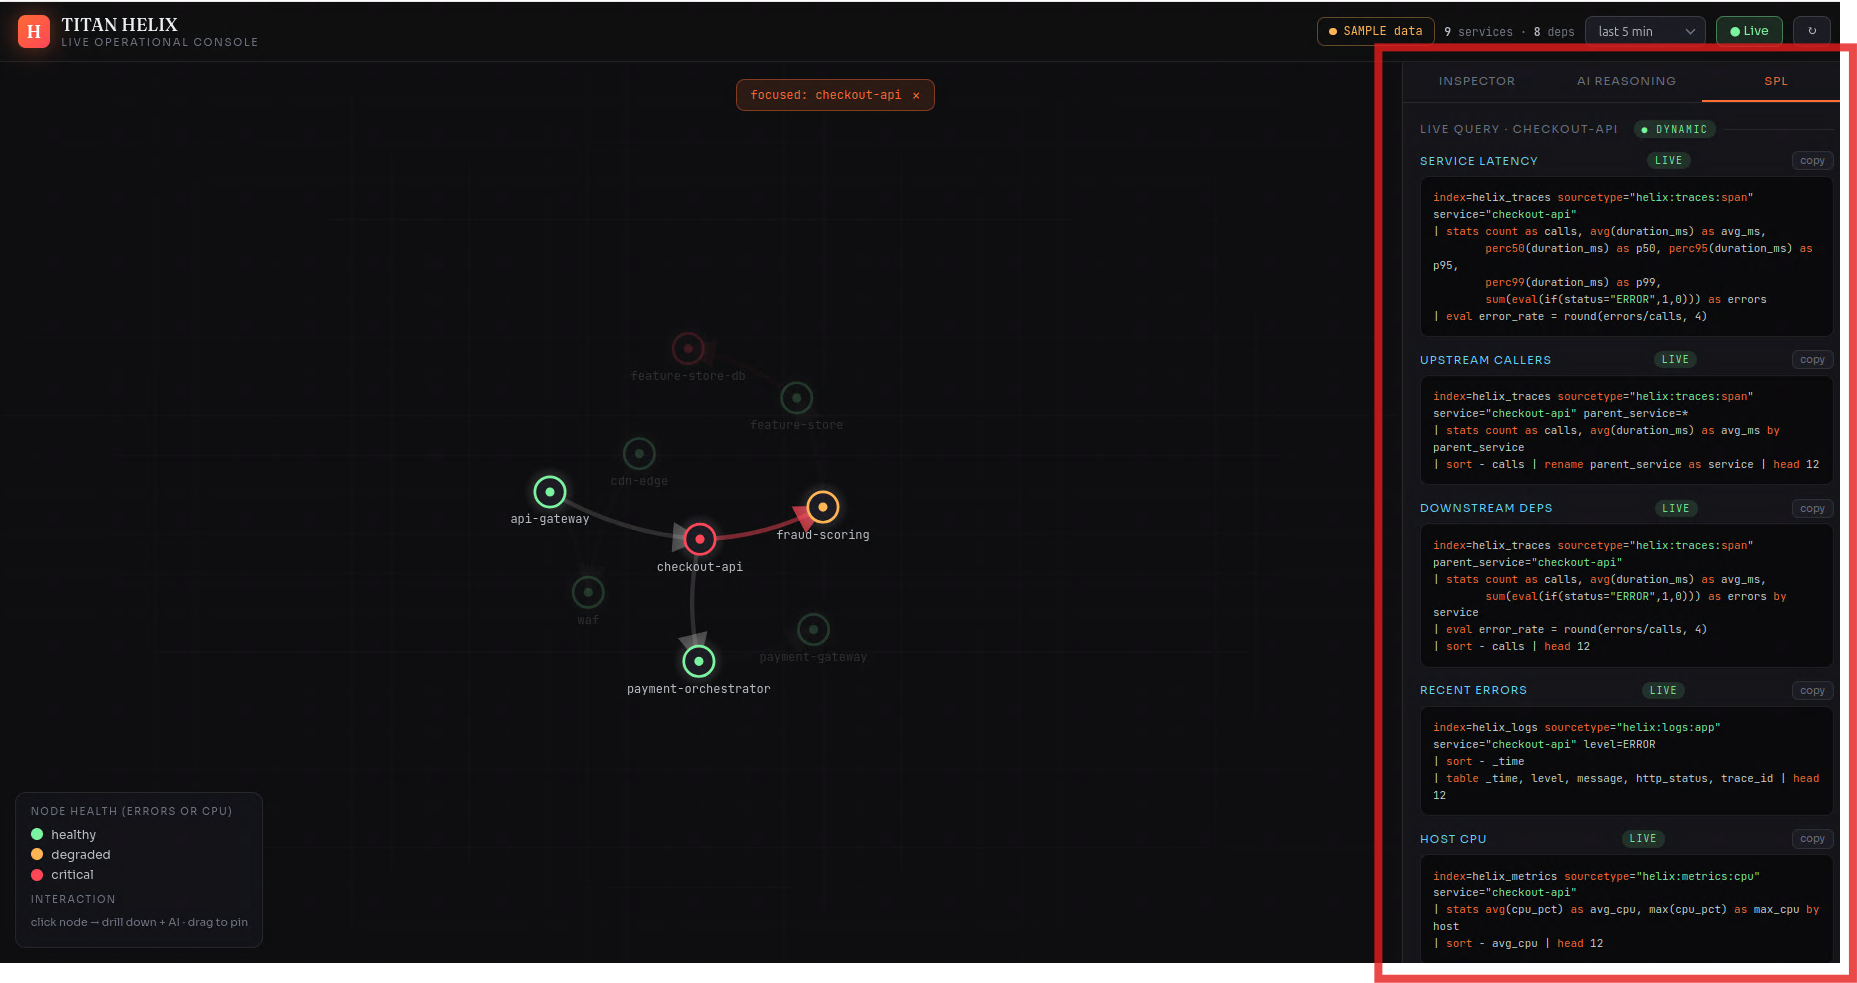
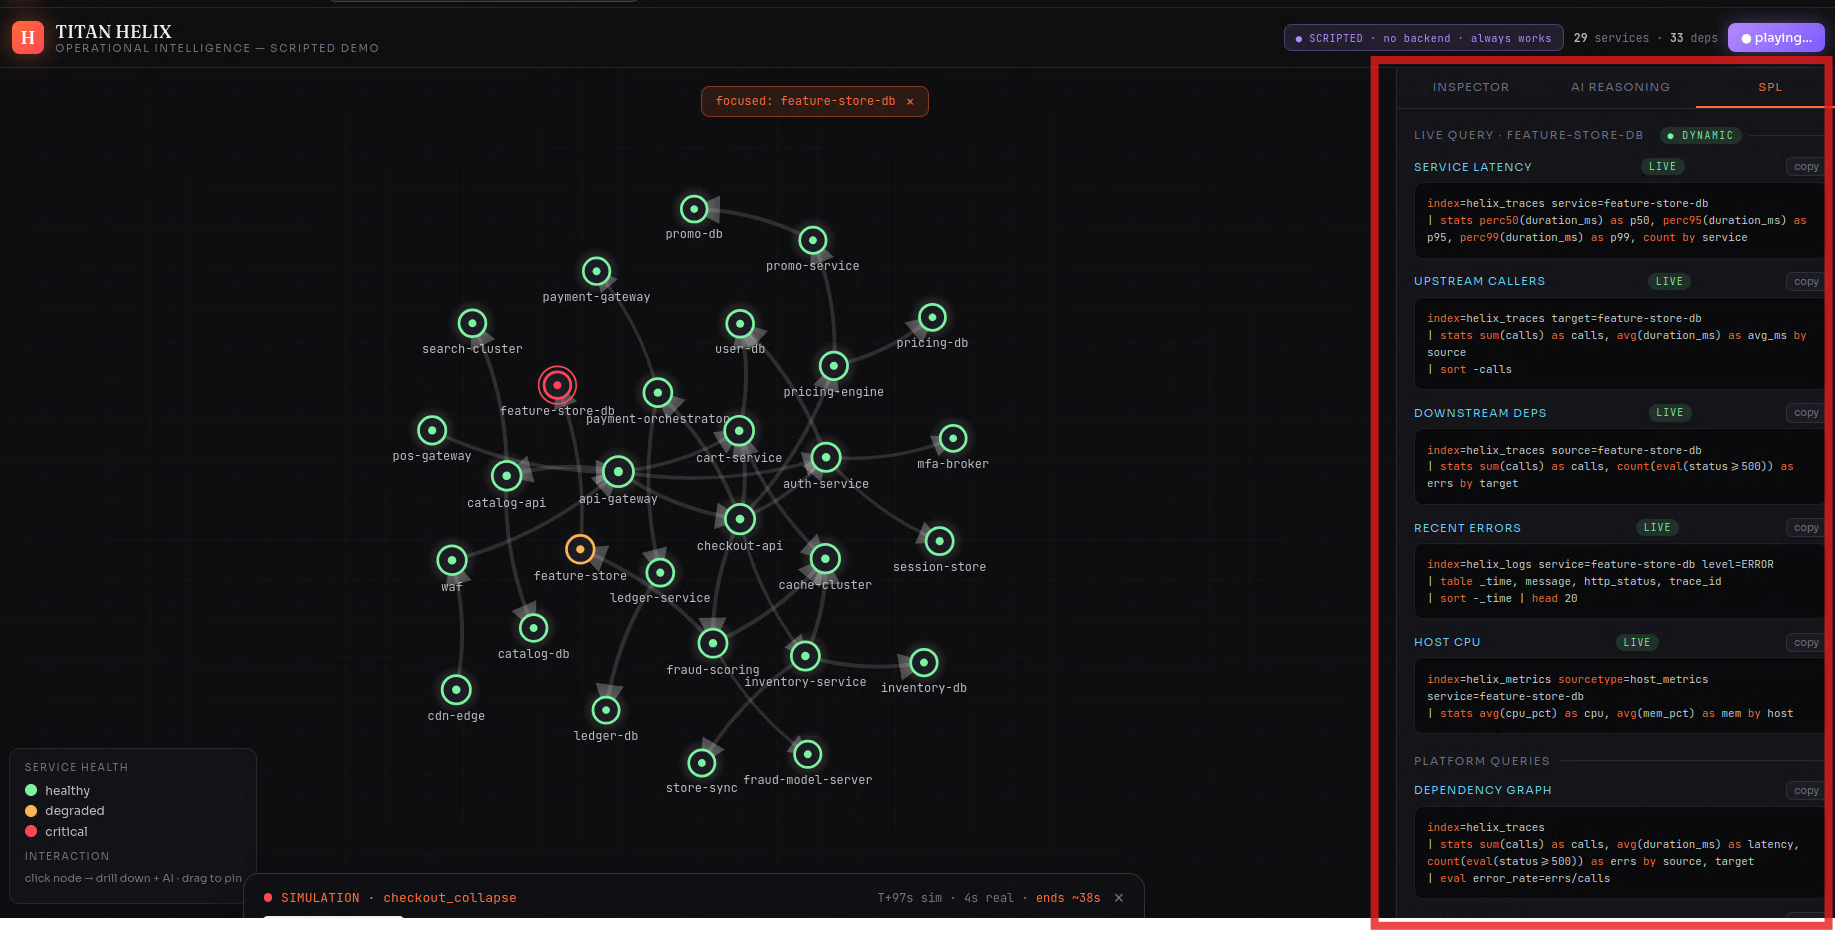
The agents never reach into Splunk Enterprise with hard-coded queries — they call it through MCP tools (search_spl, get_service, blast_radius, …), the same way a model would touch any system. Swap the synthetic world for a production Splunk Enterprise deployment and the reasoning layer above it doesn't change a line.
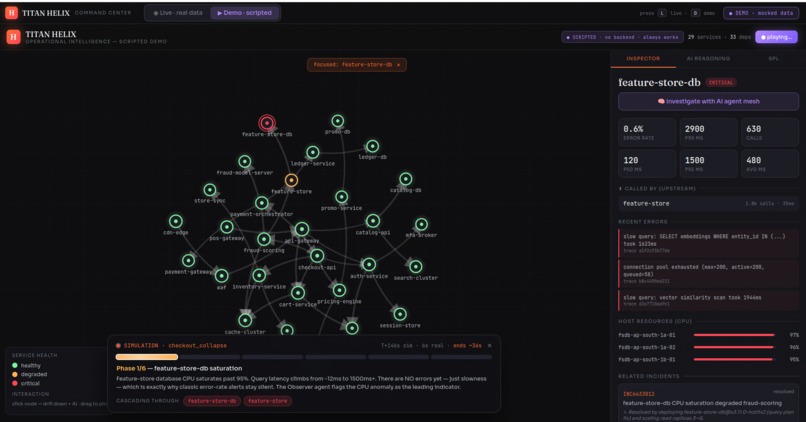
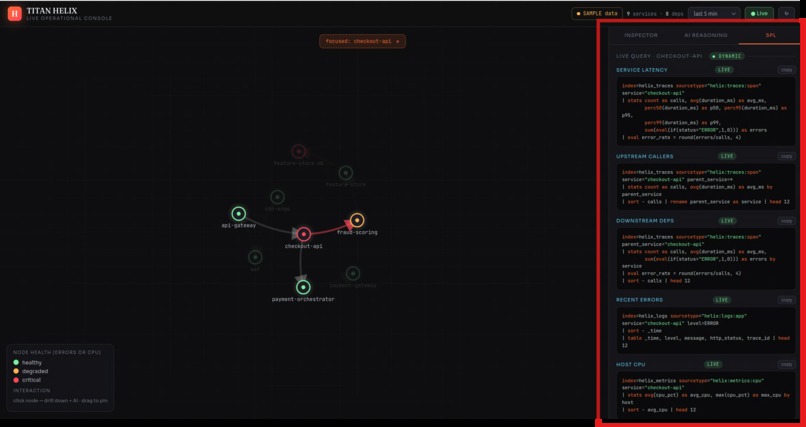
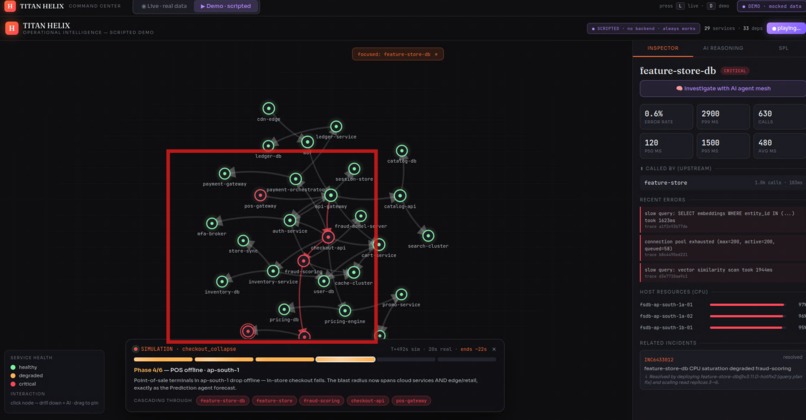
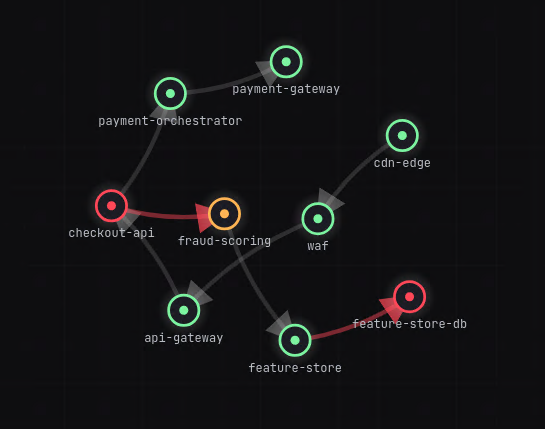
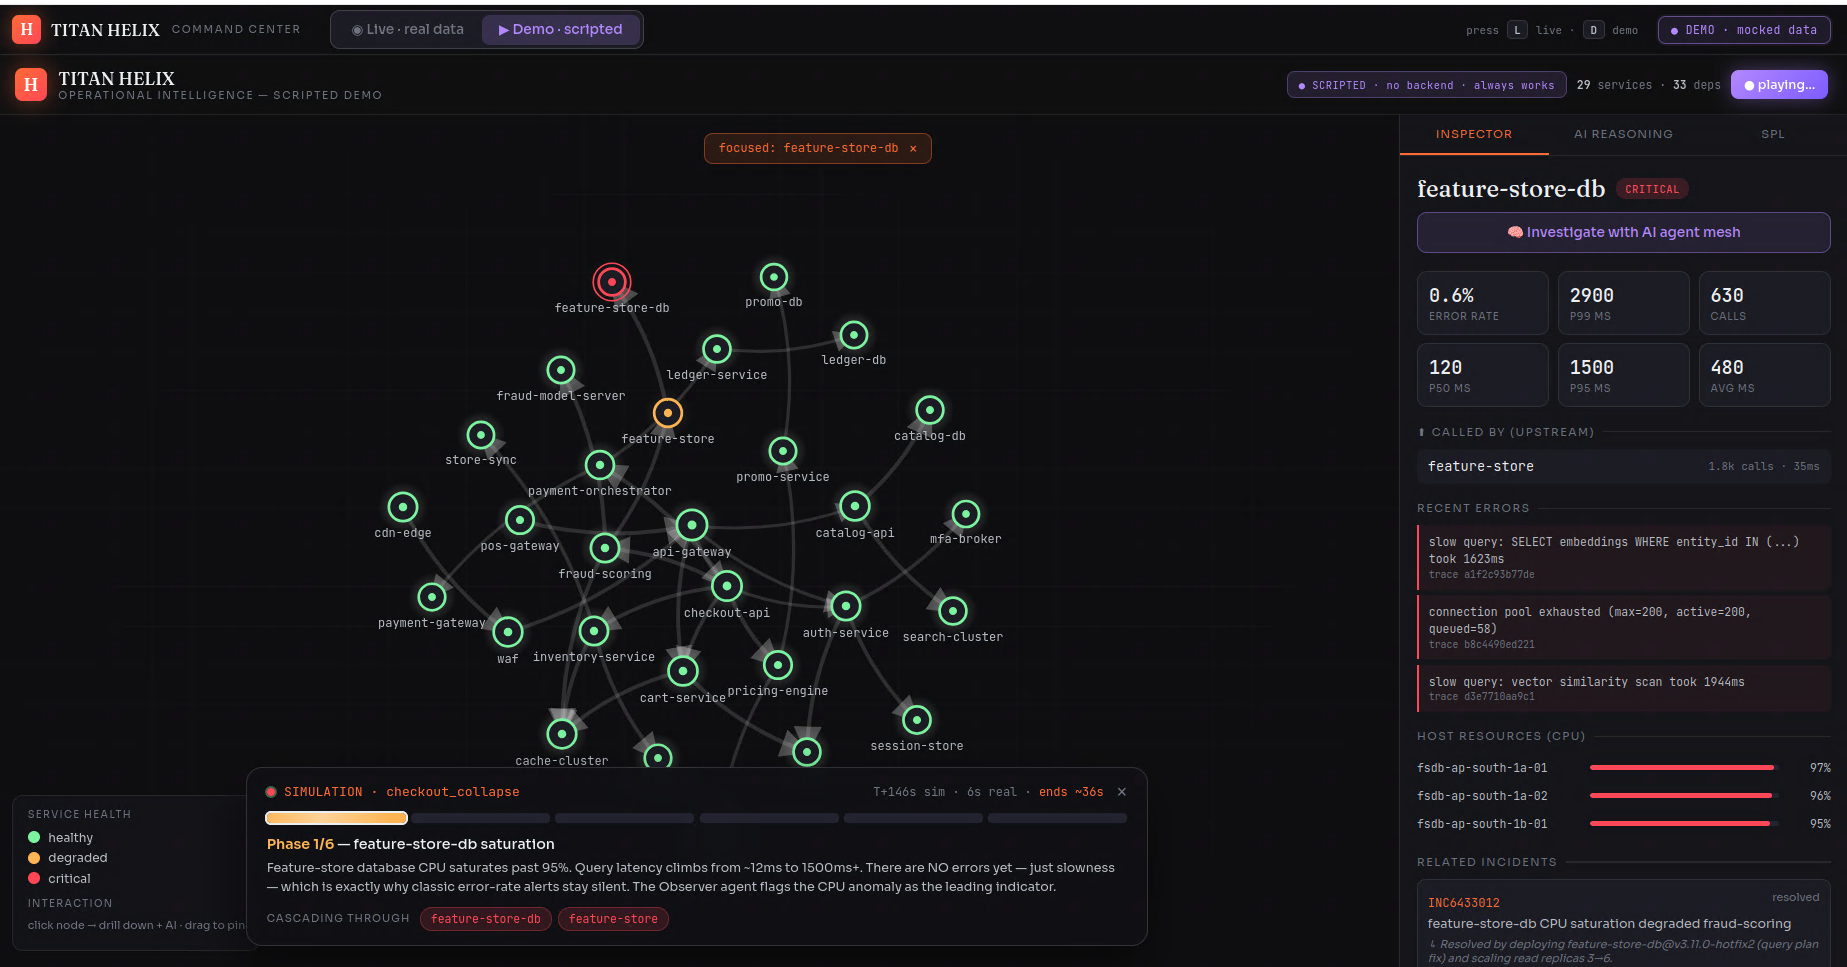
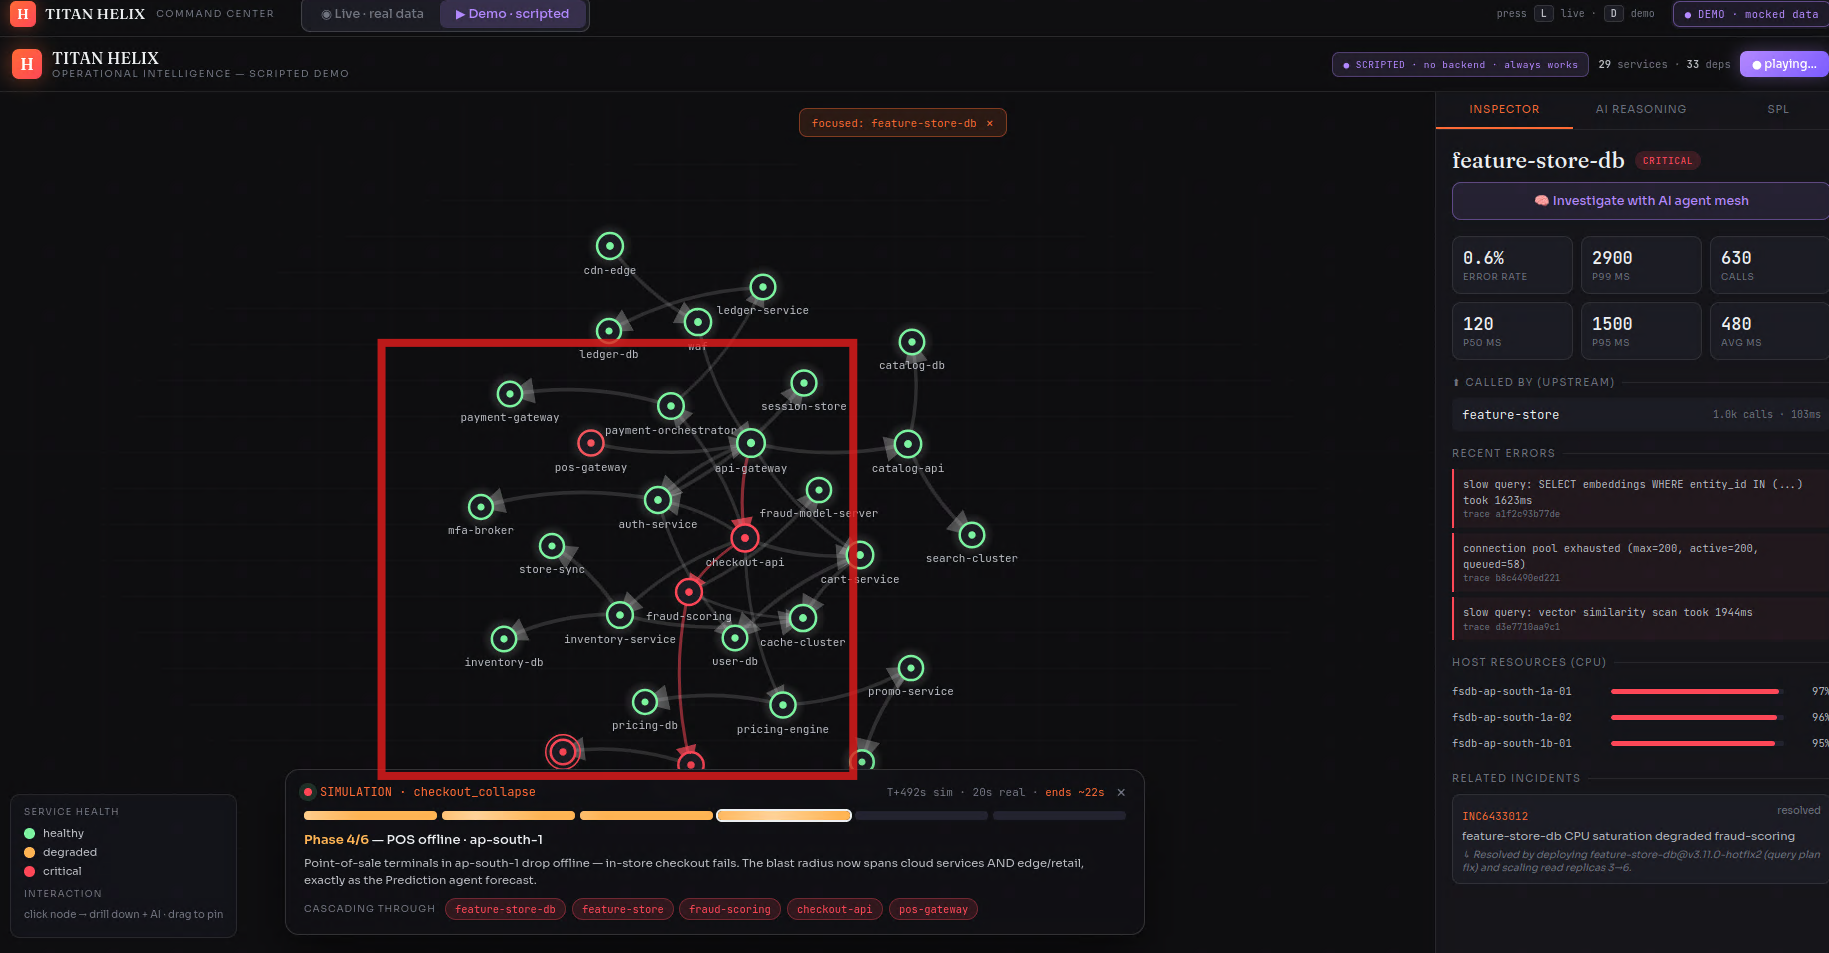
It ships as a live console (a force-directed dependency graph straight off SPL, with drill-downs and the agent investigation running on real data) and a scripted, deterministic demo of a checkout_collapse cascade that plays the same way every time — graph, phase timeline and AI verdict moving in perfect lockstep.
How we built it
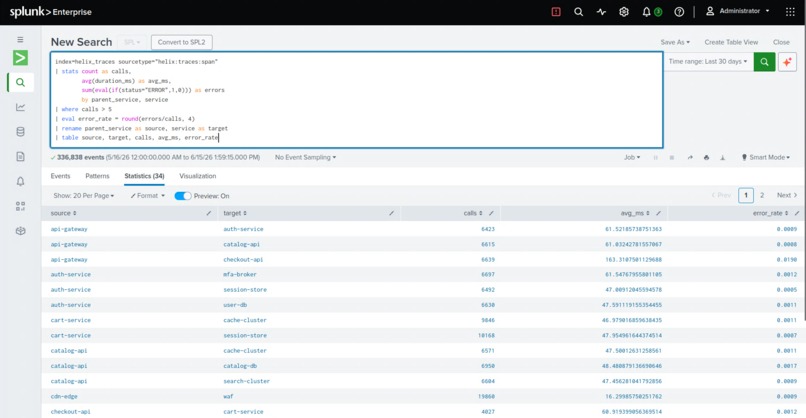
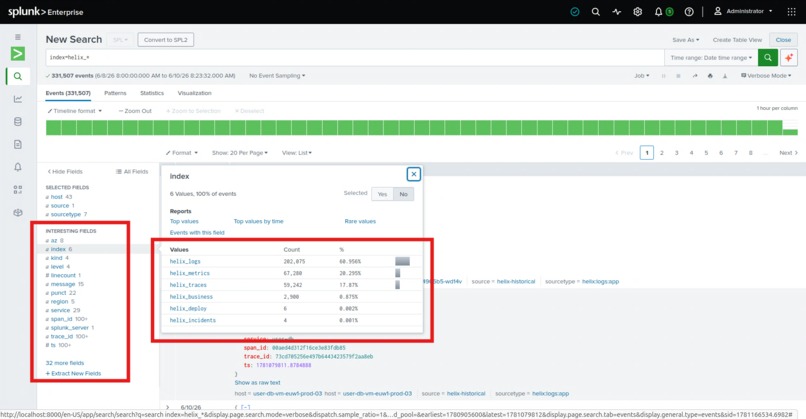
The spine is a pipeline. A synthetic telemetry generator holds a hidden topology — the true call graph and a known root cause — and emits events that obey it. Those land in Splunk Enterprise over HEC across seven purpose-built indexes (helix_metrics, helix_logs, helix_traces, helix_incidents, helix_deploy, helix_business, helix_audit). A FastAPI backend reads everything back over SPL and the REST API; the graph and every drill-down are SPL results, not a side database. The agent mesh is orchestrated with LangGraph, exposed to Splunk Enterprise through MCP-shaped tools, and runs in two modes — deterministic by default (every conclusion computed from the actual numbers and written in plain language) or, with an Anthropic key, handing the same evidence to Claude for the narrative. The whole thing runs on AWS EC2, with Splunk Enterprise itself in Docker, and a one-command setup.sh that's idempotent enough to survive a reboot.
The detail I'm quietly proud of is the data modeling. For the demo to be honest, the silent failure had to be physically real, not faked. So the generator models a saturating service the way queueing theory says it behaves — response time climbing as utilization $\rho$ approaches 1 while the service still succeeds:
$$T \;=\; \frac{T_0}{1-\rho}$$
At $\rho = 0.94$, latency is roughly $16\times$ baseline — painfully slow — yet every response is still 200 OK. That is exactly the blind spot that error-rate alerting, which only fires when $\text{err} > \theta$, will never see. Blast radius then falls out of the graph as a reachable set: from a failing node $v$, the set of services that can be reached along depends-on edges, $R(v) = {\,u : v \leadsto u\,}$.
The frontend is a dependency-free vanilla-JS console with a hand-written force-directed graph, a presenter shell, an animated 4K SVG architecture diagram, and a landing page with a Three.js globe of the product. No build step, so it just works.
Challenges we ran into
The hardest problem wasn't the AI — it was making the live cascade visibly correct.
Early on, the live console would narrate "Phase 3 — checkout-api collapse" while every node on the graph stayed green. It looked broken. The cause was subtle and instructive: the scenario raised the root cause's CPU by a fixed amount, but that landed it below the threshold the graph used to color a node critical — so the true culprit, by design error-free, never turned red, and a scripted narrative was confidently asserting a failure the live data didn't show. The lesson was sharper than the bug: never overlay a script on top of live data and hope they agree. I tore the scripted cascade out of the live view entirely and split the product cleanly — Live is honest real-time Splunk Enterprise data, Demo is a deterministic scripted incident where the graph, timeline and AI can't desync because nothing depends on Splunk Enterprise's timing. The confusion vanished.
The rest were the usual scar tissue. Splunk Enterprise in Docker now needs two license-acceptance flags, and its CLI quietly ignores the HEC token you pass it and generates a random one — so a deterministic token has to be set over REST from the host. Indexing latency fought short query windows. Making the AI legible — staggered agent reveals, confidence bars, collapsible SPL evidence — took as much care as the reasoning itself. And GitHub Pages is static-only, so the public demo had to be fully self-contained while the live console kept its backend.
Accomplishments that we're proud of
The one that matters most: it can be checked. Because the synthetic world has a known root cause, TITAN HELIX isn't just plausible — it's provable. It either names feature-store-db or it doesn't, and it hits the answer every run. Most AI demos can only be convincing; this one has an answer key.
Beyond that — the reasoning is fully in the open, with the SPL behind every claim. The MCP seam is real, so the same agents would run against a production Splunk Enterprise unchanged. The whole project is reproducible from git clone && ./setup.sh, with a pre-demo go/no-go gate so it doesn't surprise anyone on stage. And the honest Live/Demo separation turned a confusing build into one a stranger can pick up and understand in sixty seconds.
What we learned
That in observability, the data was never the bottleneck — the reasoning on top of it is, and that's now an addressable problem. That MCP is the right seam: putting Splunk Enterprise behind typed tools rather than glue code is what makes the reasoning portable from a synthetic world to a real one. That deterministic-first beats LLM-only for something you have to trust and demo — computing conclusions from the actual telemetry is more honest, more reproducible, and lets the LLM be an upgrade rather than a dependency. And, the hard way, that a system is only as trustworthy as its least consistent view — a single scripted overlay contradicting live data costs you the whole room.
I also got to put queueing theory to practical use, which I did not expect from an AIOps project.
What's next for TITAN HELIX - Agentic AIOps super-agent for Splunk Enterprise
Wire in the official Splunk MCP server so the tool fabric is fully MCP-native, then point the mesh at a real Splunk Enterprise deployment rather than the synthetic world. Give the memory agent an actual learning loop — recommendations that improve as real incidents are resolved — instead of deterministic recall. Take the autonomous closed loop (it already opens a ServiceNow incident and proposes a hotfix) from proposal to guarded action, with approval gates. Add more scenarios and learned correlation, multi-tenant isolation, and write-back into the incident and event-ops tooling teams already run. The end state is an operator that doesn't just explain the outage — it resolves the routine ones and tells you it did.

Log in or sign up for Devpost to join the conversation.