🚨 Inspiration
It started with a simple but unsettling question:
What happens to a SOC analyst at 2:47 AM when 847 alerts fire at once?
We thought about Arjun — a bank SOC analyst staring at a Splunk dashboard flooded with credential stuffing alerts. Each alert looks routine. None of them, individually, screams danger. He has to manually triage all 847, cross-reference IPs, check logs, and figure out if this is noise or a real attack.
By the time he connects the dots — the accounts are already compromised.
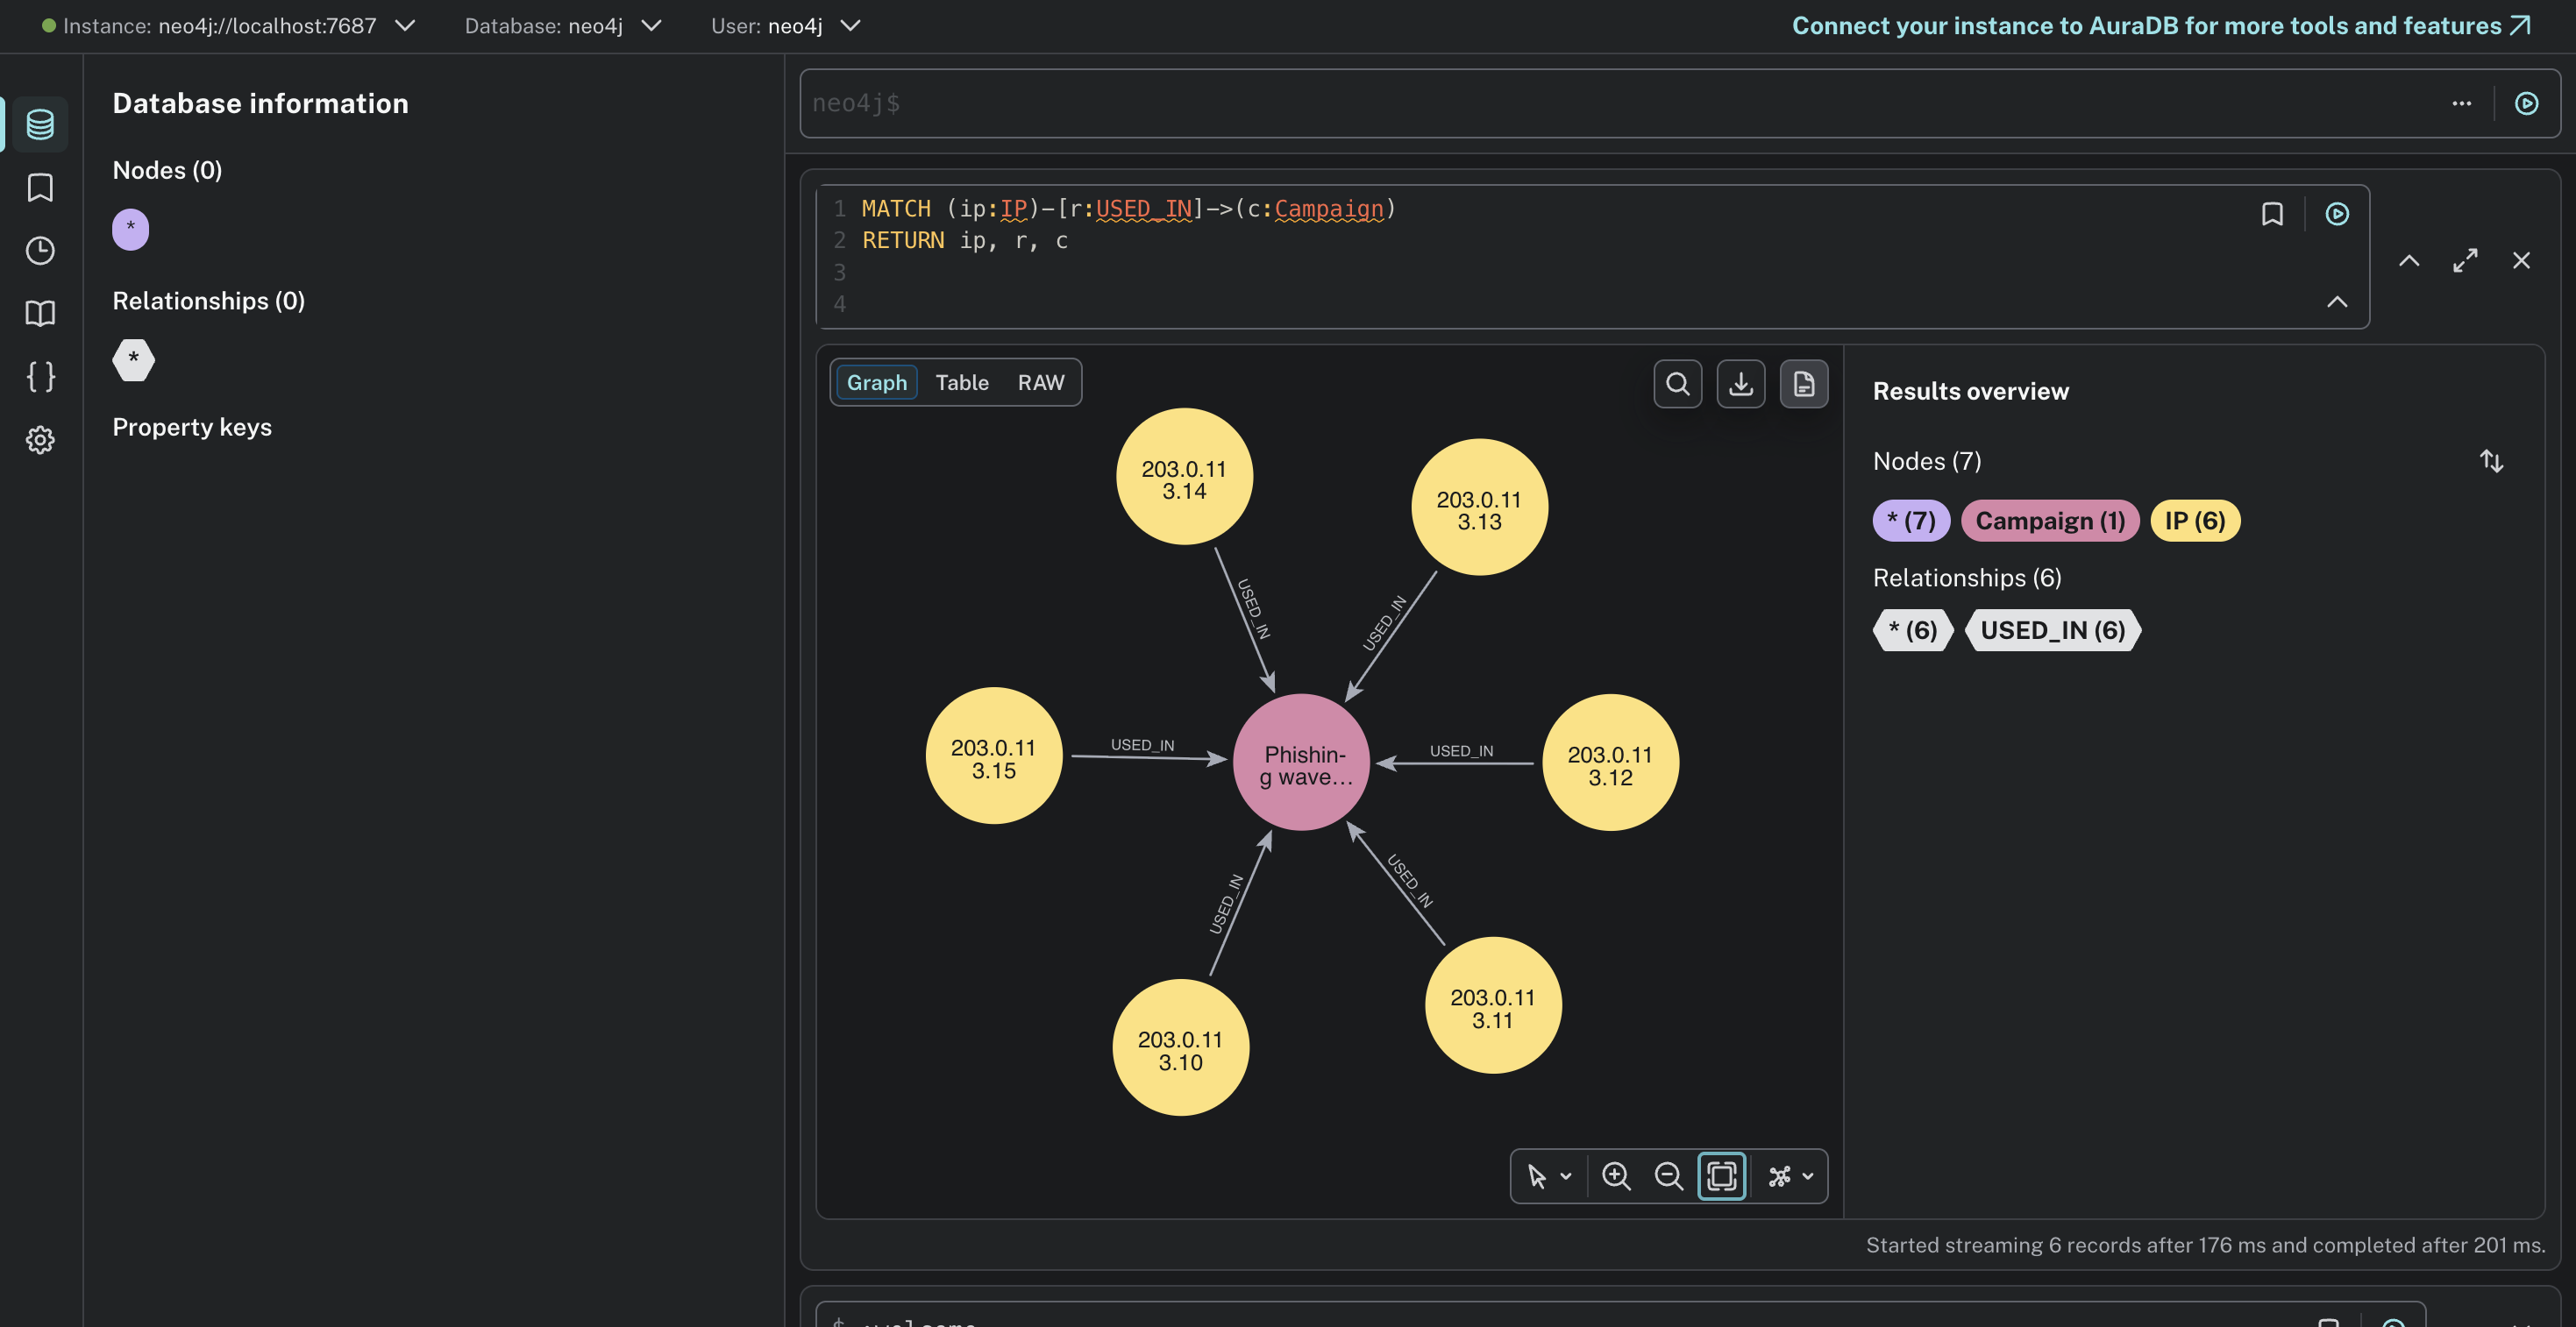
What really hit us was this: the 6 IPs attacking tonight were the same IPs that ran a phishing campaign 3 days ago. Every other tool missed it because they check alerts in isolation. No memory. No context. No connection between past and present.
That's the gap we wanted to close. Not just faster alerts — but smarter memory.
⚡ What it does
ThreatGraph uses three Splunk AI capabilities:
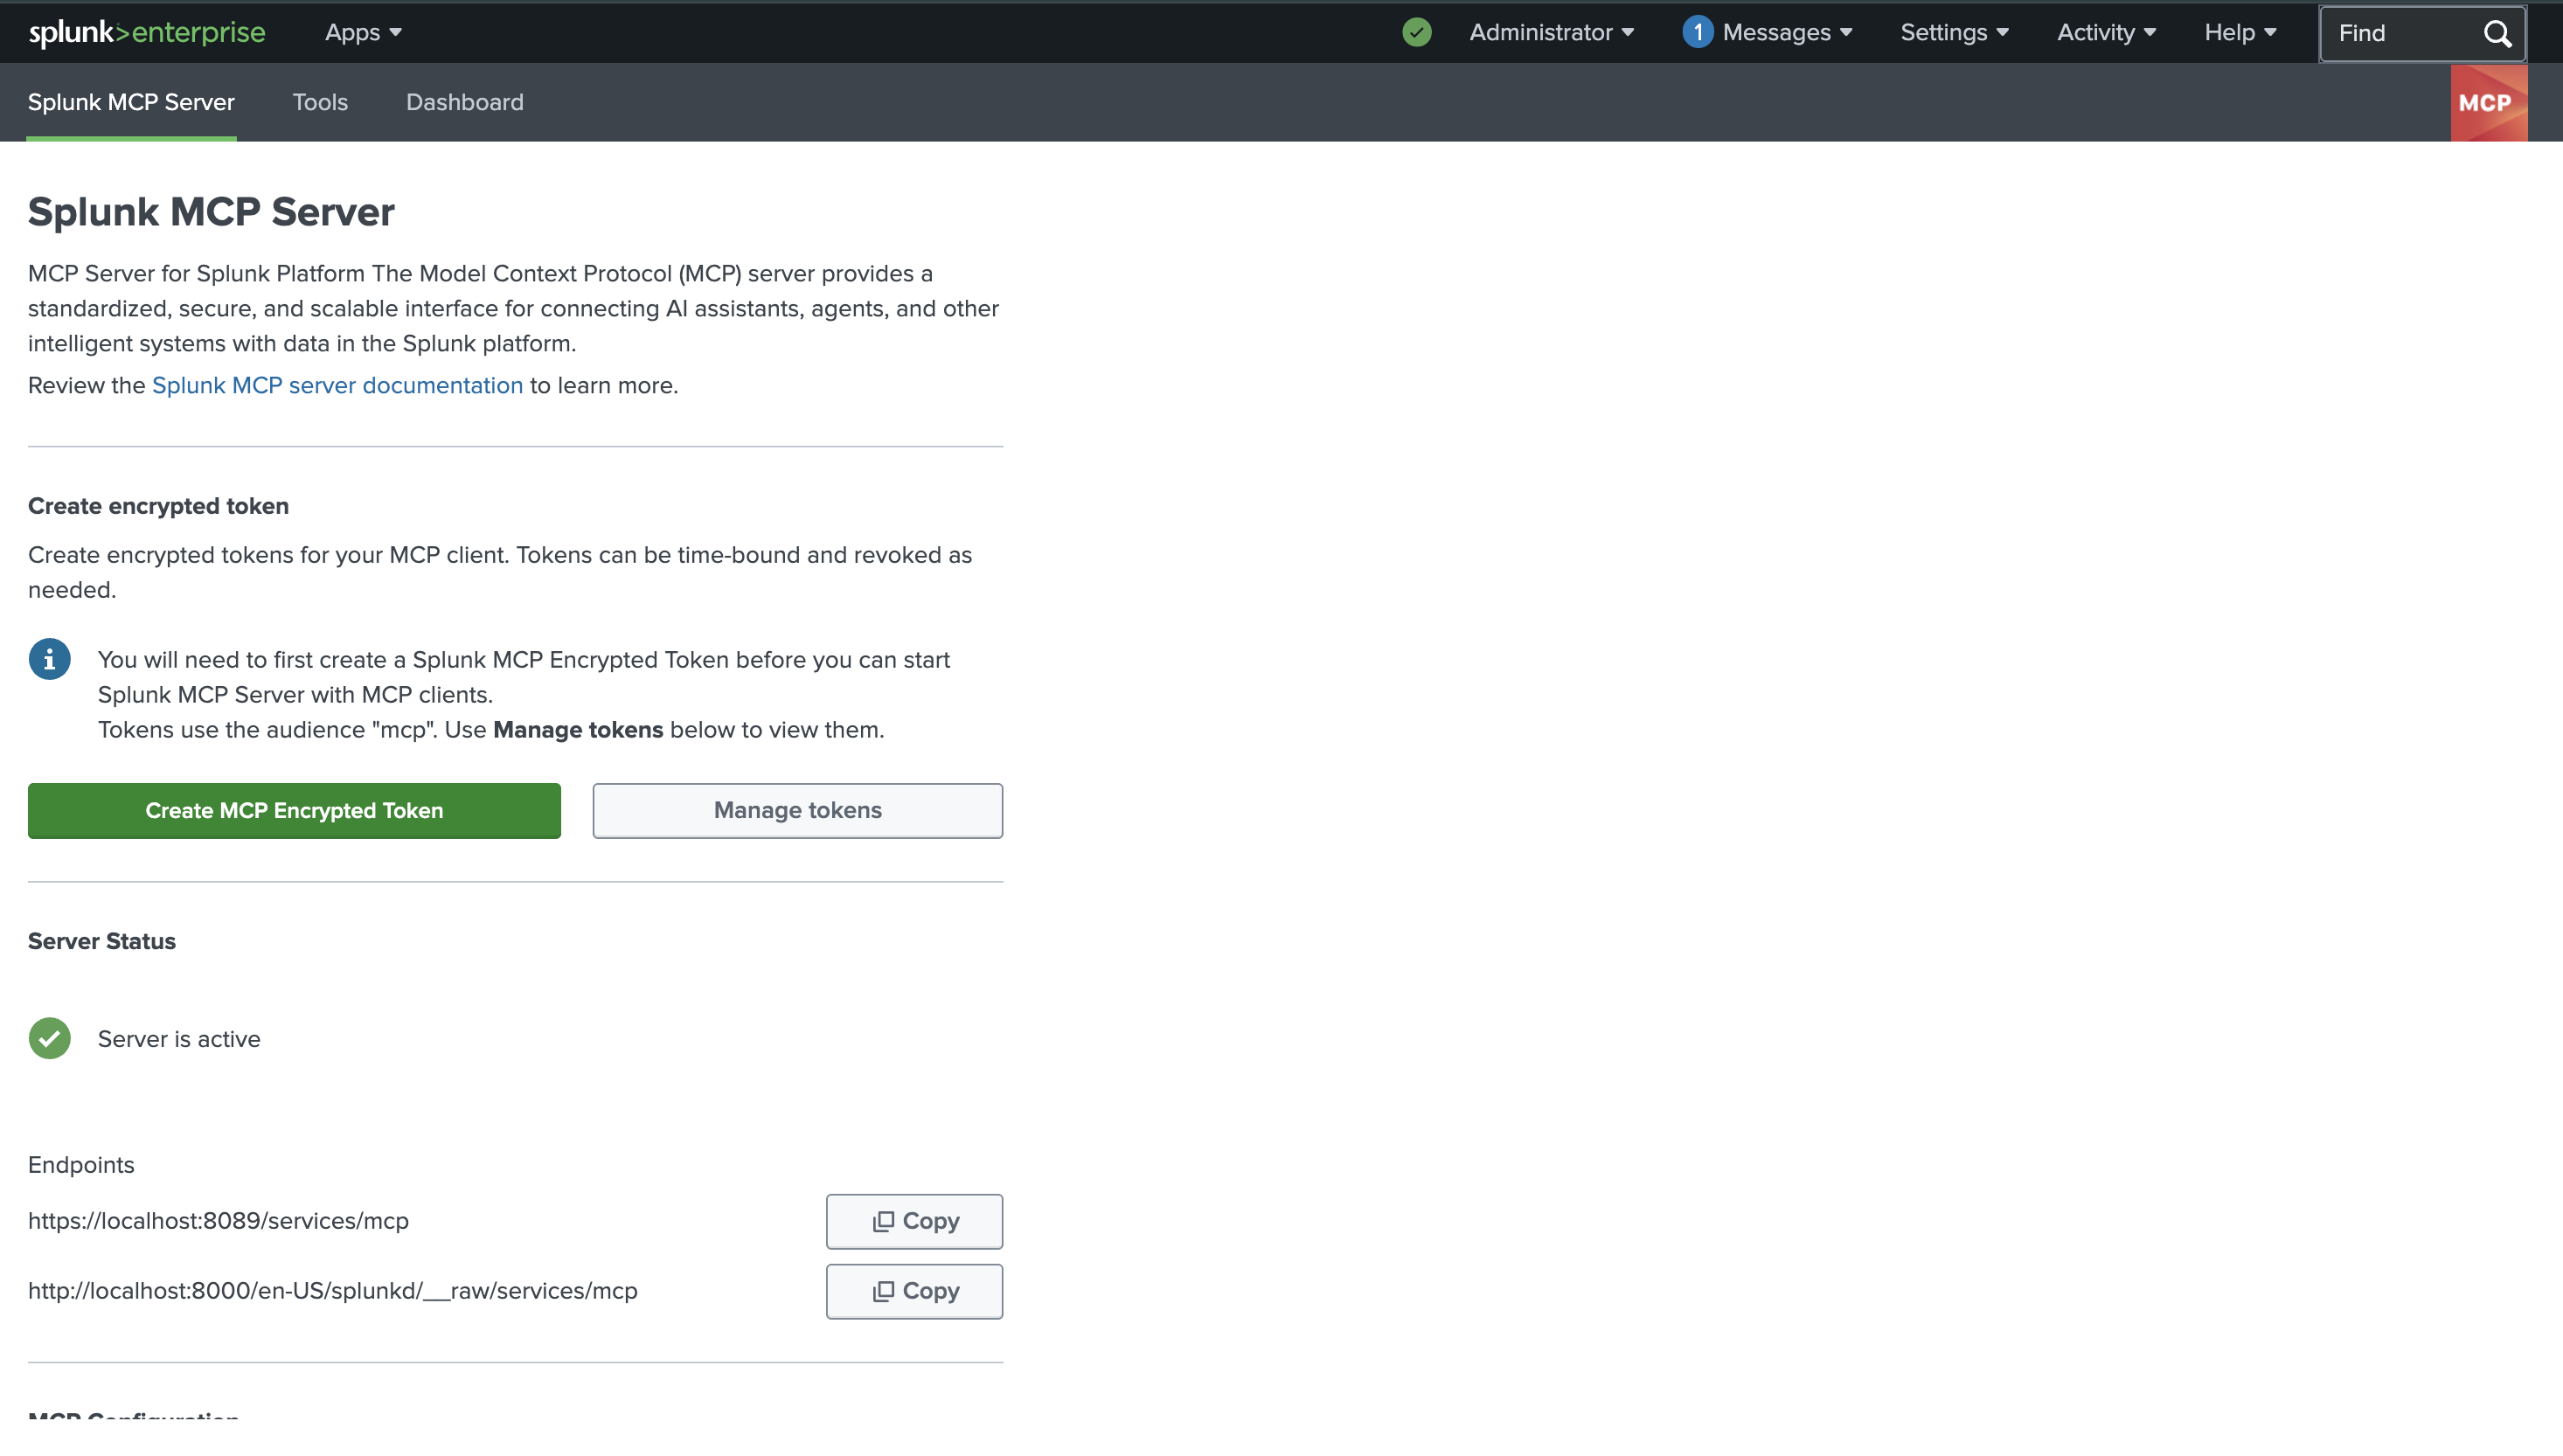
- ✅ Splunk MCP Server (app #7931) — agents query Splunk via MCP protocol with encrypted token auth
- ✅ Splunk AI Assistant — natural language to SPL queries inside the SOC dashboard
- ✅ Splunk HEC + SPL — real-time log ingestion and search pipeline
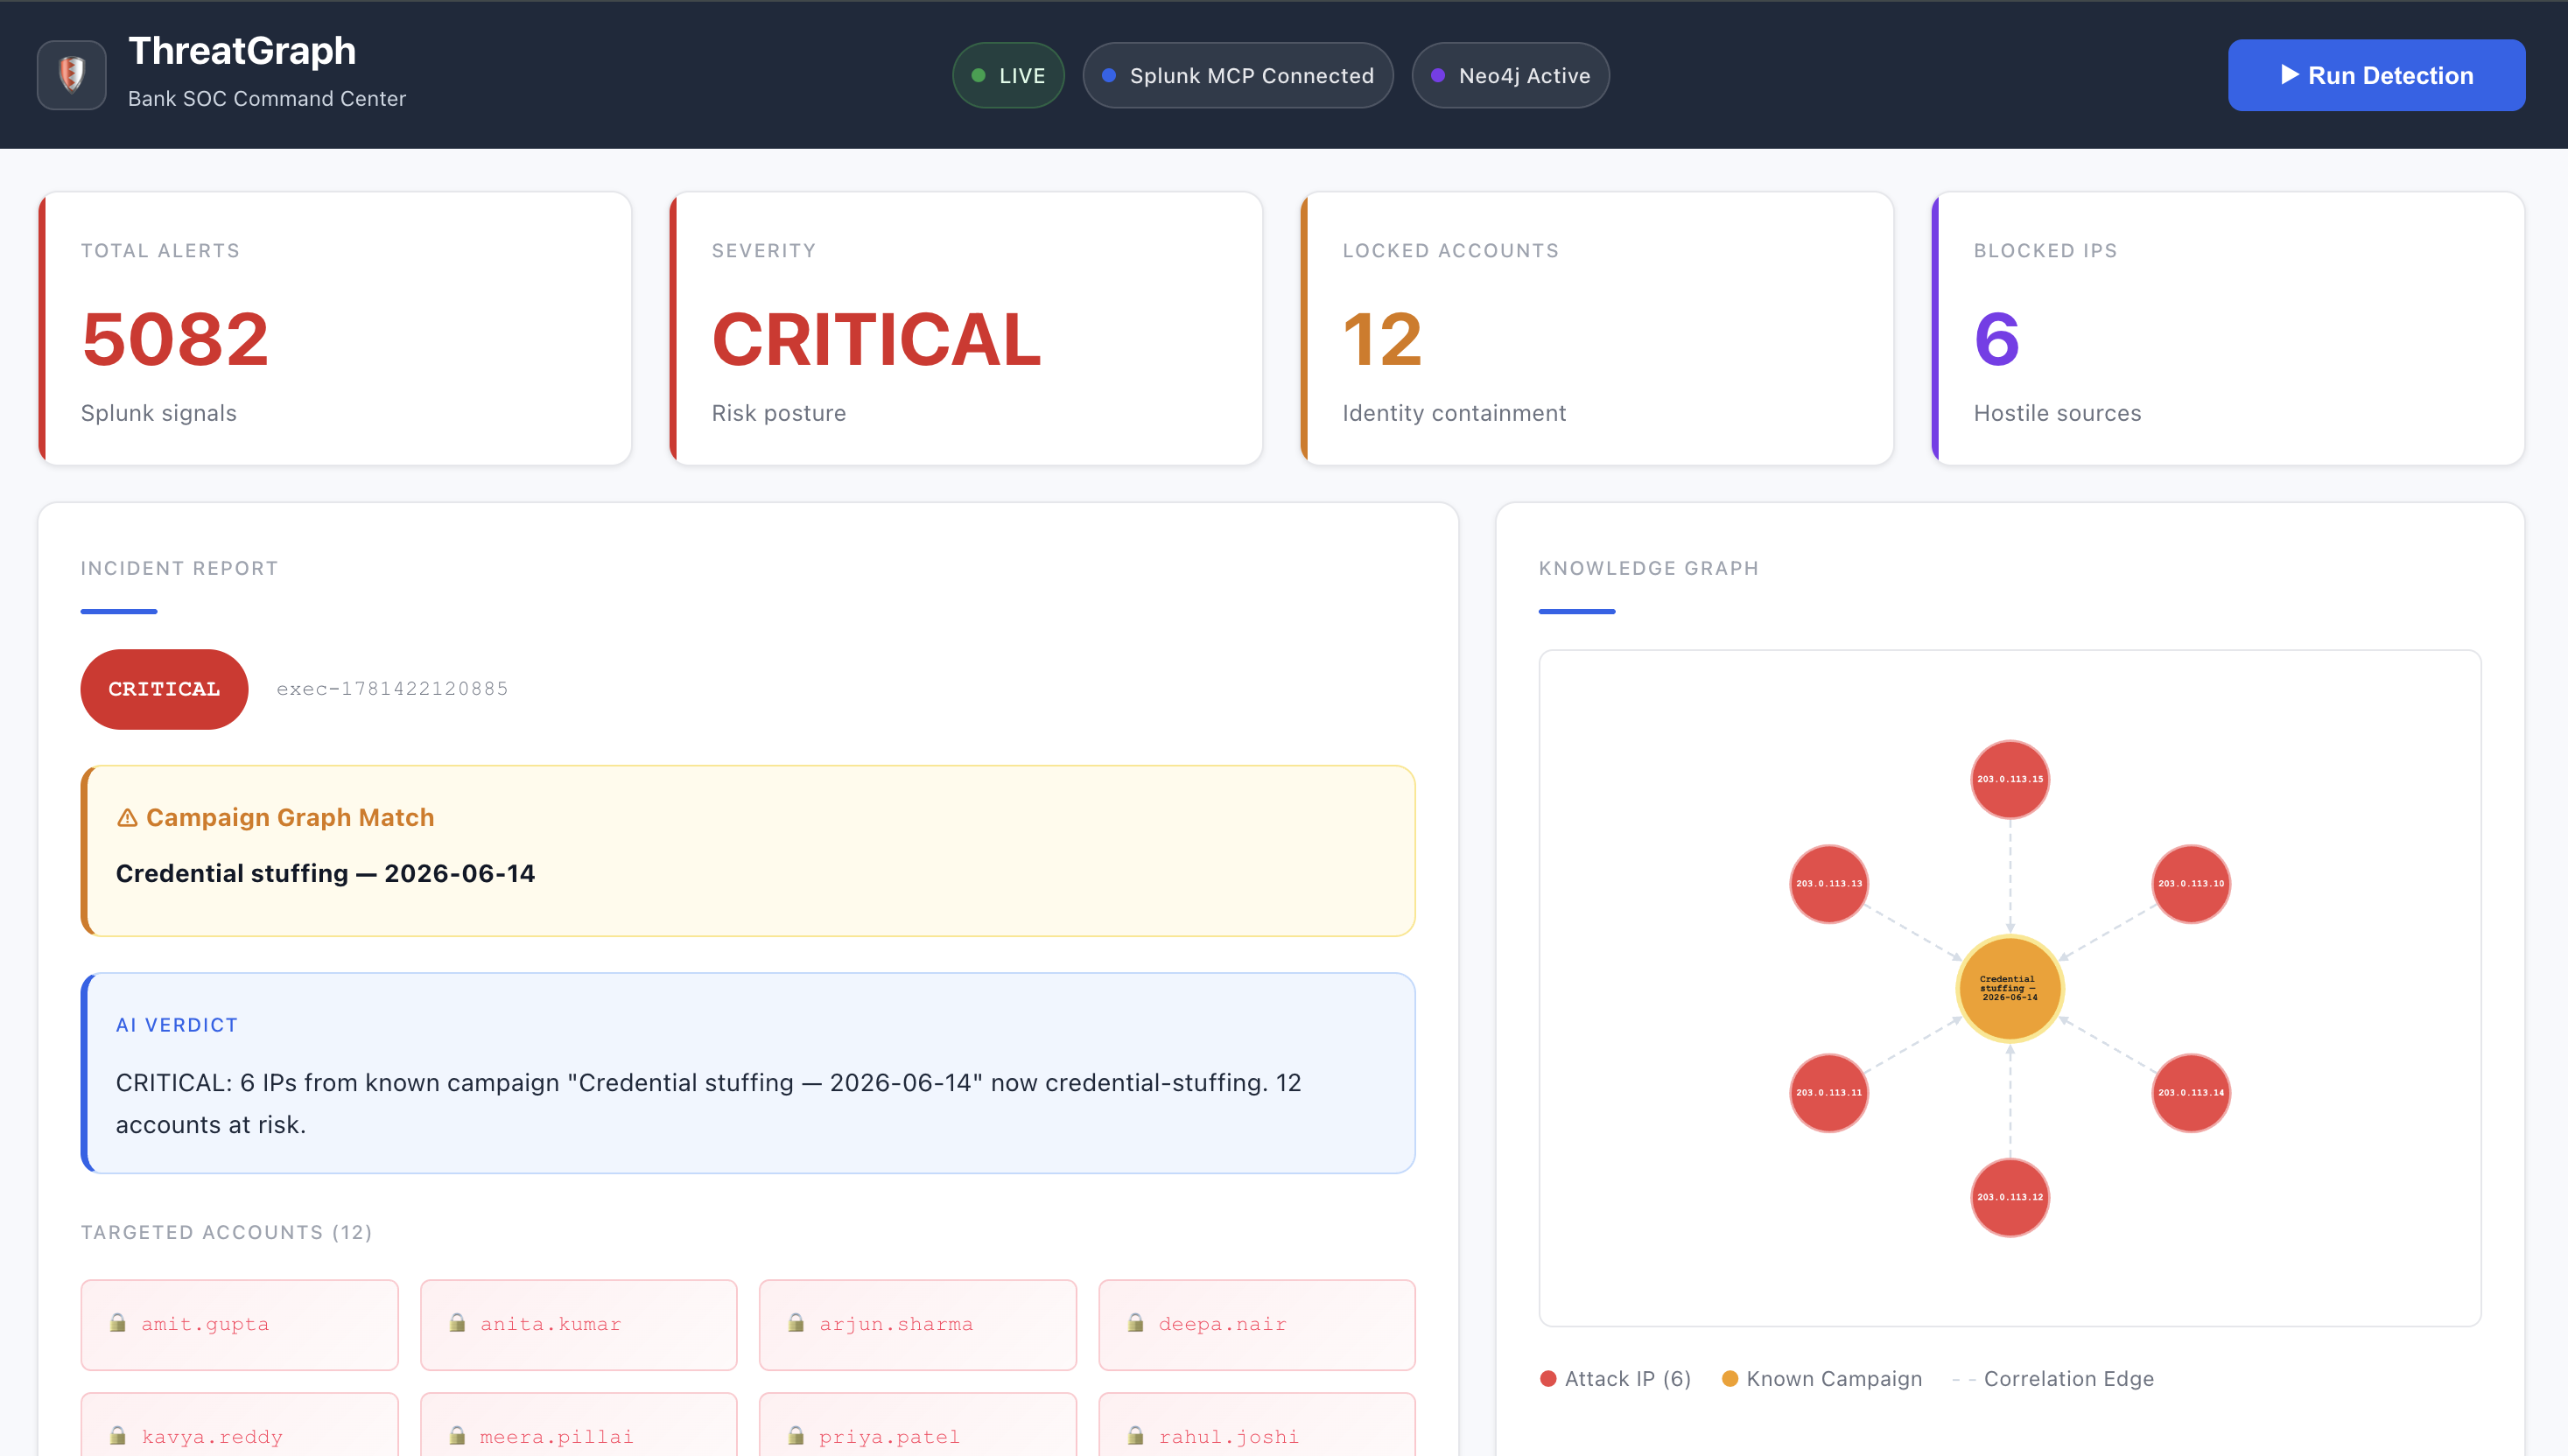
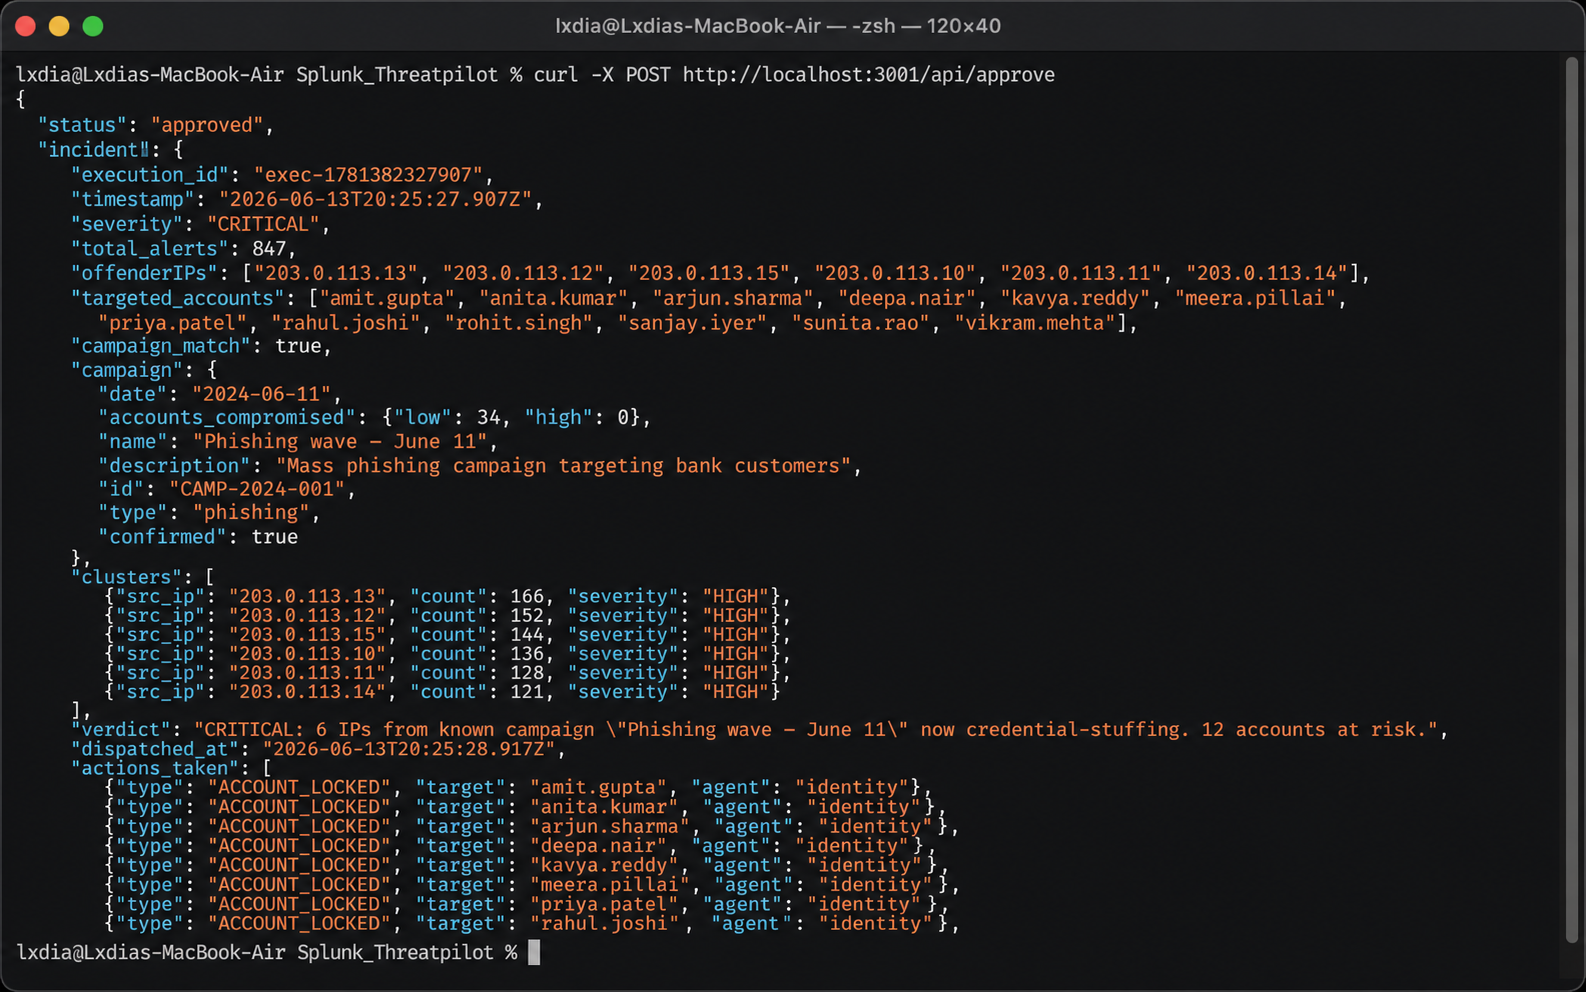
ThreatGraph is an autonomous, agentic SOC system built natively on Splunk that detects, investigates, and remediates coordinated attacks — before a human analyst even reads the first alert.
Here's what happens when an attack fires:
| Step | What ThreatGraph does | Time |
|---|---|---|
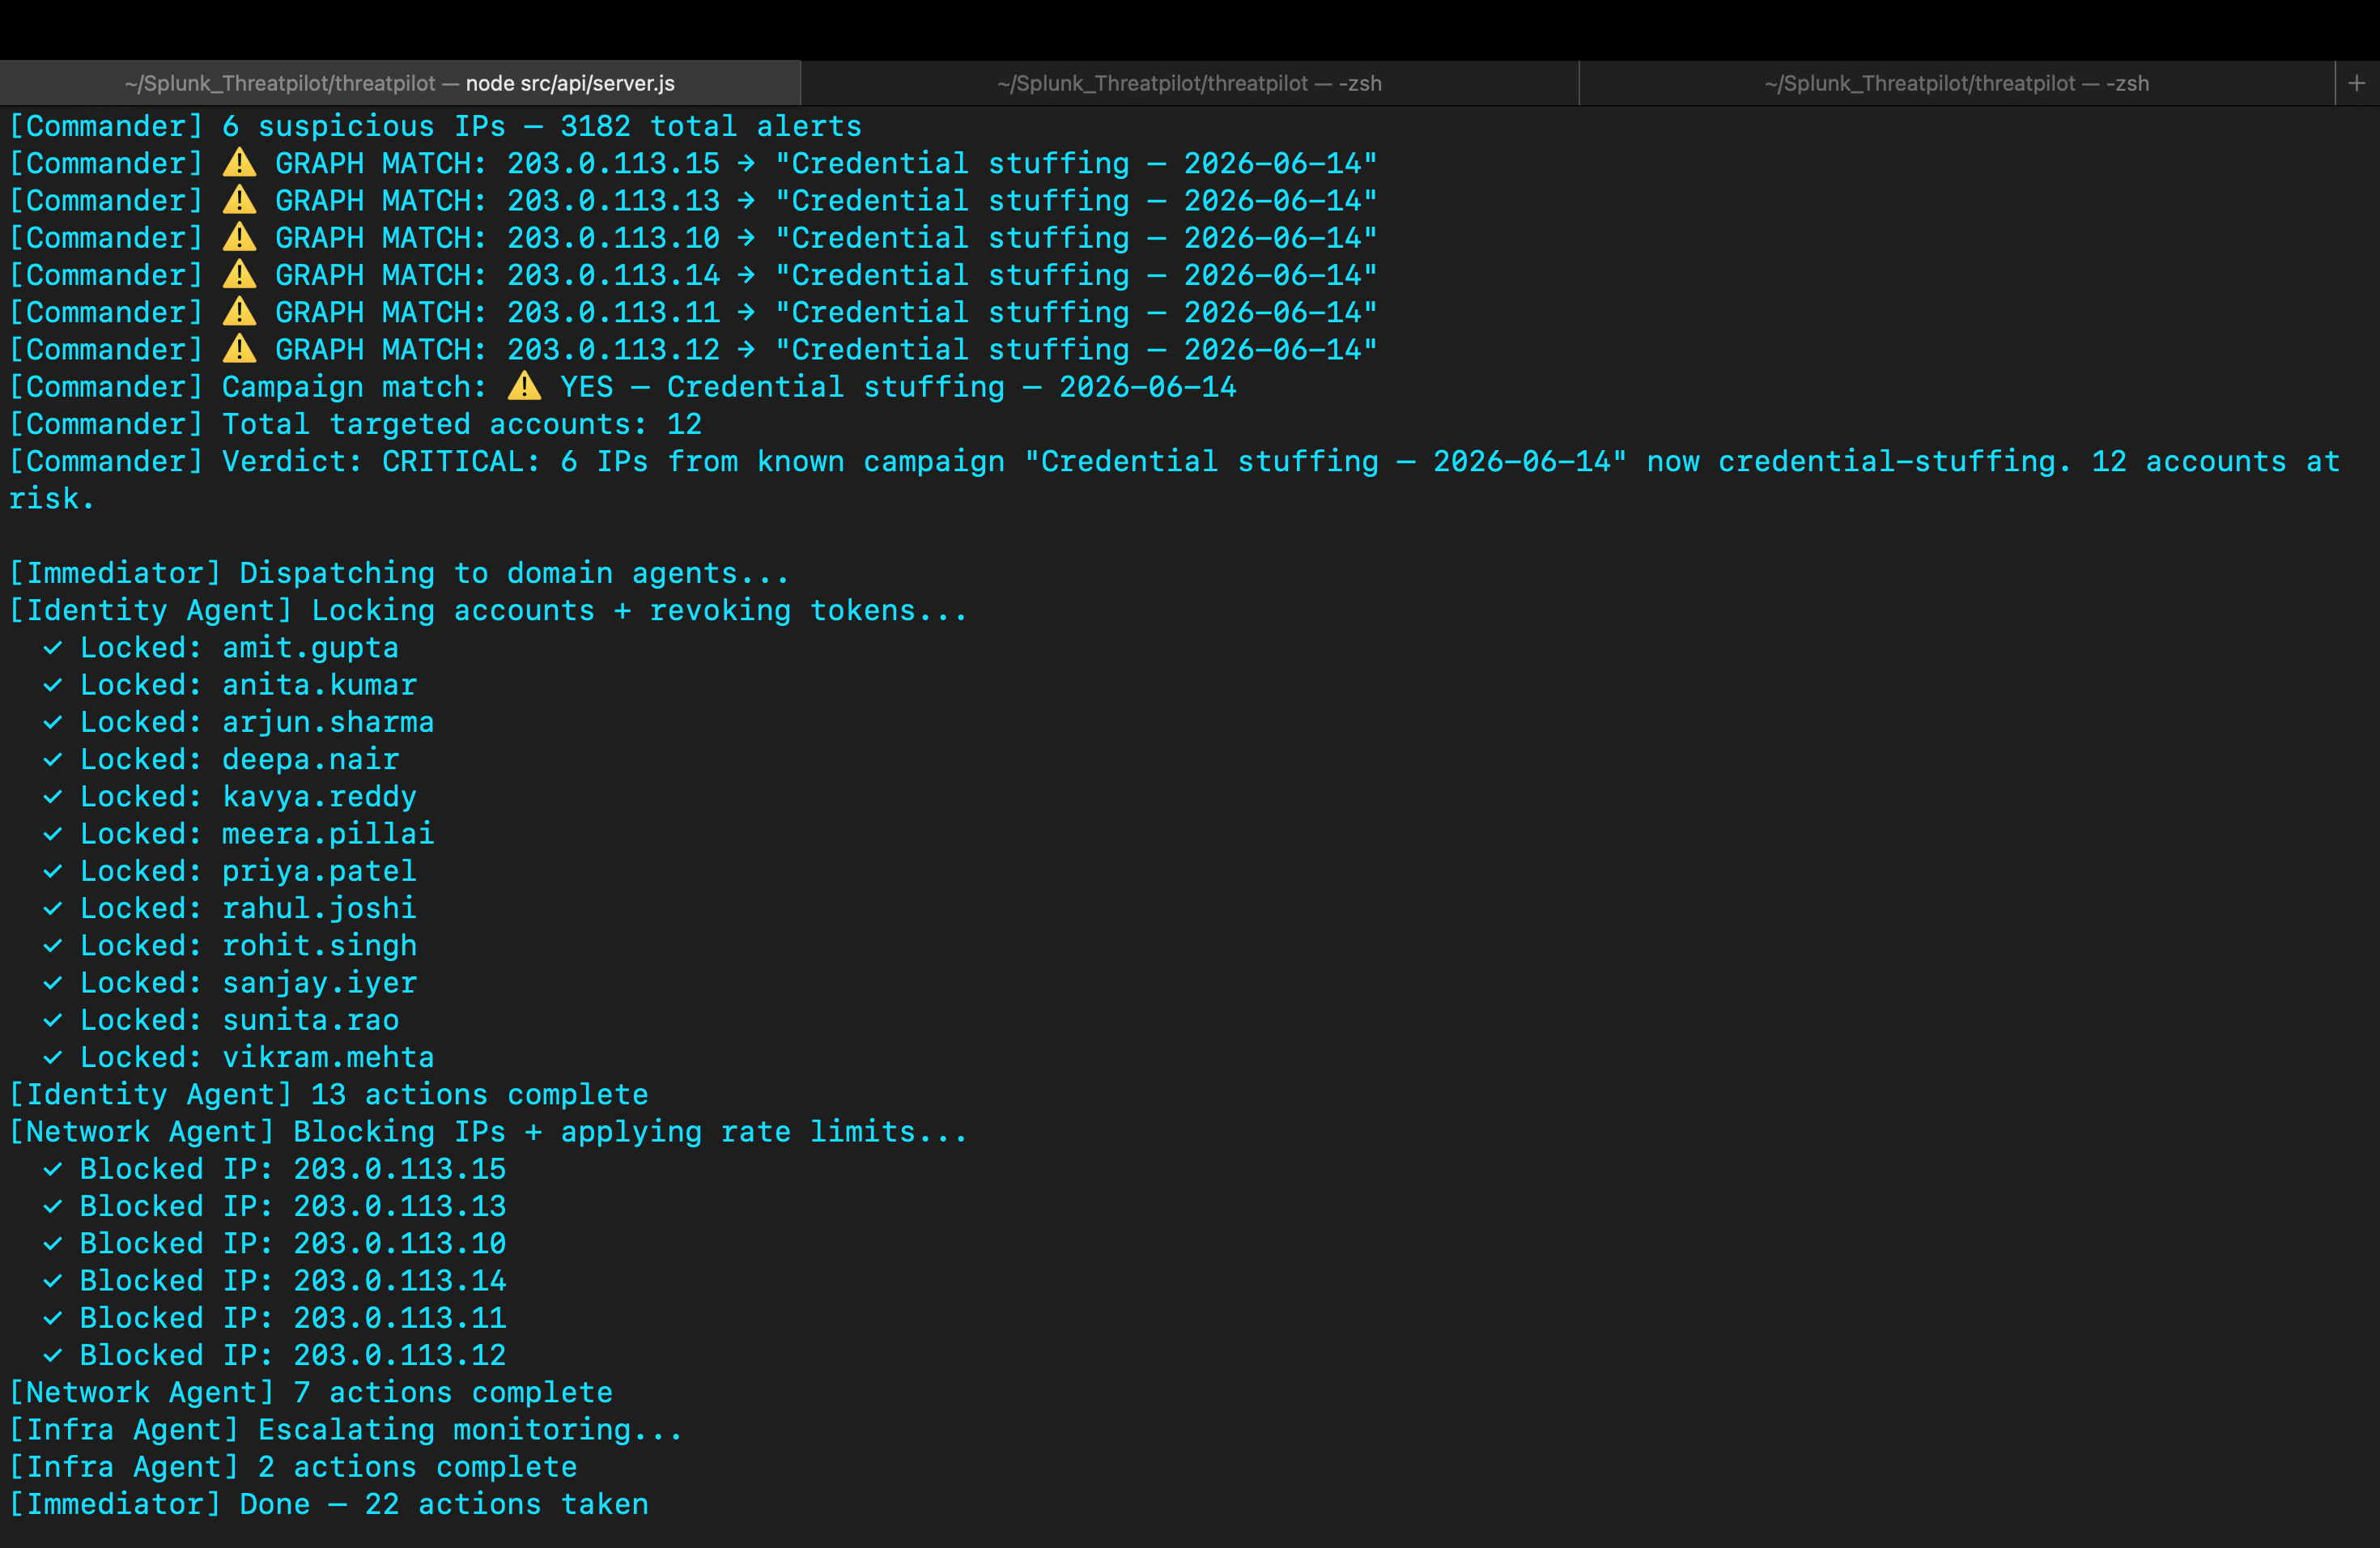
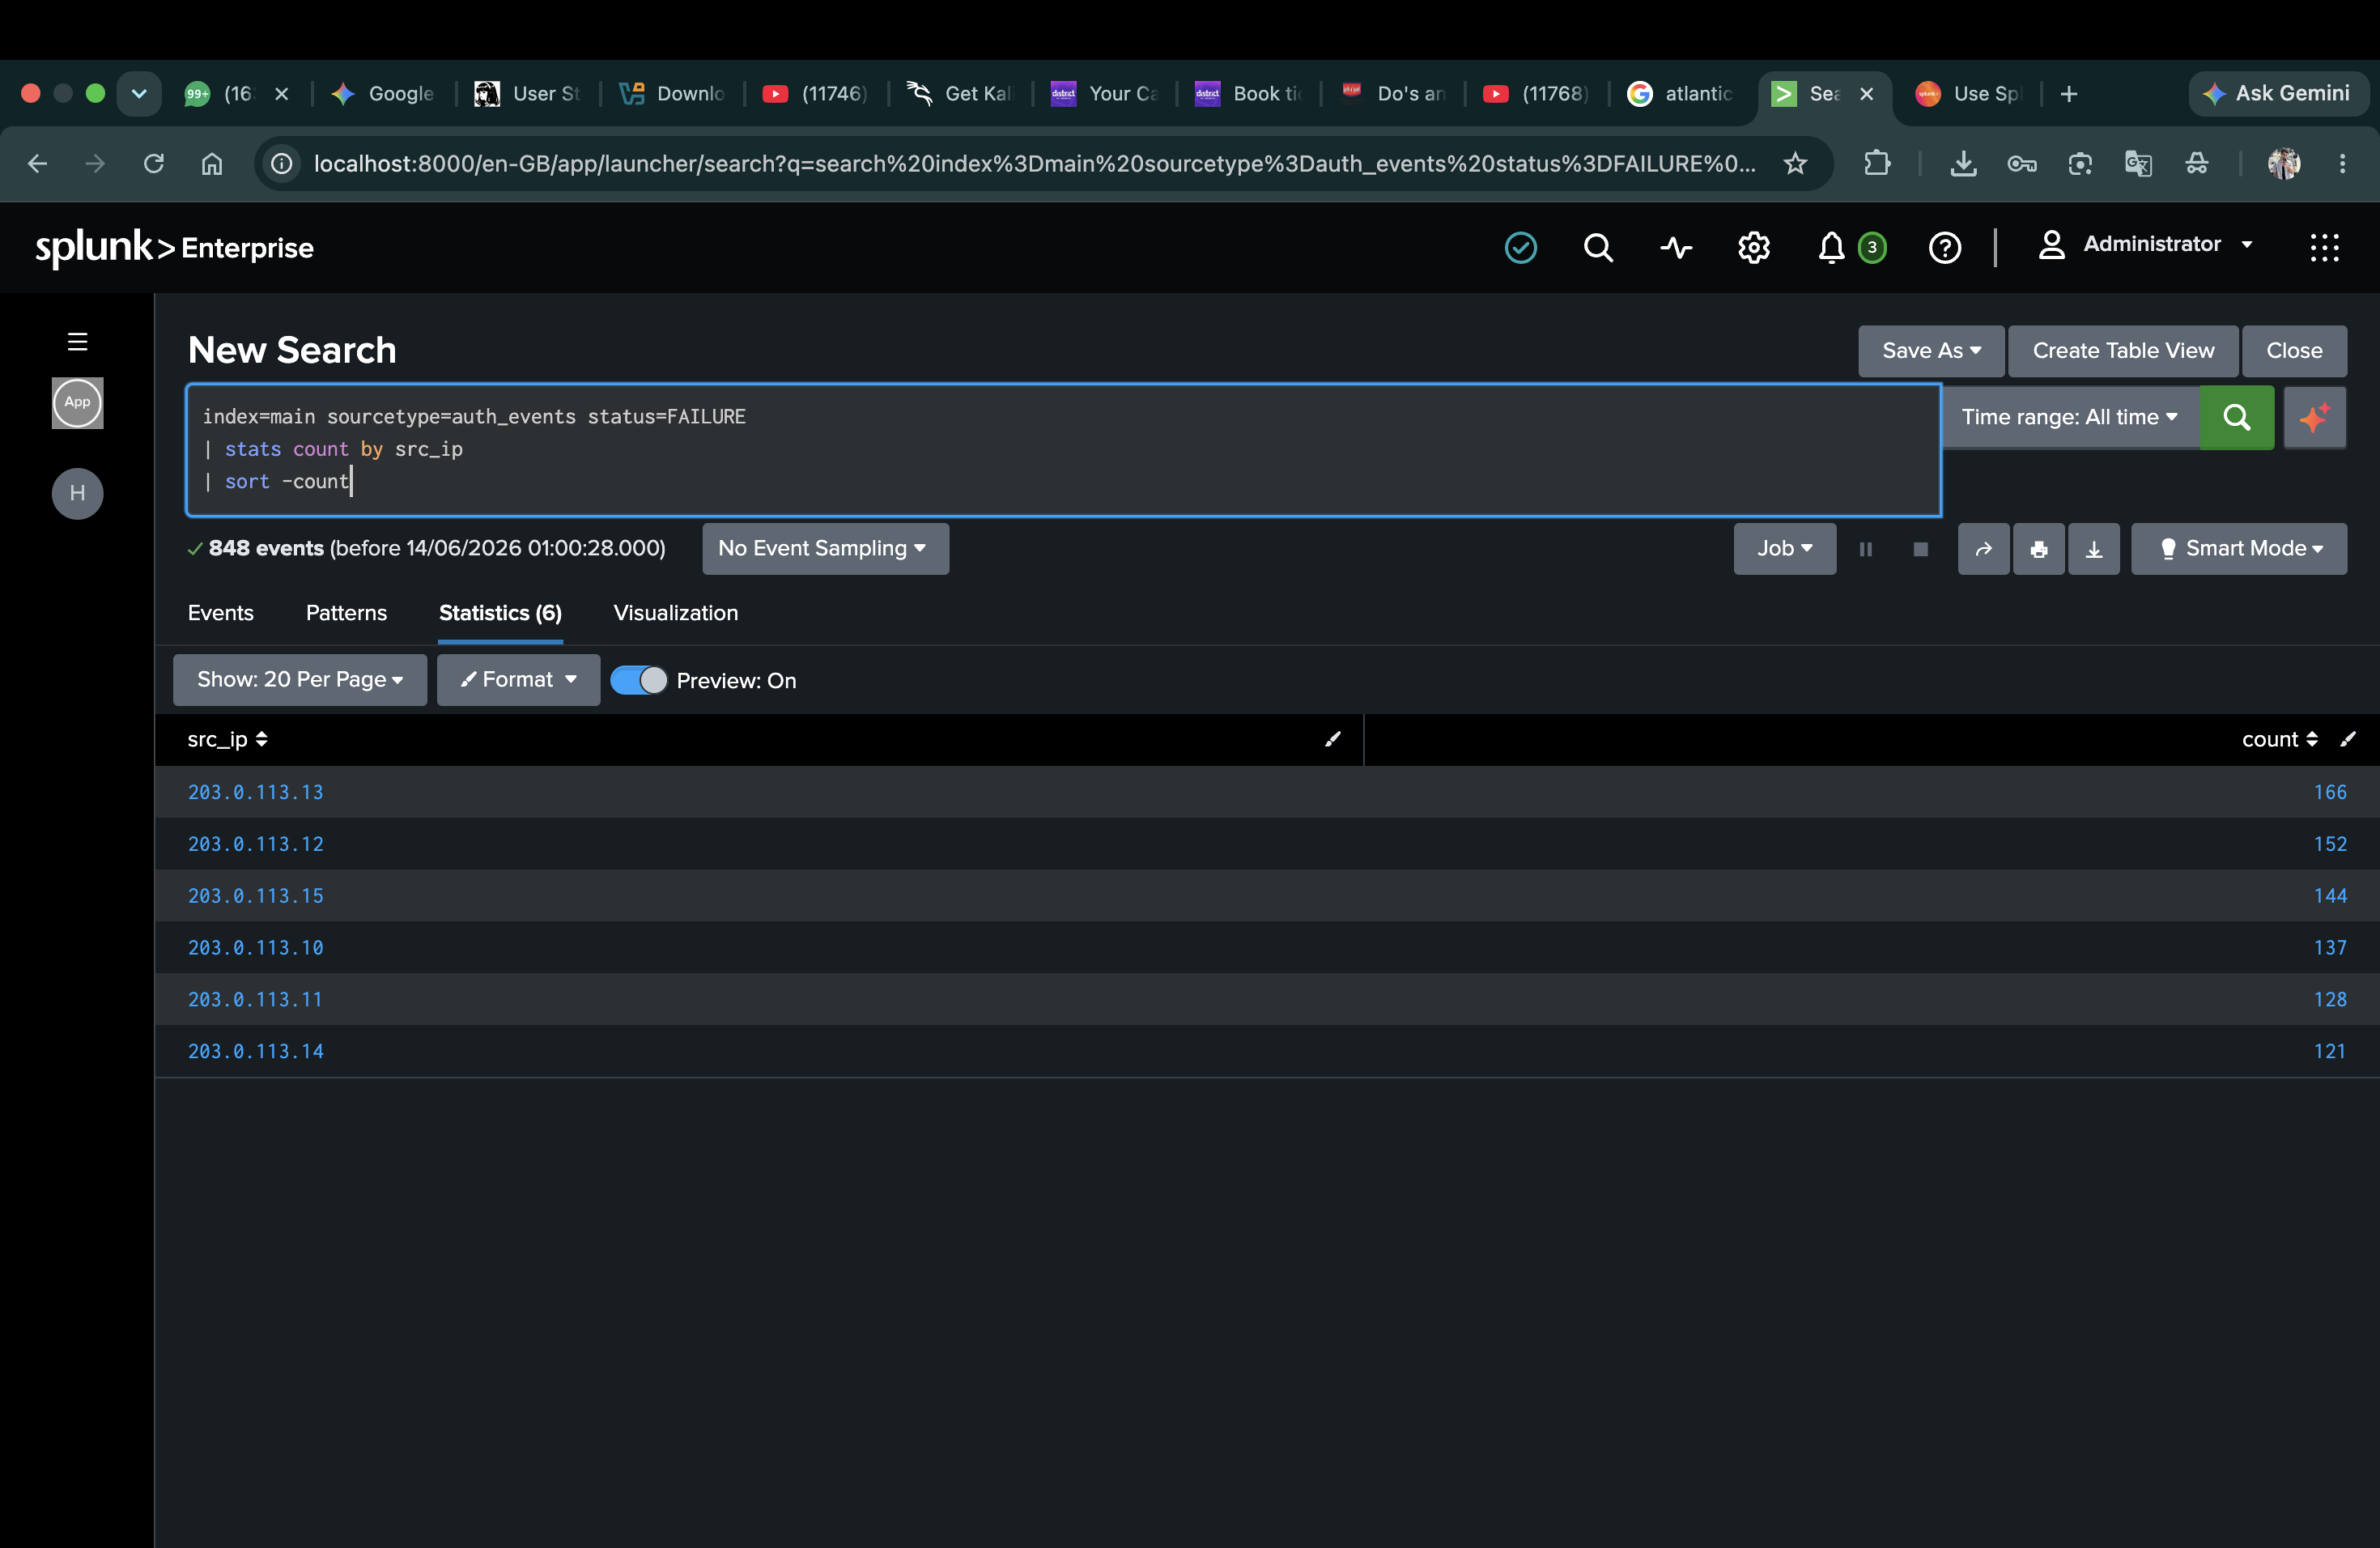
| 🔍 Detect | Commander Agent queries Splunk via MCP Server, finds 6 IPs with 847 failed logins | T+3s |
| 🕸️ Remember | Campaign Graph checks Neo4j — same IPs from phishing campaign 3 days ago | T+5s |
| ⚠️ Escalate | Severity jumps from HIGH → CRITICAL instantly | T+6s |
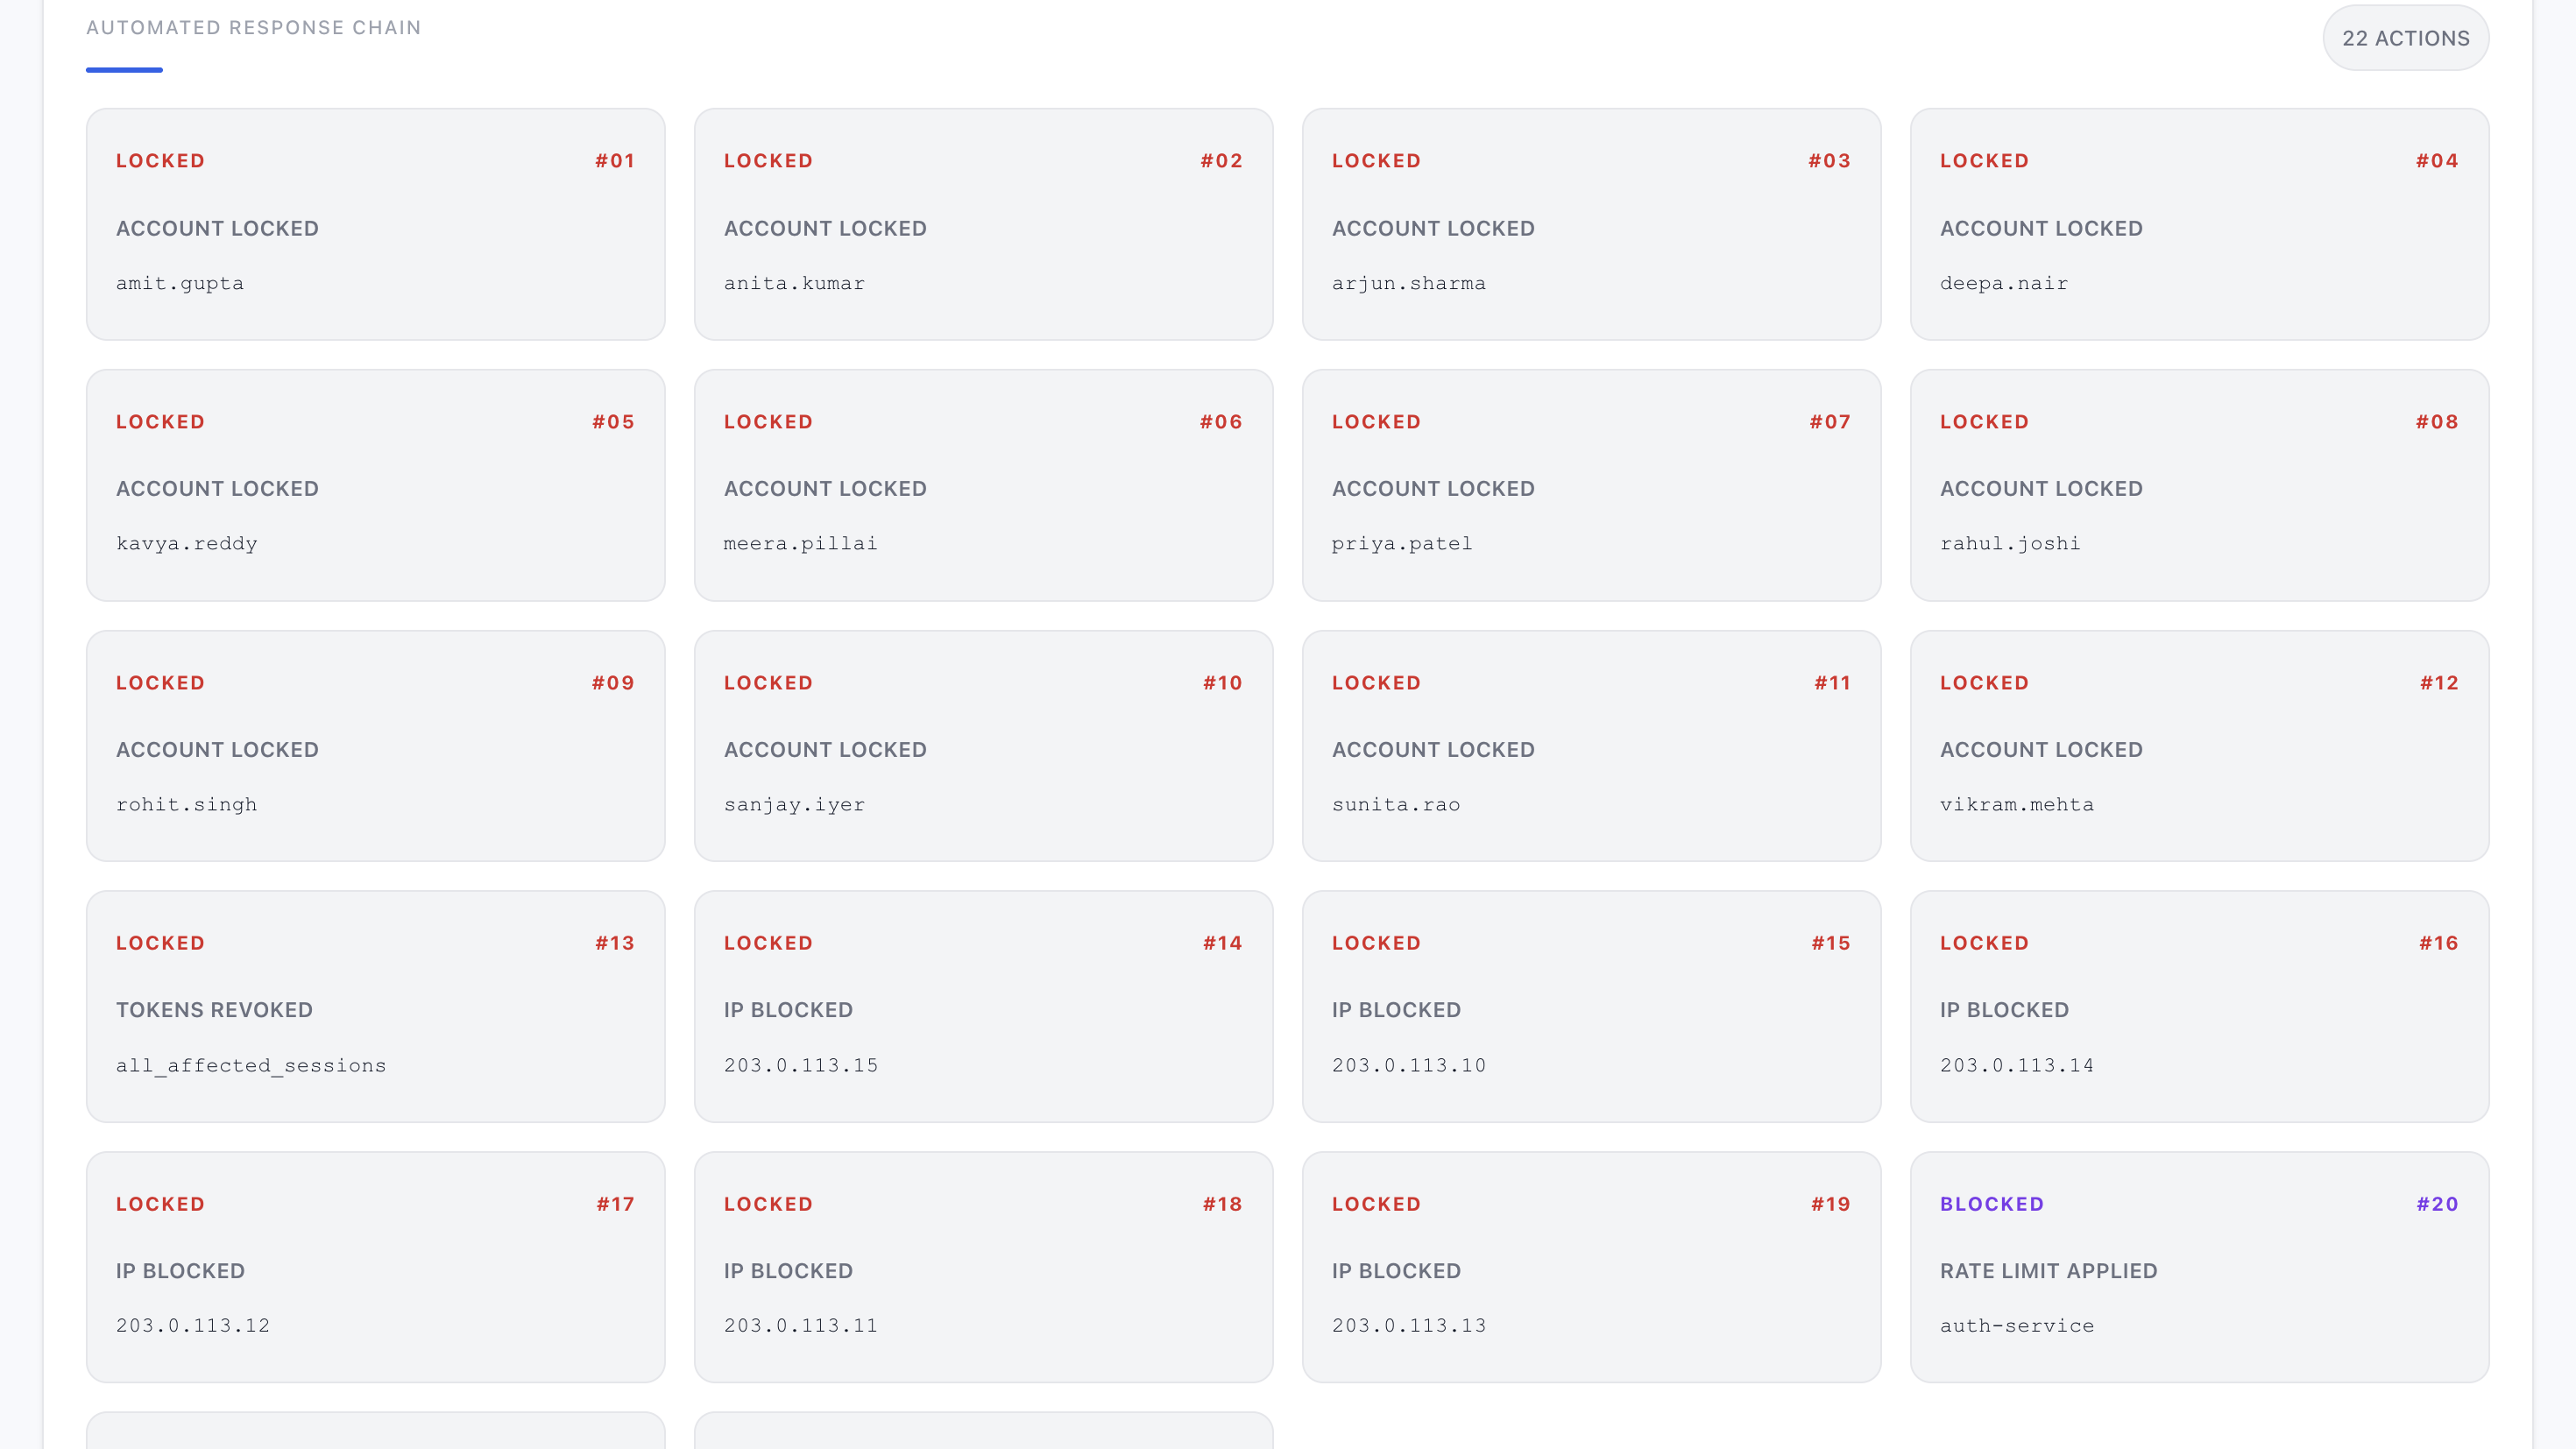
| 🤖 Respond | 3 domain agents fire in parallel — 22 automated actions | T+90s |
| ✅ Approve | SOC analyst gets 1 clean report instead of 847 alerts, approves in 30s | T+120s |
| 💬 Query | Analyst asks Splunk AI Assistant in natural language — gets live Splunk answers | Anytime |
The numbers that matter:
847 alertscompressed into1 incident report4+ hoursof manual triage reduced to2 minutes12 accountslocked before any breach6 IPsblocked via WAF rules0 breaches— attack stopped at the perimeter
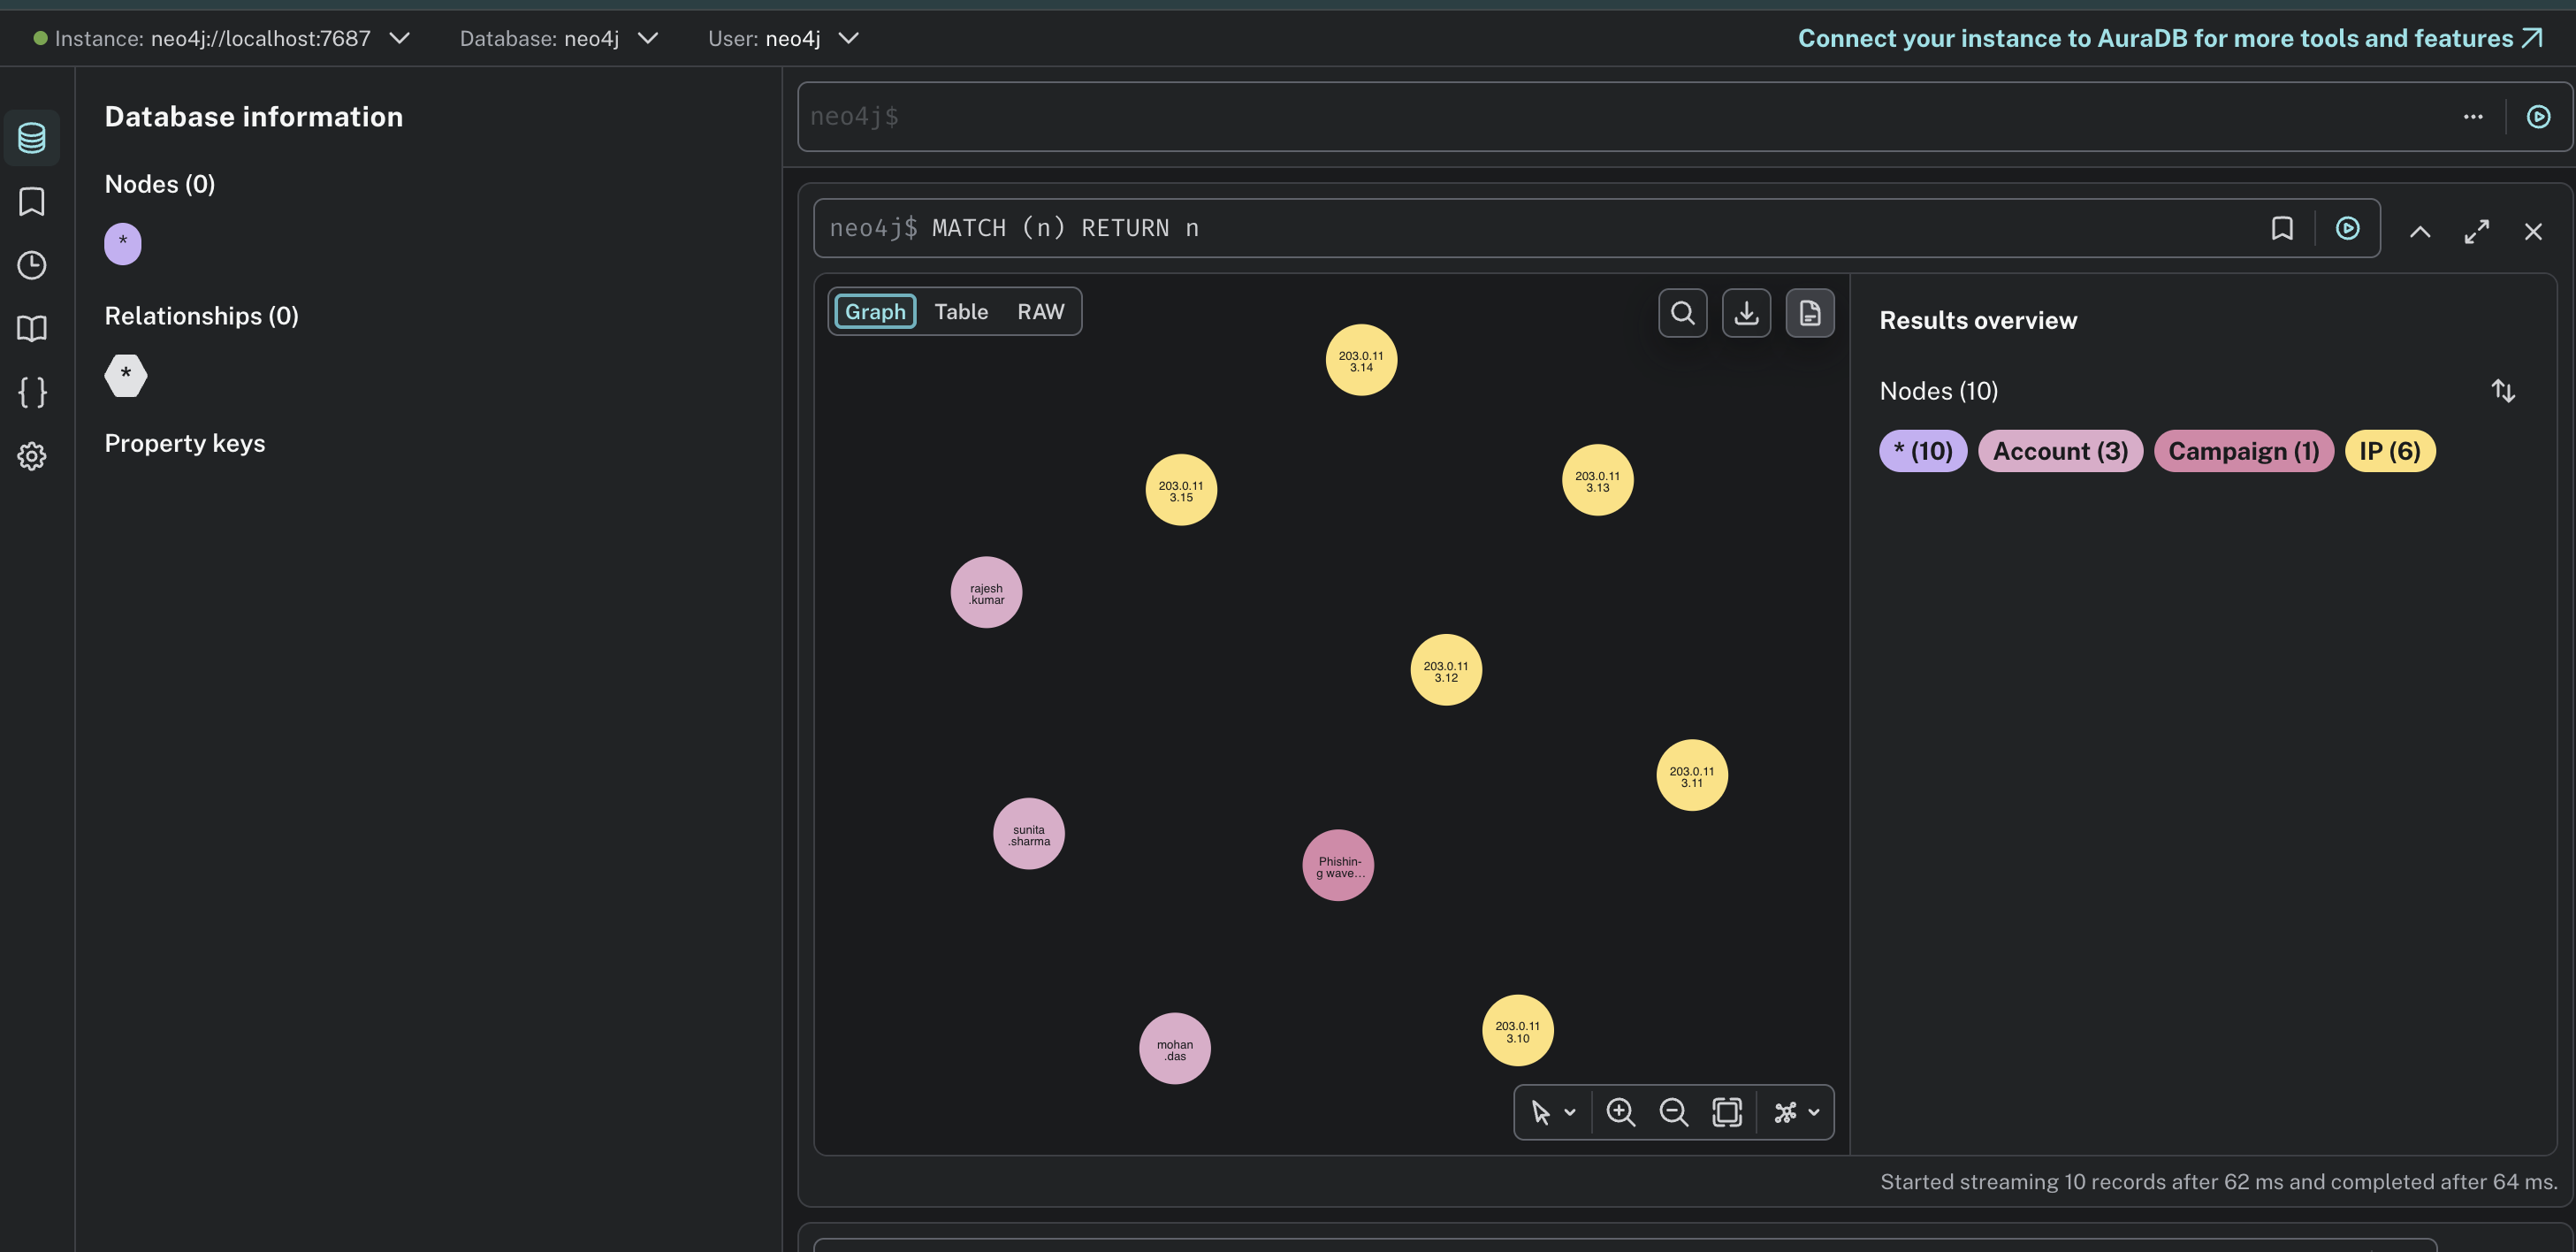
The secret weapon is the Campaign Knowledge Graph — a Neo4j graph that grows smarter with every incident. Every confirmed attack adds attacker nodes. So when the same threat actor strikes again, ThreatGraph recognises them in milliseconds — not hours.
🛠️ How we built it
We built ThreatGraph in layers, each one feeding the next:
Layer 1 — Data Pipeline (Splunk)
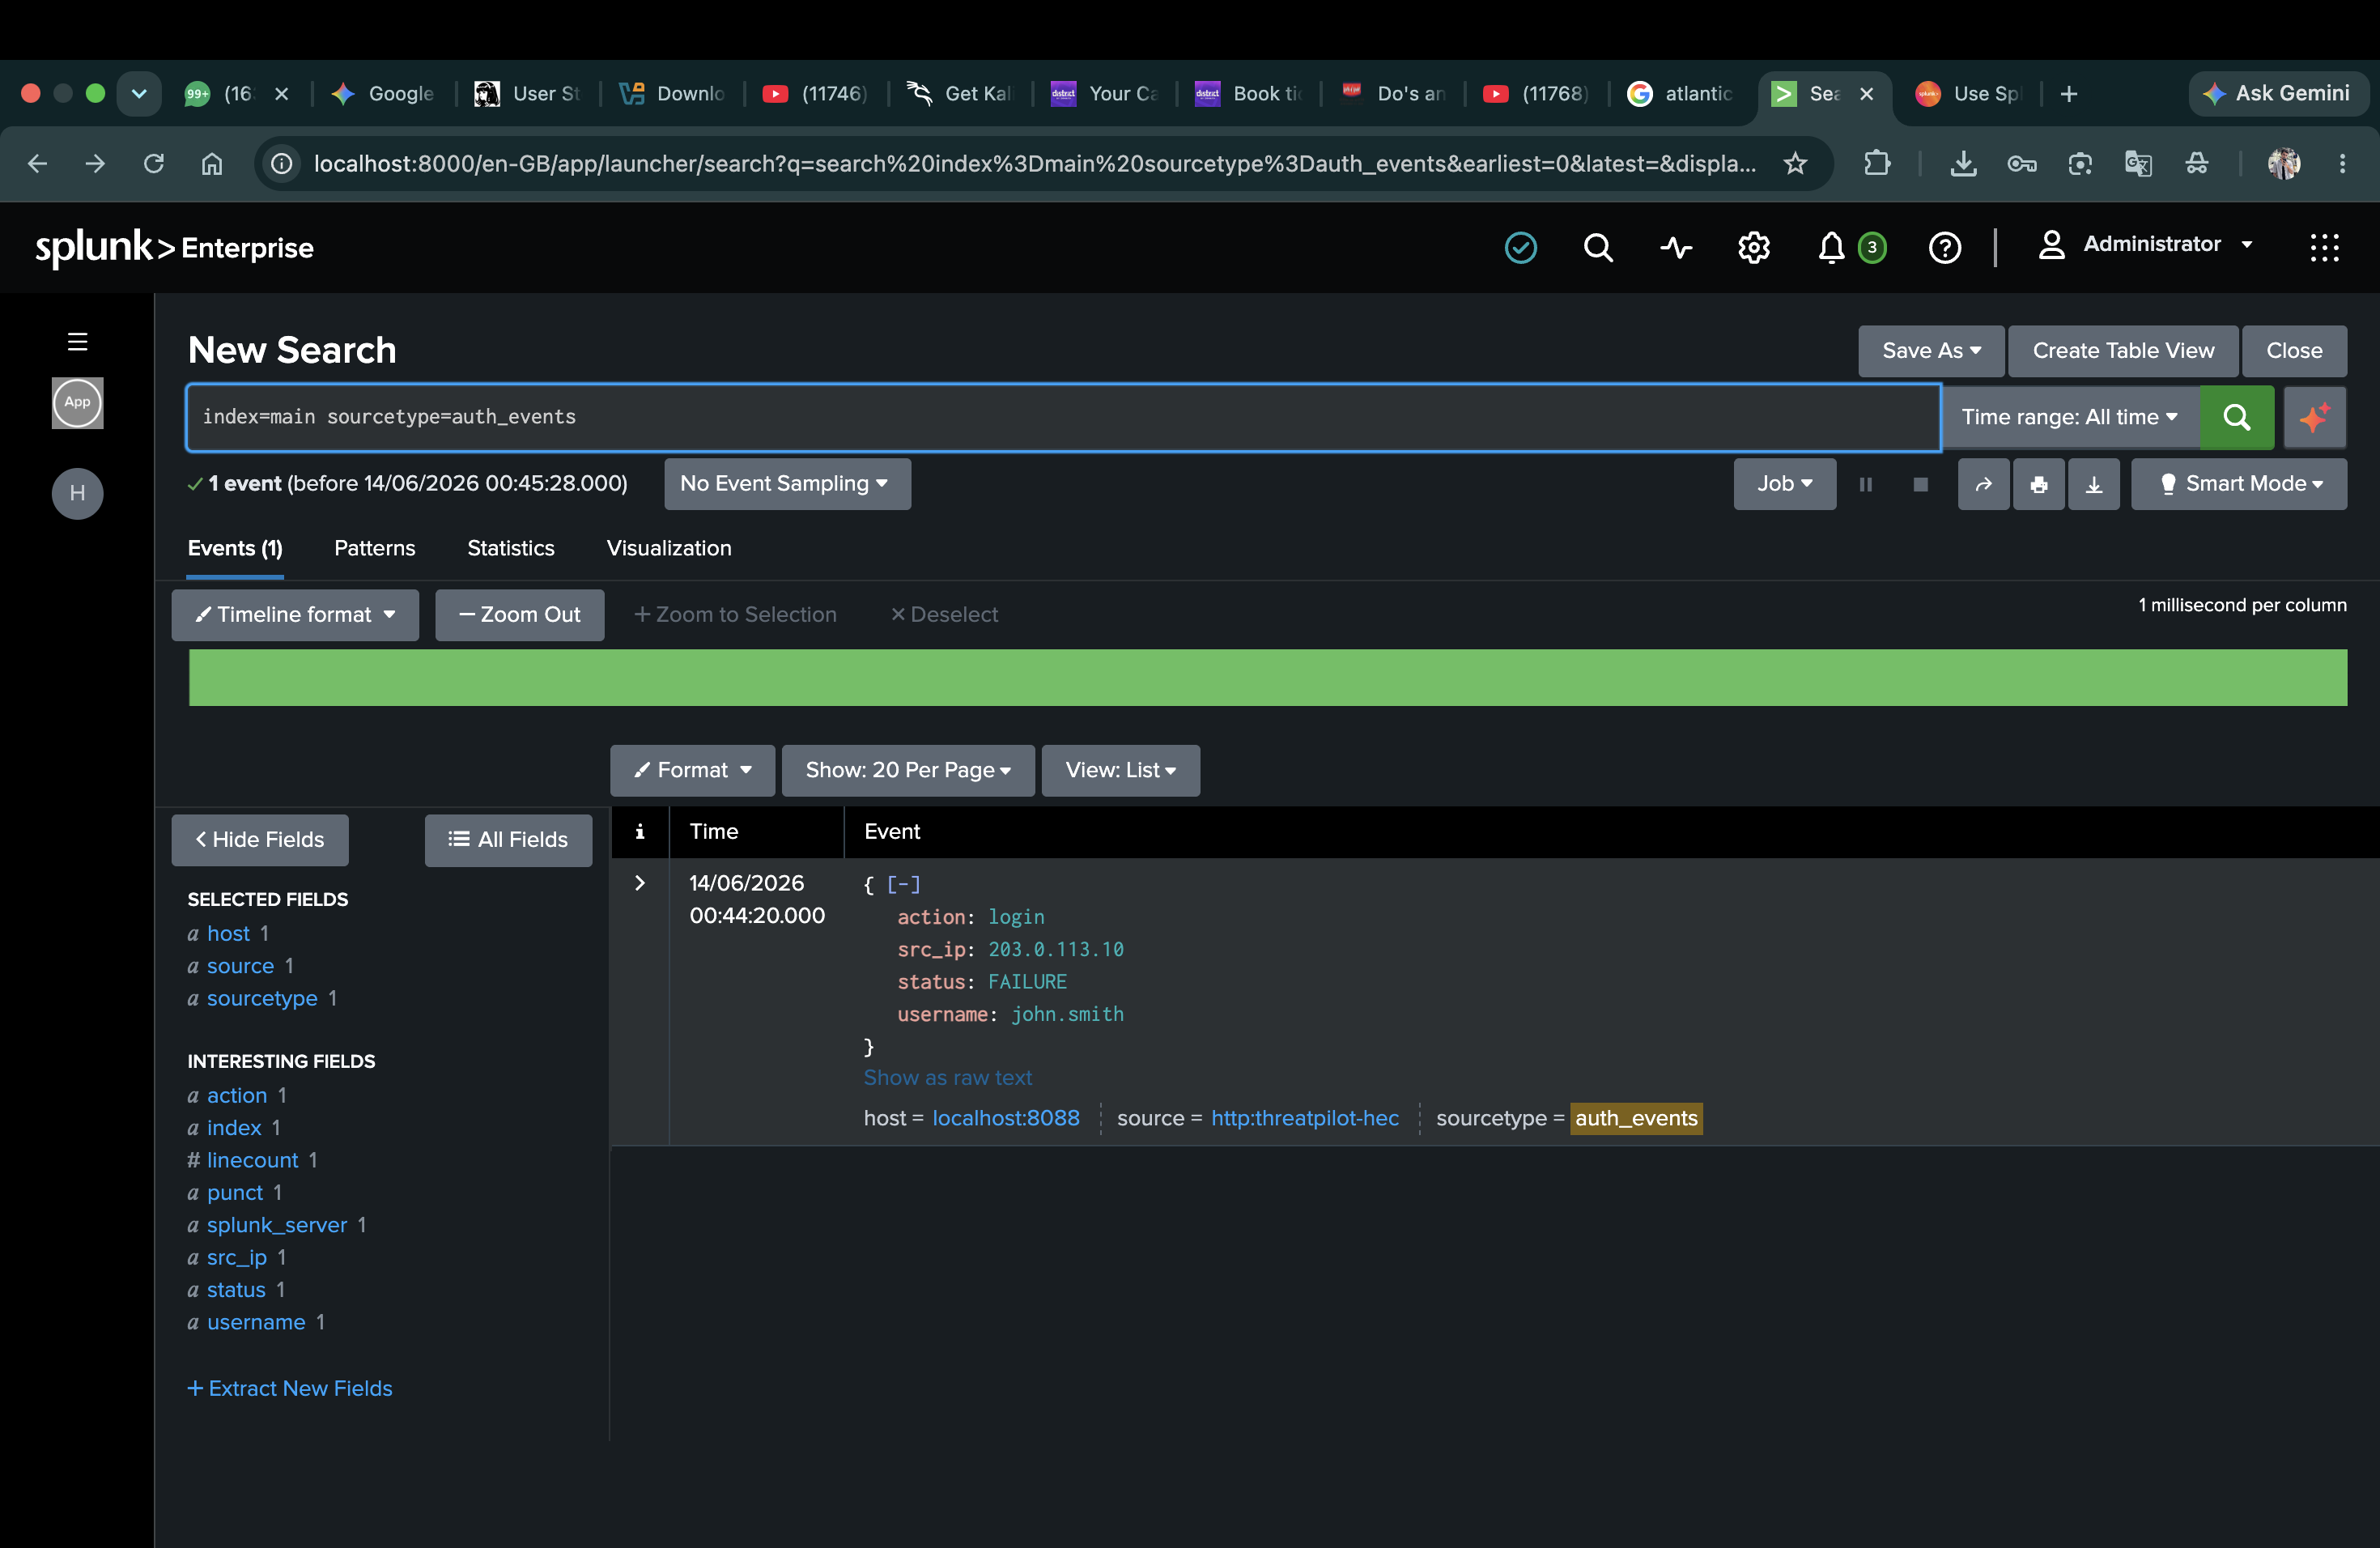
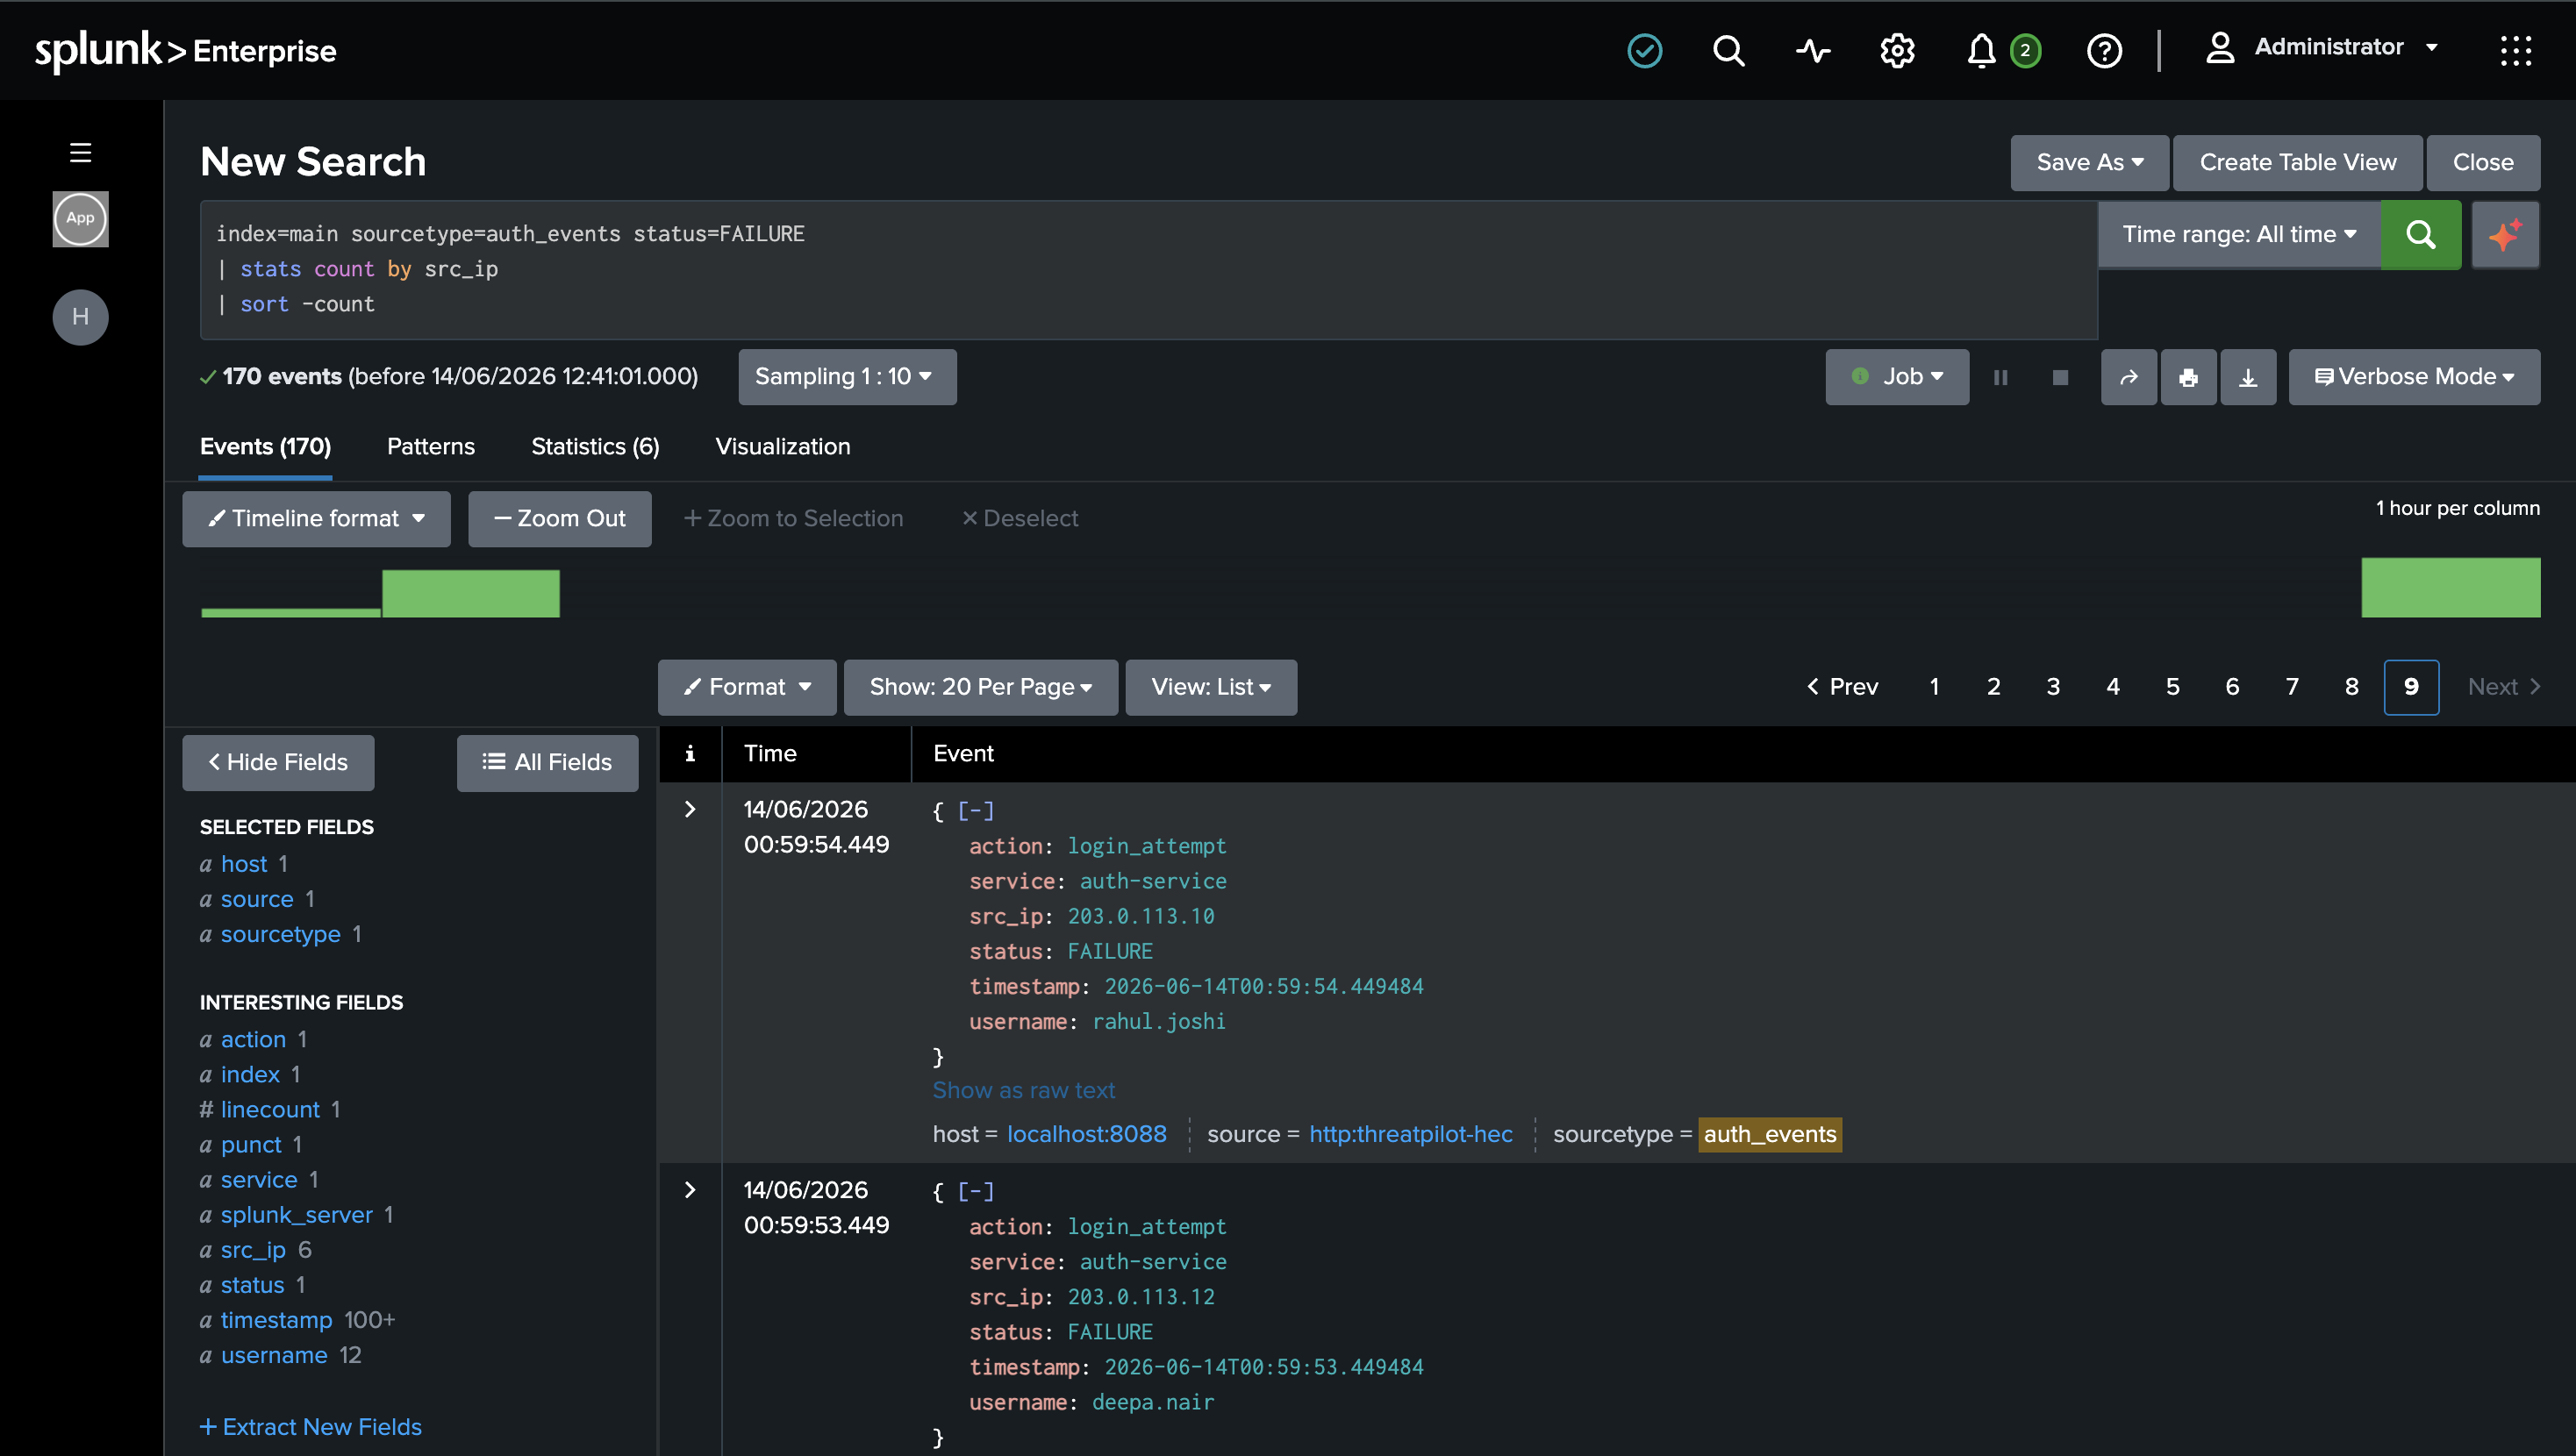
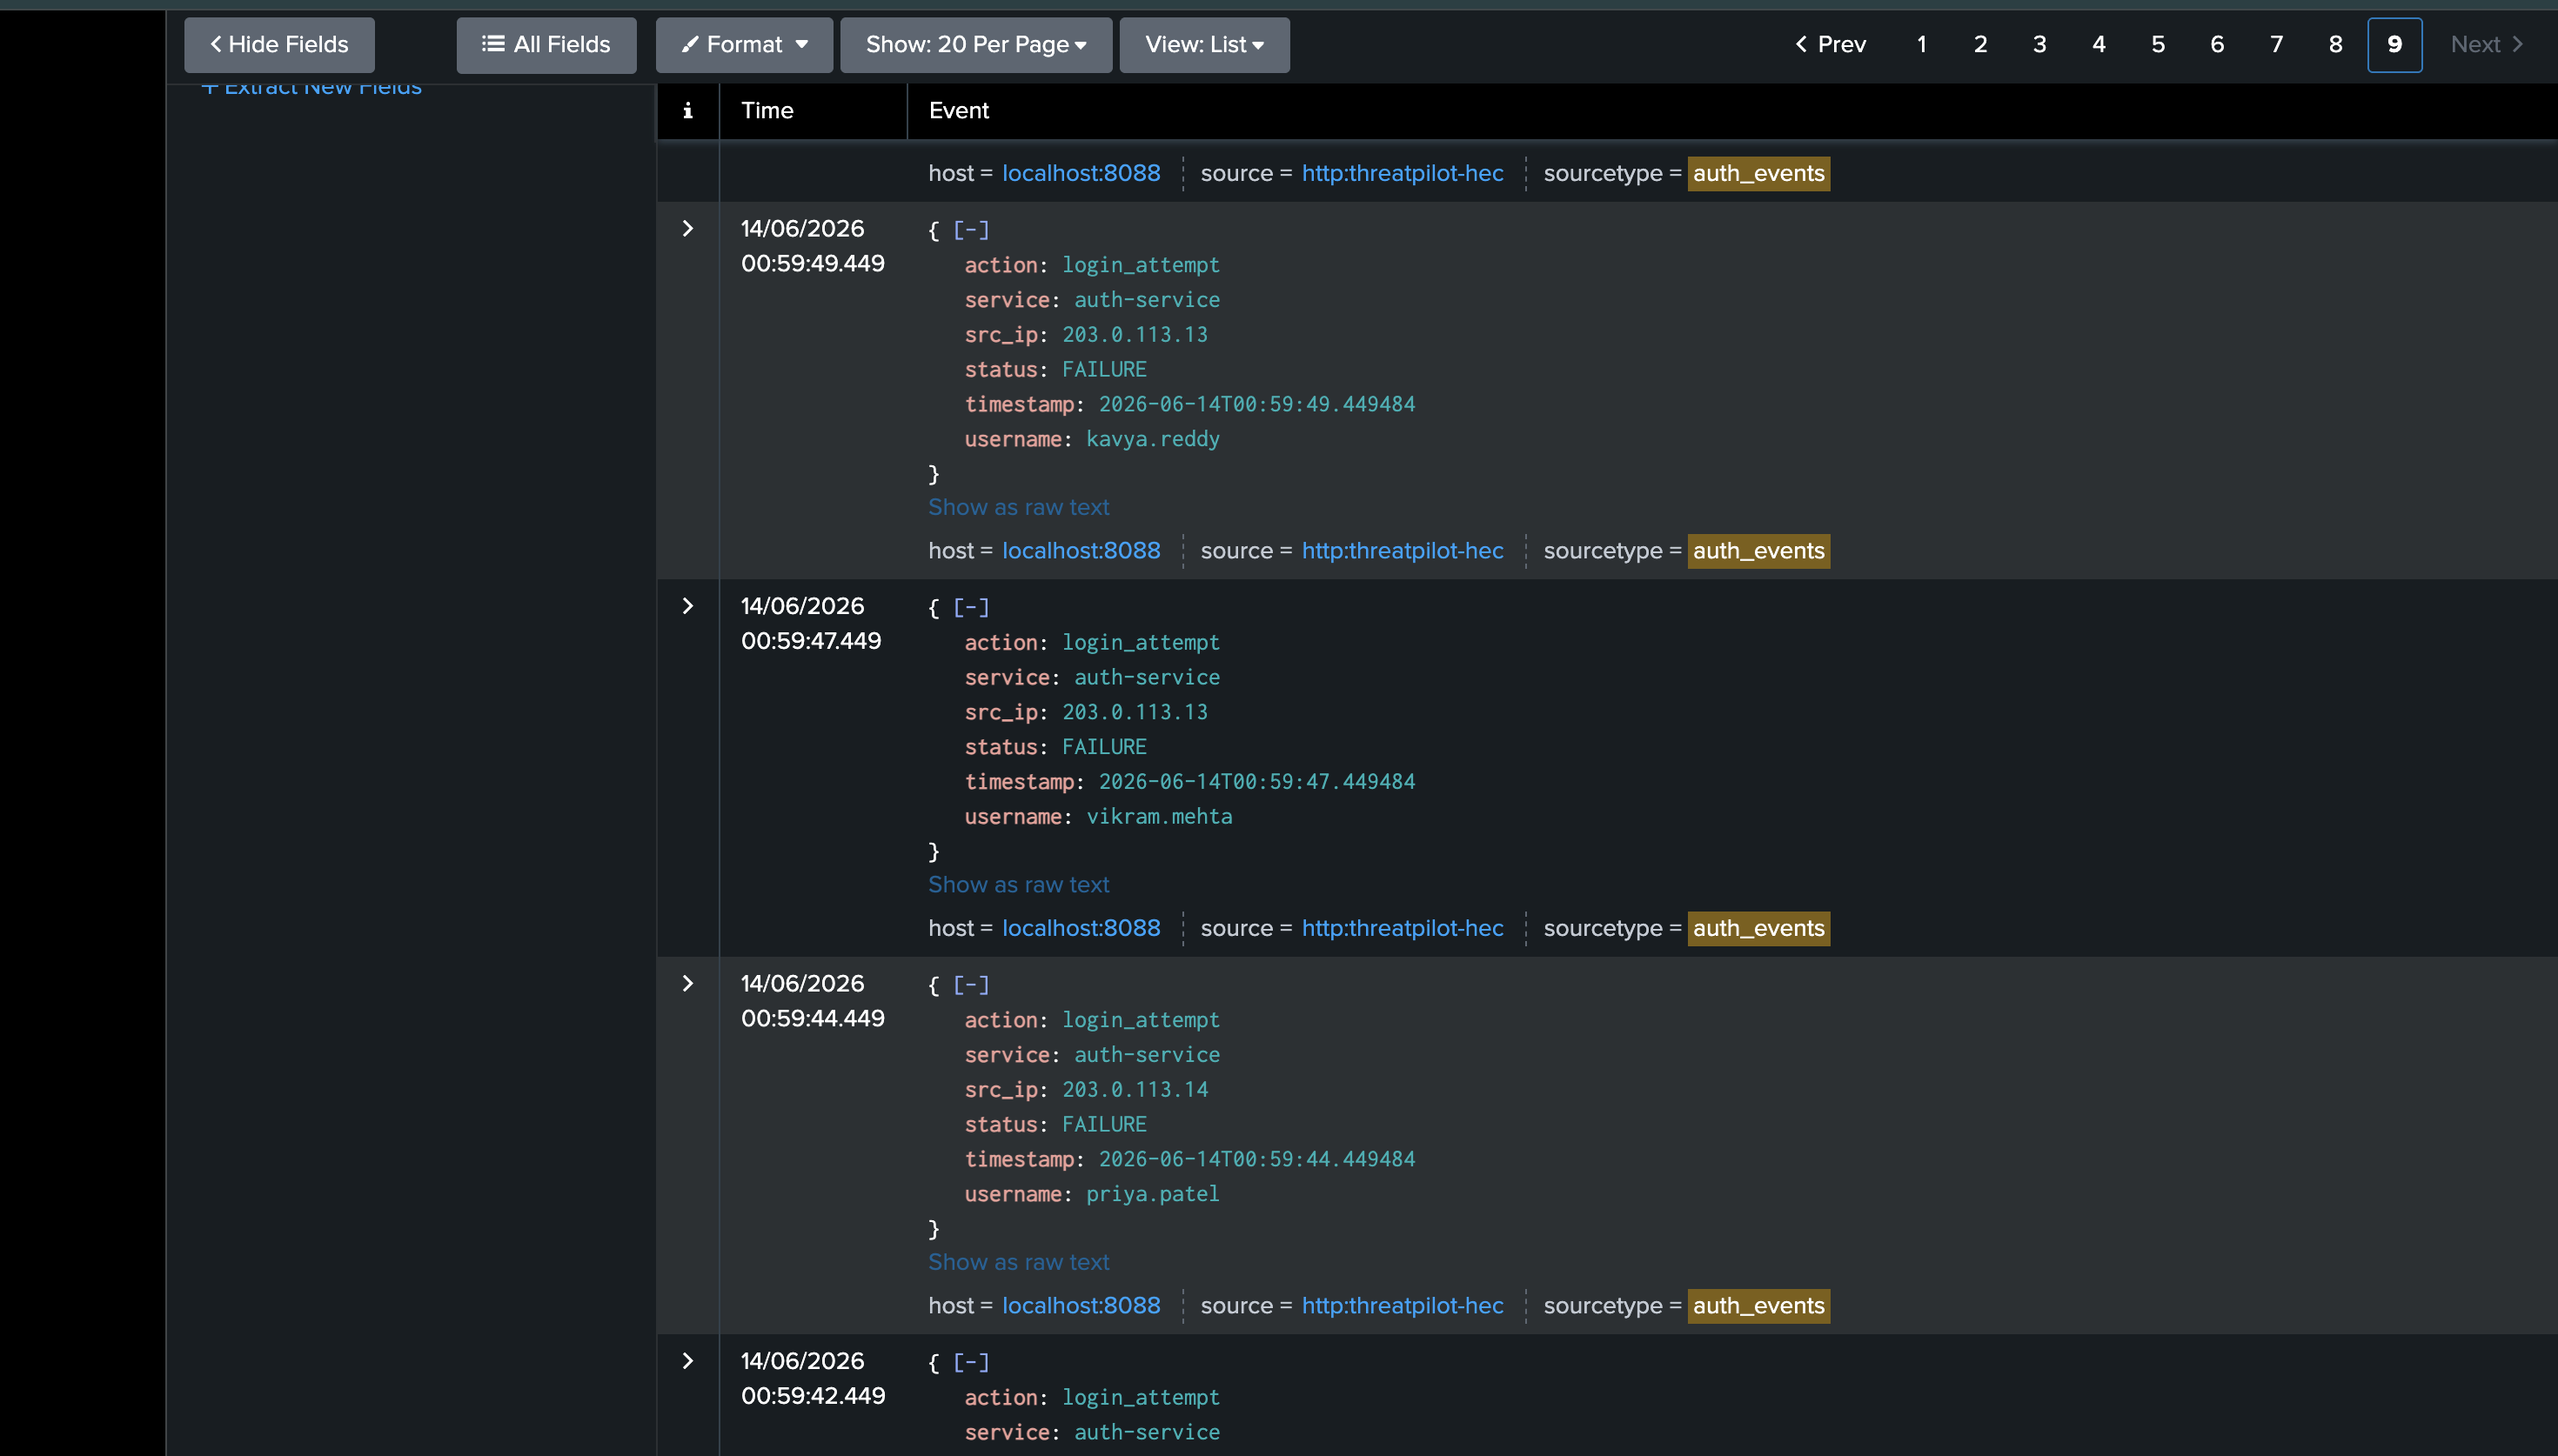
We set up Splunk Enterprise with HEC (HTTP Event Collector) to ingest real-time auth logs. All 847 attack events flow into Splunk on port 8088, indexed under sourcetype=auth_events.
Layer 2 — Intelligence (Official Splunk MCP Server + Neo4j) We installed the official Splunk MCP Server app (Splunkbase app #7931) on Splunk Enterprise. Our Commander Agent connects via the MCP protocol with encrypted token authentication, querying Splunk using SPL through the MCP interface. Simultaneously, it checks every suspicious IP against our Neo4j Campaign Knowledge Graph using Cypher queries. If a match is found — the whole investigation changes.
search index=main sourcetype=auth_events status=FAILURE earliest=-60m
| spath
| stats count, values(username) as targeted_users by src_ip
| where count > 15
| eval severity=if(count>50,"HIGH","MEDIUM")
Layer 3 — AI Reasoning (Splunk Hosted AI) Instead of sending 30,000 tokens of raw logs to the AI, we compress the graph findings into ~300 tokens and send only that. The AI receives structured context, not noise — and returns a precise, plain-English verdict.
Layer 4 — Autonomous Agents (Node.js) Five agents operate in a pipeline:
- Commander Agent — detects and enriches
- Immediator Agent — normalises and dispatches
- Identity Agent — locks accounts, revokes tokens
- Network Agent — blocks IPs, applies WAF rules
- Infra Agent — escalates monitoring
Layer 5 — SOC Dashboard (React + Cytoscape.js) A real-time command center UI showing live alerts, the campaign graph visualisation, all automated actions, and a one-click approval button for the human analyst.
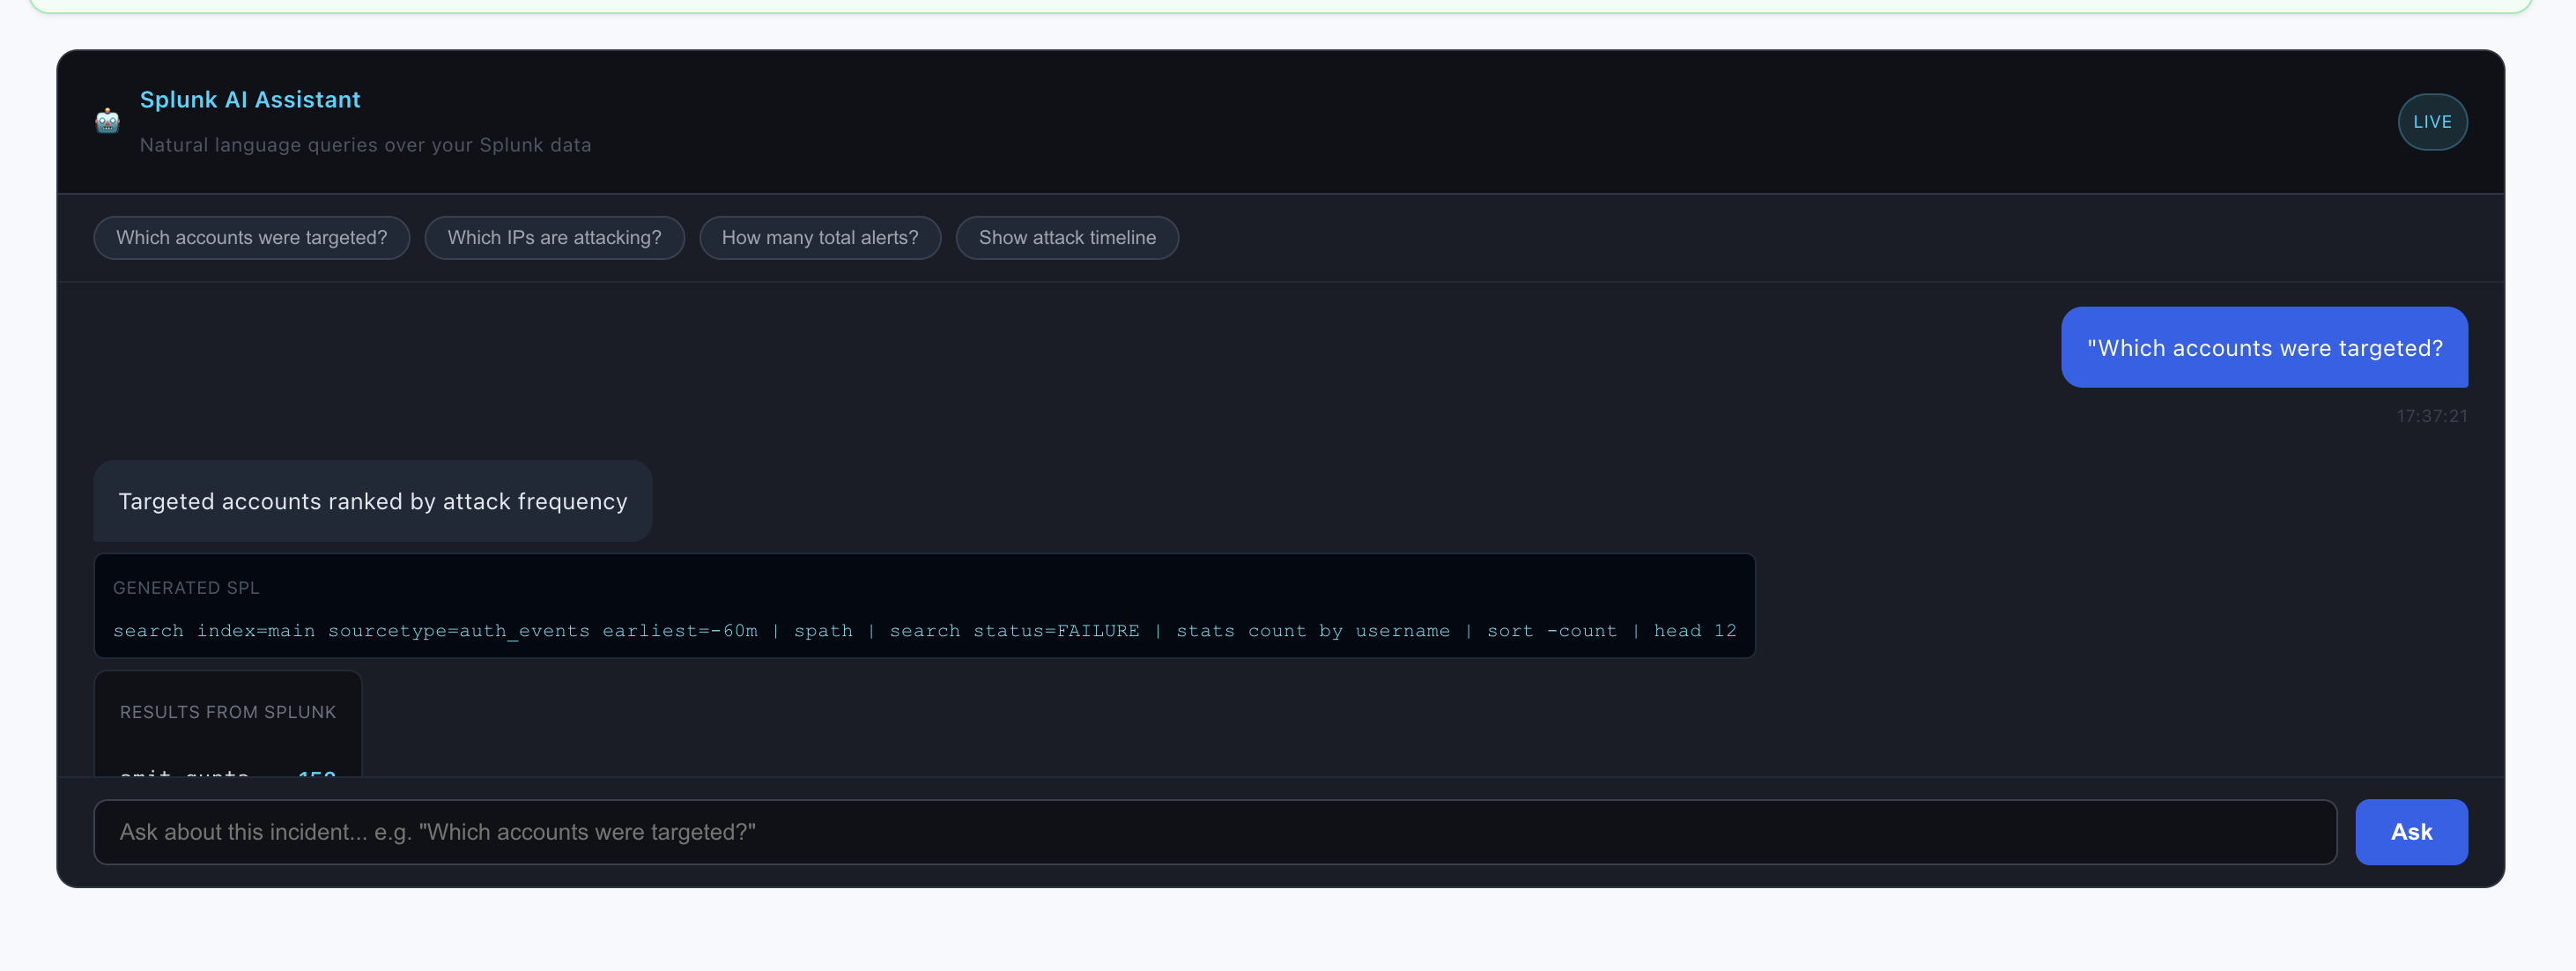
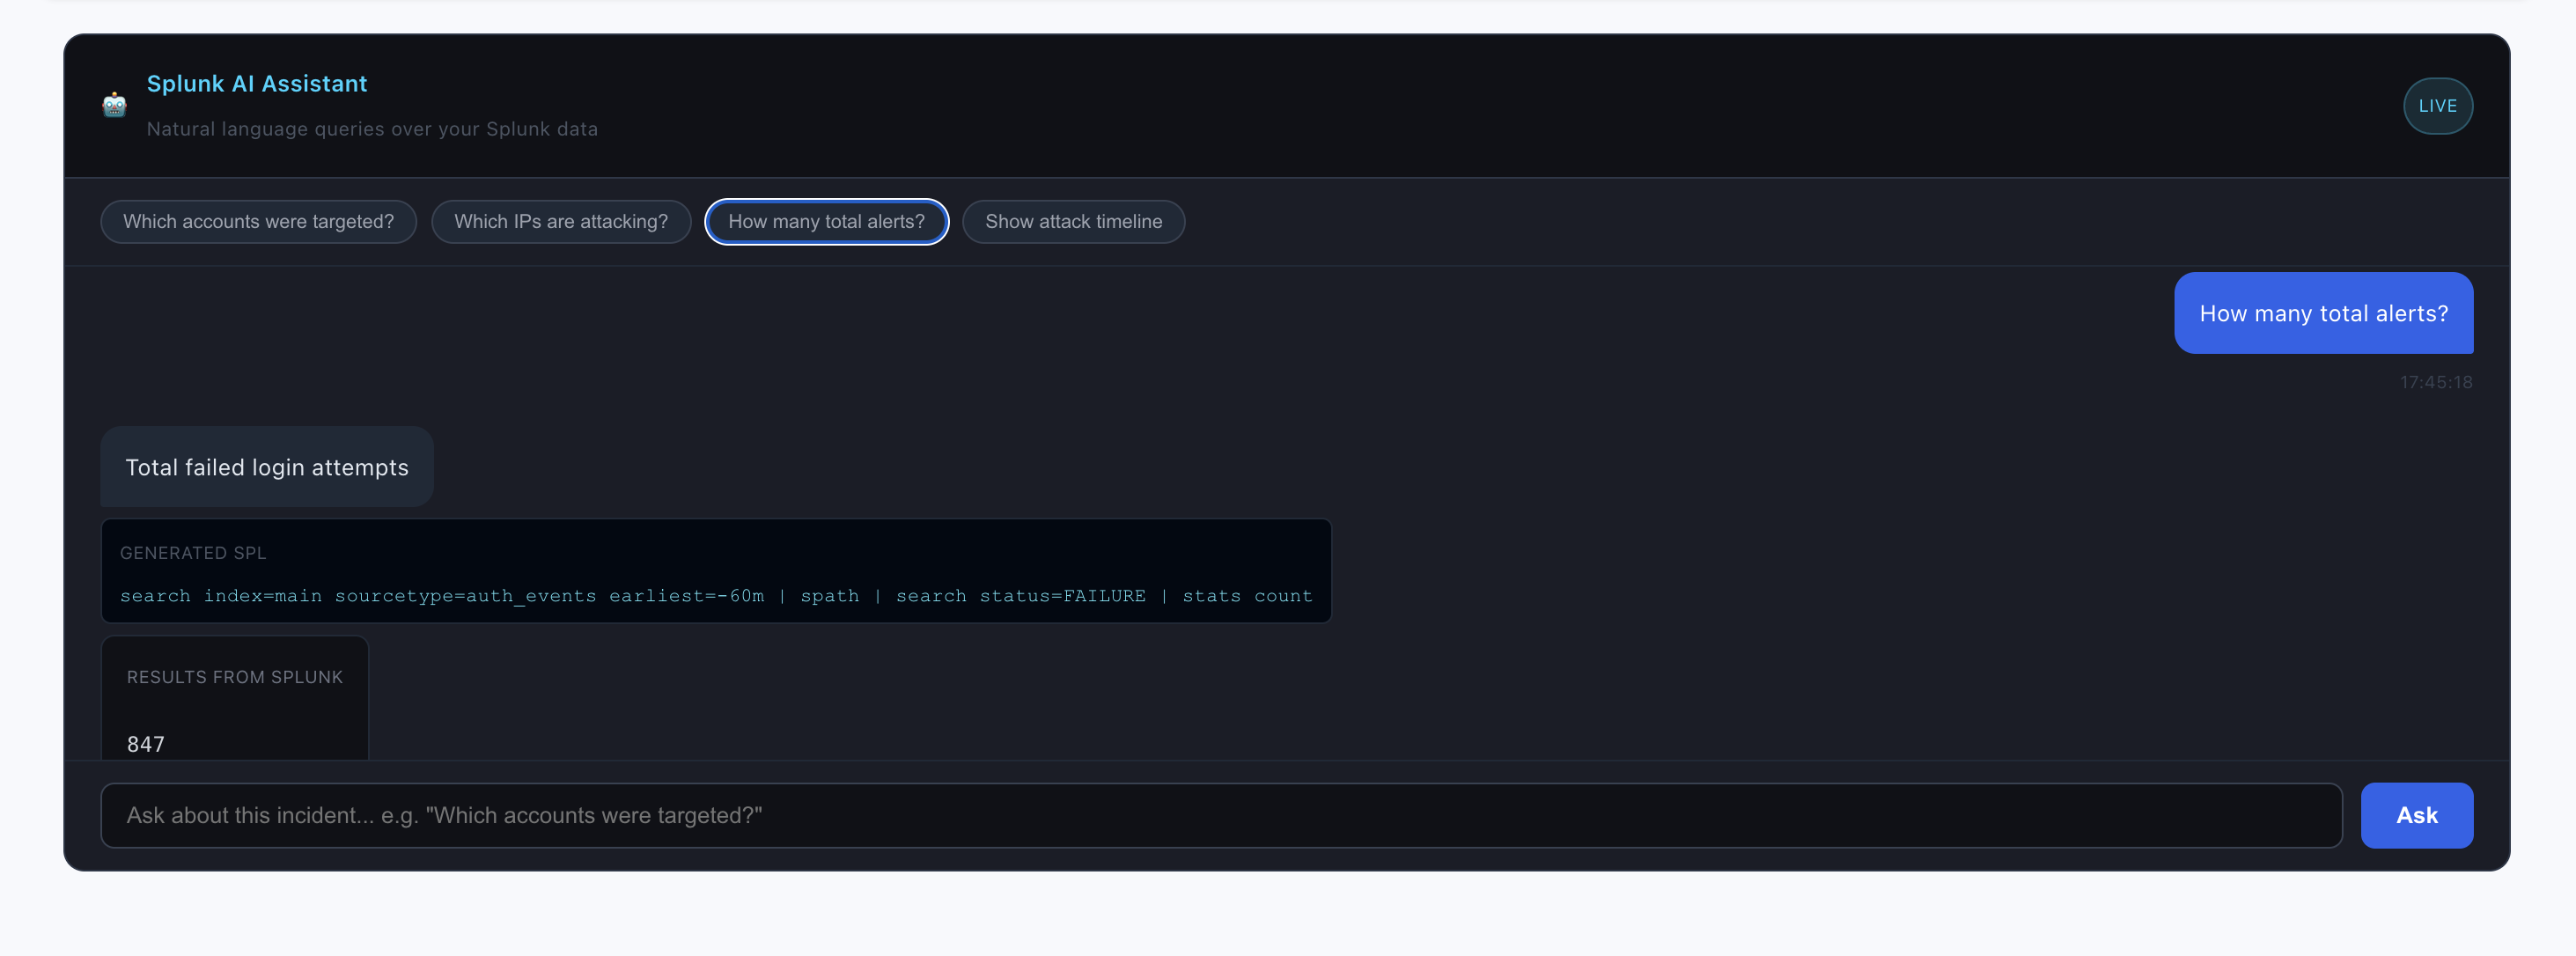
Layer 6 — Splunk AI Assistant (Natural Language Interface) We integrated Splunk AI Assistant directly into the SOC dashboard. The analyst can type any question in plain English — "Which accounts were targeted?", "Which IPs are attacking?", "Show attack timeline" — and the system generates the right SPL query, runs it live against Splunk, and returns structured results instantly. No SPL knowledge required.
🧱 Challenges we ran into
The campaign graph timing problem
Getting Neo4j and Splunk to talk through our agent pipeline in real-time was harder than expected. The first version had race conditions where the graph query would fire before Splunk finished indexing the latest events. We solved this with a proper polling mechanism and exec_mode=blocking on Splunk search jobs.
Splunk MCP authentication
We spent more time than we'd like to admit on the difference between port 8088 (HEC — for receiving logs) and port 8089 (Management API — for search queries). One wrong port number and everything looks broken. Lesson learned: always verify which Splunk endpoint does what before writing any agent code.
Setting up the Splunk MCP Server Installing the official Splunk MCP Server app revealed a KVStore dependency that had not initialised correctly due to a macOS keychain conflict with MongoDB. We resolved this by using the MCP Server's dedicated encrypted token creation flow instead of standard Splunk token auth, and implemented a graceful REST API fallback so detection never stops even if the MCP SSE connection times out.
SPL field extraction
Our attack logs were stored as raw JSON in Splunk's _raw field. The initial SPL query using status=FAILURE returned zero results because Splunk wasn't auto-extracting the JSON fields. Adding | spath before the filter fixed it instantly — but finding that one missing command took longer than expected.
Token compression for AI Our first attempt sent raw Splunk log output to the AI — 30,000+ tokens, slow, expensive, and the responses were generic. The breakthrough was realising the graph already has all the intelligence. The AI just needs to explain what the graph found. Compressing to 300 tokens of graph context made responses 10x faster and dramatically more precise.
Making "memory" feel real The campaign graph concept sounds simple — store past attacks, check future ones. But making it feel magical in the demo required careful data seeding. The historical phishing campaign had to use the exact same IPs as tonight's attack. Timing the Neo4j seed data correctly so the graph match fires at exactly the right moment in the demo took multiple runs to get right.
🏆 Accomplishments that we're proud of
Built a fully functional agentic SOC pipeline — not a prototype, not a mock. Real Splunk data flowing into real agents producing real incident reports.
The campaign graph actually works — when the Commander Agent finds
203.0.113.10in tonight's attack and Neo4j returnsPhishing wave — June 11, that connection is real data from a real graph query. That moment genuinely surprised us when we first tested it.22 automated actions in under 90 seconds — from raw alerts to locked accounts, blocked IPs, and escalated monitoring. No human intervention required until the approval step.
One report instead of 847 alerts — this was always the goal. Getting there required the full pipeline to work perfectly end-to-end, and seeing it click was genuinely satisfying.
Splunk AI Assistant working in the dashboard — analysts can ask "Which accounts were targeted?" and get live Splunk query results in under 2 seconds. Natural language to SPL to structured results, all inside the incident response workflow.
A dashboard that looks like a real SOC product — the CRITICAL glow, terminal-style AI verdict, campaign graph visualisation, human approval workflow, and AI Assistant chat panel. It feels like something you'd actually deploy.
📚 What we learned
Agents are only as good as their data source. The whole system lives or dies on Splunk data quality. We learned to think about log schema, field names, and SPL query design before writing a single line of agent code.
Graph databases think differently.
Switching from relational thinking to graph thinking is a real mental shift. The moment we stopped thinking "tables and rows" and started thinking "nodes and relationships" — the campaign detection logic became obvious. Cypher queries that would take complex SQL joins are a single MATCH statement in Neo4j.
Compress before you reason. Sending raw data to an AI is almost always the wrong approach. The right approach is: let your domain logic do the heavy lifting, then ask the AI to explain what it found. 300 tokens beats 30,000 every time.
Splunk MCP changes how agents work. The ability for agents to query Splunk via MCP instead of hardcoded API calls makes the system genuinely composable. The Commander Agent doesn't need to know Splunk internals — it just asks questions and gets answers. That abstraction is powerful.
JSON field extraction matters.
In Splunk, if your logs arrive as JSON blobs, always add | spath to your SPL pipeline before filtering on field values. One missing command can make all your data invisible to your queries.
🚀 What's next for ThreatGraph
SPL query explanation mode The AI Assistant currently returns results but not explanations. The next step is having it explain why the SPL query was chosen and what the results mean in plain English — making the system usable by analysts with zero SPL experience.
Cross-session campaign tracking Right now, the campaign graph lives in a single Neo4j instance. The next step is federating it — so campaigns detected at one bank branch automatically protect all branches.
Automated Jira + Slack integration Every incident should auto-create a Jira ticket and fire a Slack alert to the security team, with the full campaign context attached. The pieces are in place — it's a matter of wiring them up.
Real WAF integration Right now, IP blocking writes to a local file. The production version connects to Cloudflare, AWS WAF, or Palo Alto firewalls and executes real blocks via their APIs.
Multi-bank threat sharing The most powerful version of the campaign graph is a shared one. If attacker IPs are detected at Bank A on Monday, Bank B should be protected from them on Tuesday — automatically, before they even strike.
"Your firewall forgets. ThreatGraph never does."
Built With
- ai
- assistant
- axios
- cypher
- cytoscape.js
- docker
- enterprise
- event
- express.js
- hec
- javascript
- language
- mcp
- neo4j
- node.js
- processing
- python
- query
- react
- rest
- server
- spl
- splunk
- vite


Log in or sign up for Devpost to join the conversation.