-
-
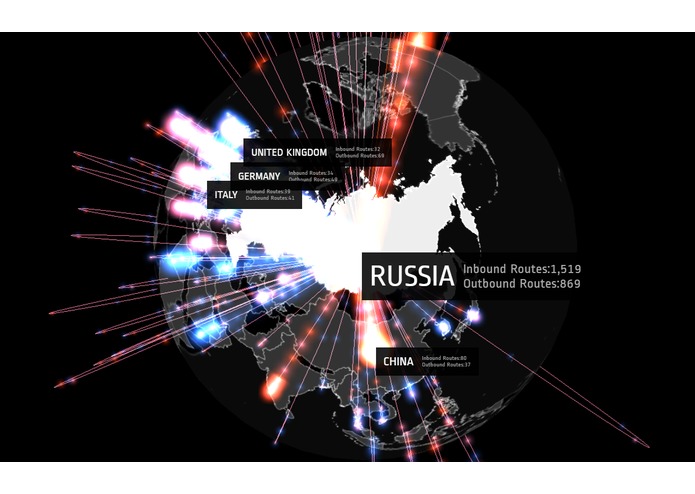
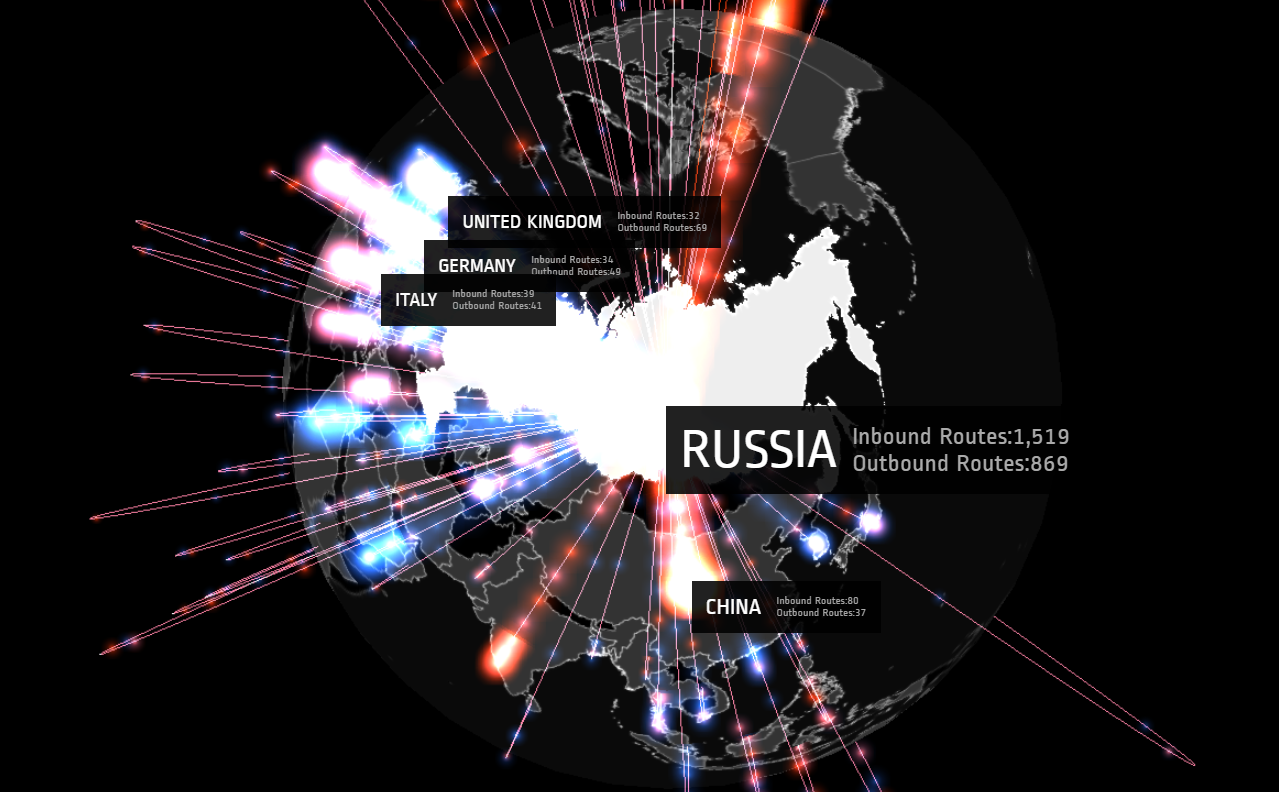
Russia
-
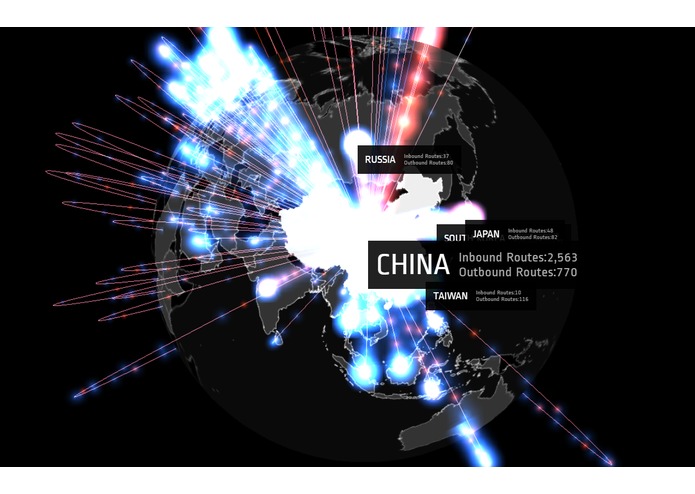
China
-
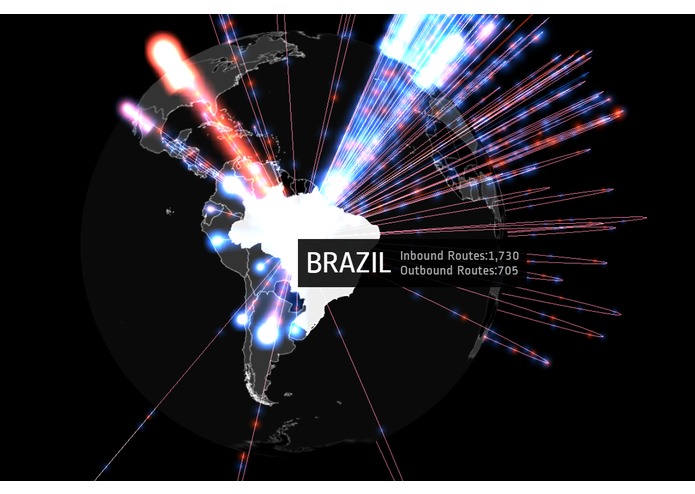
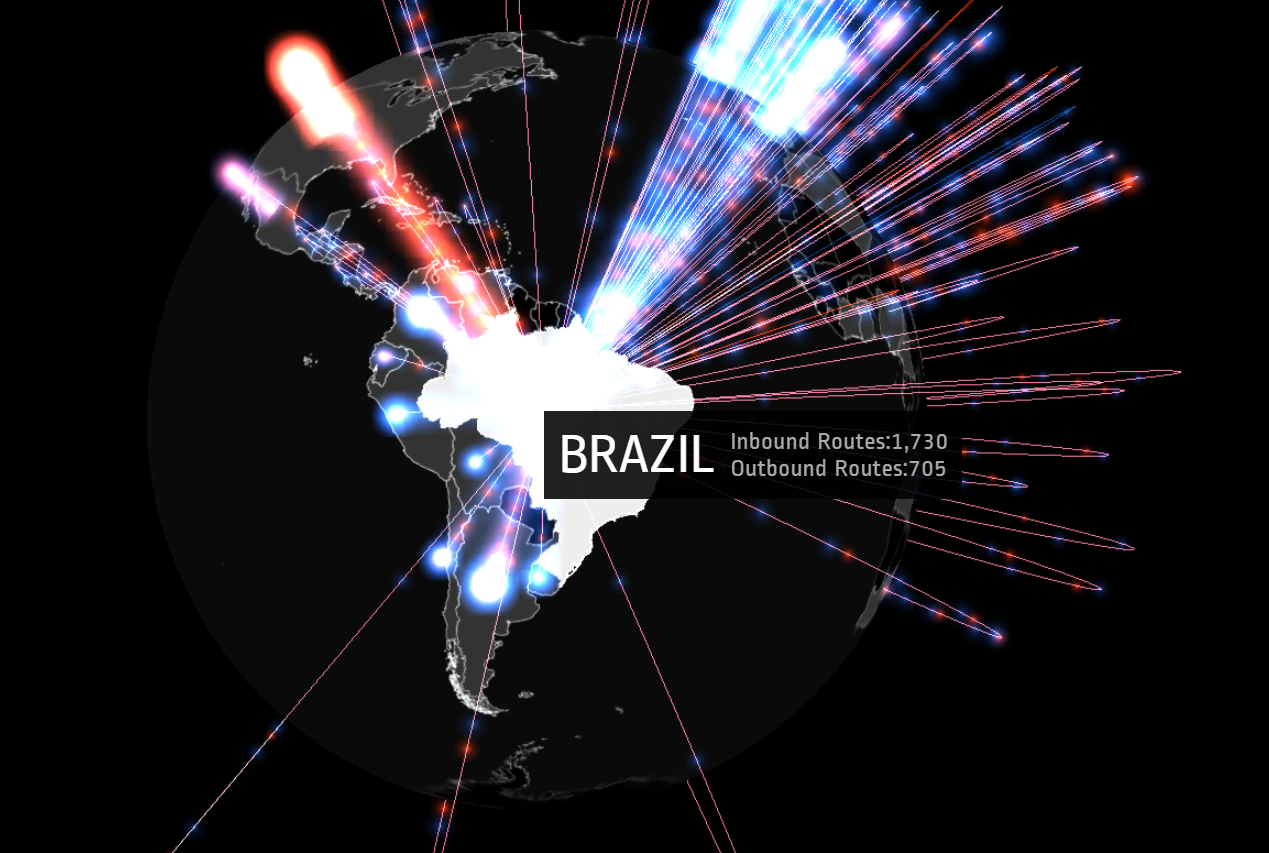
Brazil
-

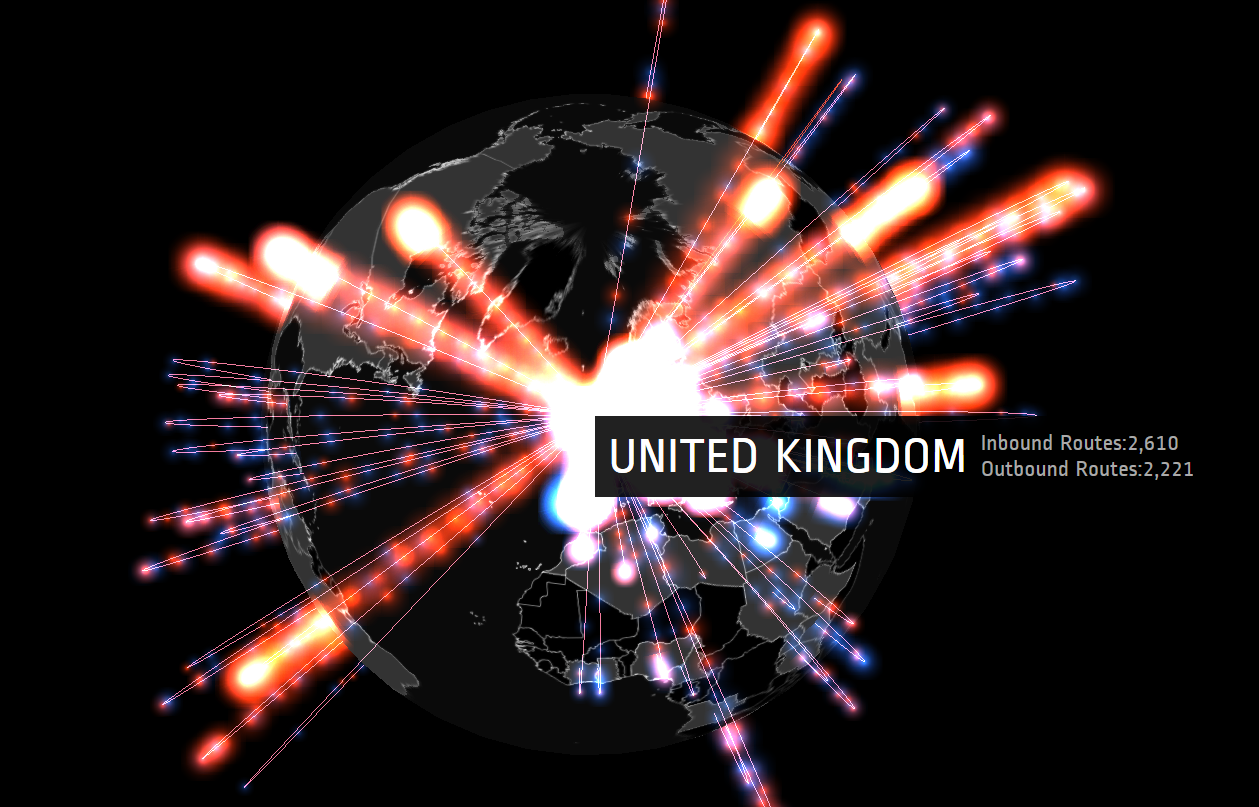
United Kingdom
-

Japan
-

United States


Inspiration
I wanted to see the world moving, so I decided to build a 3D visualization of the flight routes and volumes, representing peoples' movement across international borders.
What it does
Visualizes air traffic in an interactive 3D globe. Flight routes are represented as links between countries, with size of links being dependent on number of routes and route frequency. Inbound routes are shown as blue links, while outbound routes are shown as red links.
How I built it
Data was scraped from Skyscanner Travel API endpoint using Python script on an AWS EC2 instance. D3 for DOM/SVG manipulation, THREE for WebGL rendering.
Challenges I ran into
Integrating Leap motion with three.js? More trouble than it's worth.
Accomplishments that I'm proud of
Made use of skyscanner travel API in an unconventional way -- that visualizes effectively and in an aesthetically pleasing manner, the flight routes that exist and reveal unseen trends in everyday data.
What I learned
Skyscanner API, more three.js stuff.
What's next for This Is Skynet
Evolve into a self-aware AI that attempts to exterminate all of humanity. Or we could just add data vis for cargo traffic and flight movements. Not necessarily in that order.


Log in or sign up for Devpost to join the conversation.