Inspiration
Amishi was taking a class on the effects of climate disasters, so the prompt was really interesting to her, leading us to choose to do this project.
What it does
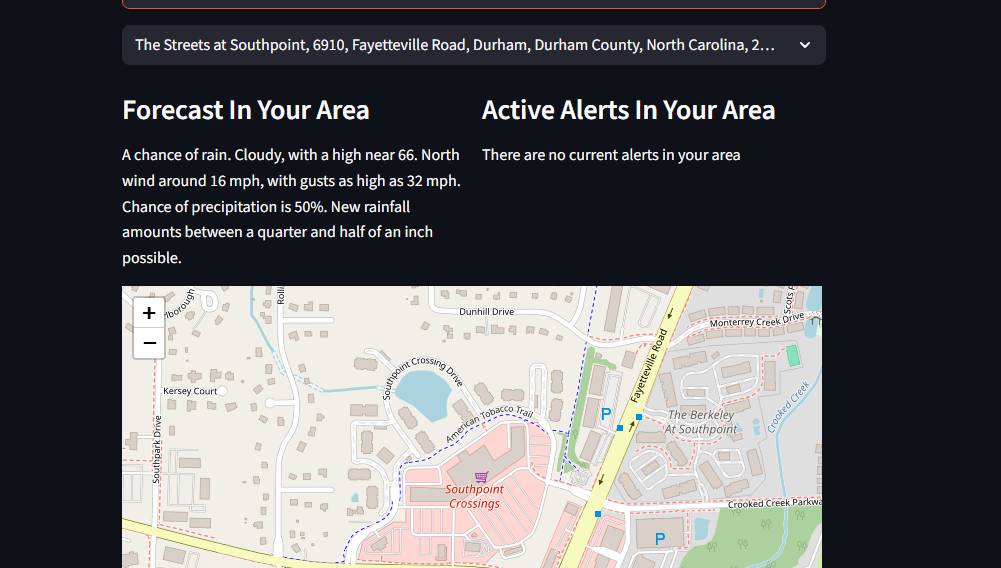
- Shows the weather forecast based on user location
- Uses LLM to generate suggestions to combat increasing urban heat
- Uses a clustering model in order to determine which areas are most susceptible to urban heat problems
How we built it
We used Streamlit to host the app, used Streamlit-Folium to create a visual map, and used geopy.geocoders with Nominatim to give address suggestions and information based on user text input, and used the NOAA weather api to get the weather and any current alerts in that area. We aggregated data using geopandas, and used sklearn to cluster and clean the data. We then used that data to determine whether or not the user's location is at high heat risk. Using the weather data from NOAA and the coordinates of their location, we also used Gemini to give household suggestions to improve heat resilience
Challenges we ran into
We have never worked with such large datasets or with geospatial data, so learning how to process that and learning how to efficiently deal with datasets of that size took up a lot of our time before we were able to use the data.
Accomplishments that we're proud of
We are proud that we were able to implement the large datasets and that we were able to use Gemini to make suggestions to the user
What we learned
As stated previously, we learned how to work with geospatial data and large datasets. We also learned how to use streamlit-folium to create interactive maps
What's next for ThermoTracker
We plan to use larger datasets and more predictor variables to expand the scope to the entire North Carolina area, and eventually make it countrywide.
Built With
- durham
- gemini
- geopandas
- matplotlib
- noaa-climate-data-online
- nominatim
- numpy
- pandas
- python
- shapely
- streamlit

Log in or sign up for Devpost to join the conversation.