TerraPulse 4D
Elevator pitch: TerraPulse 4D simulates a real city block's climate future — heat, flooding, vegetation — over 10 years, so you can test green infrastructure before it's built.
Live demo: https://terrapulse-six.vercel.app
Inspiration
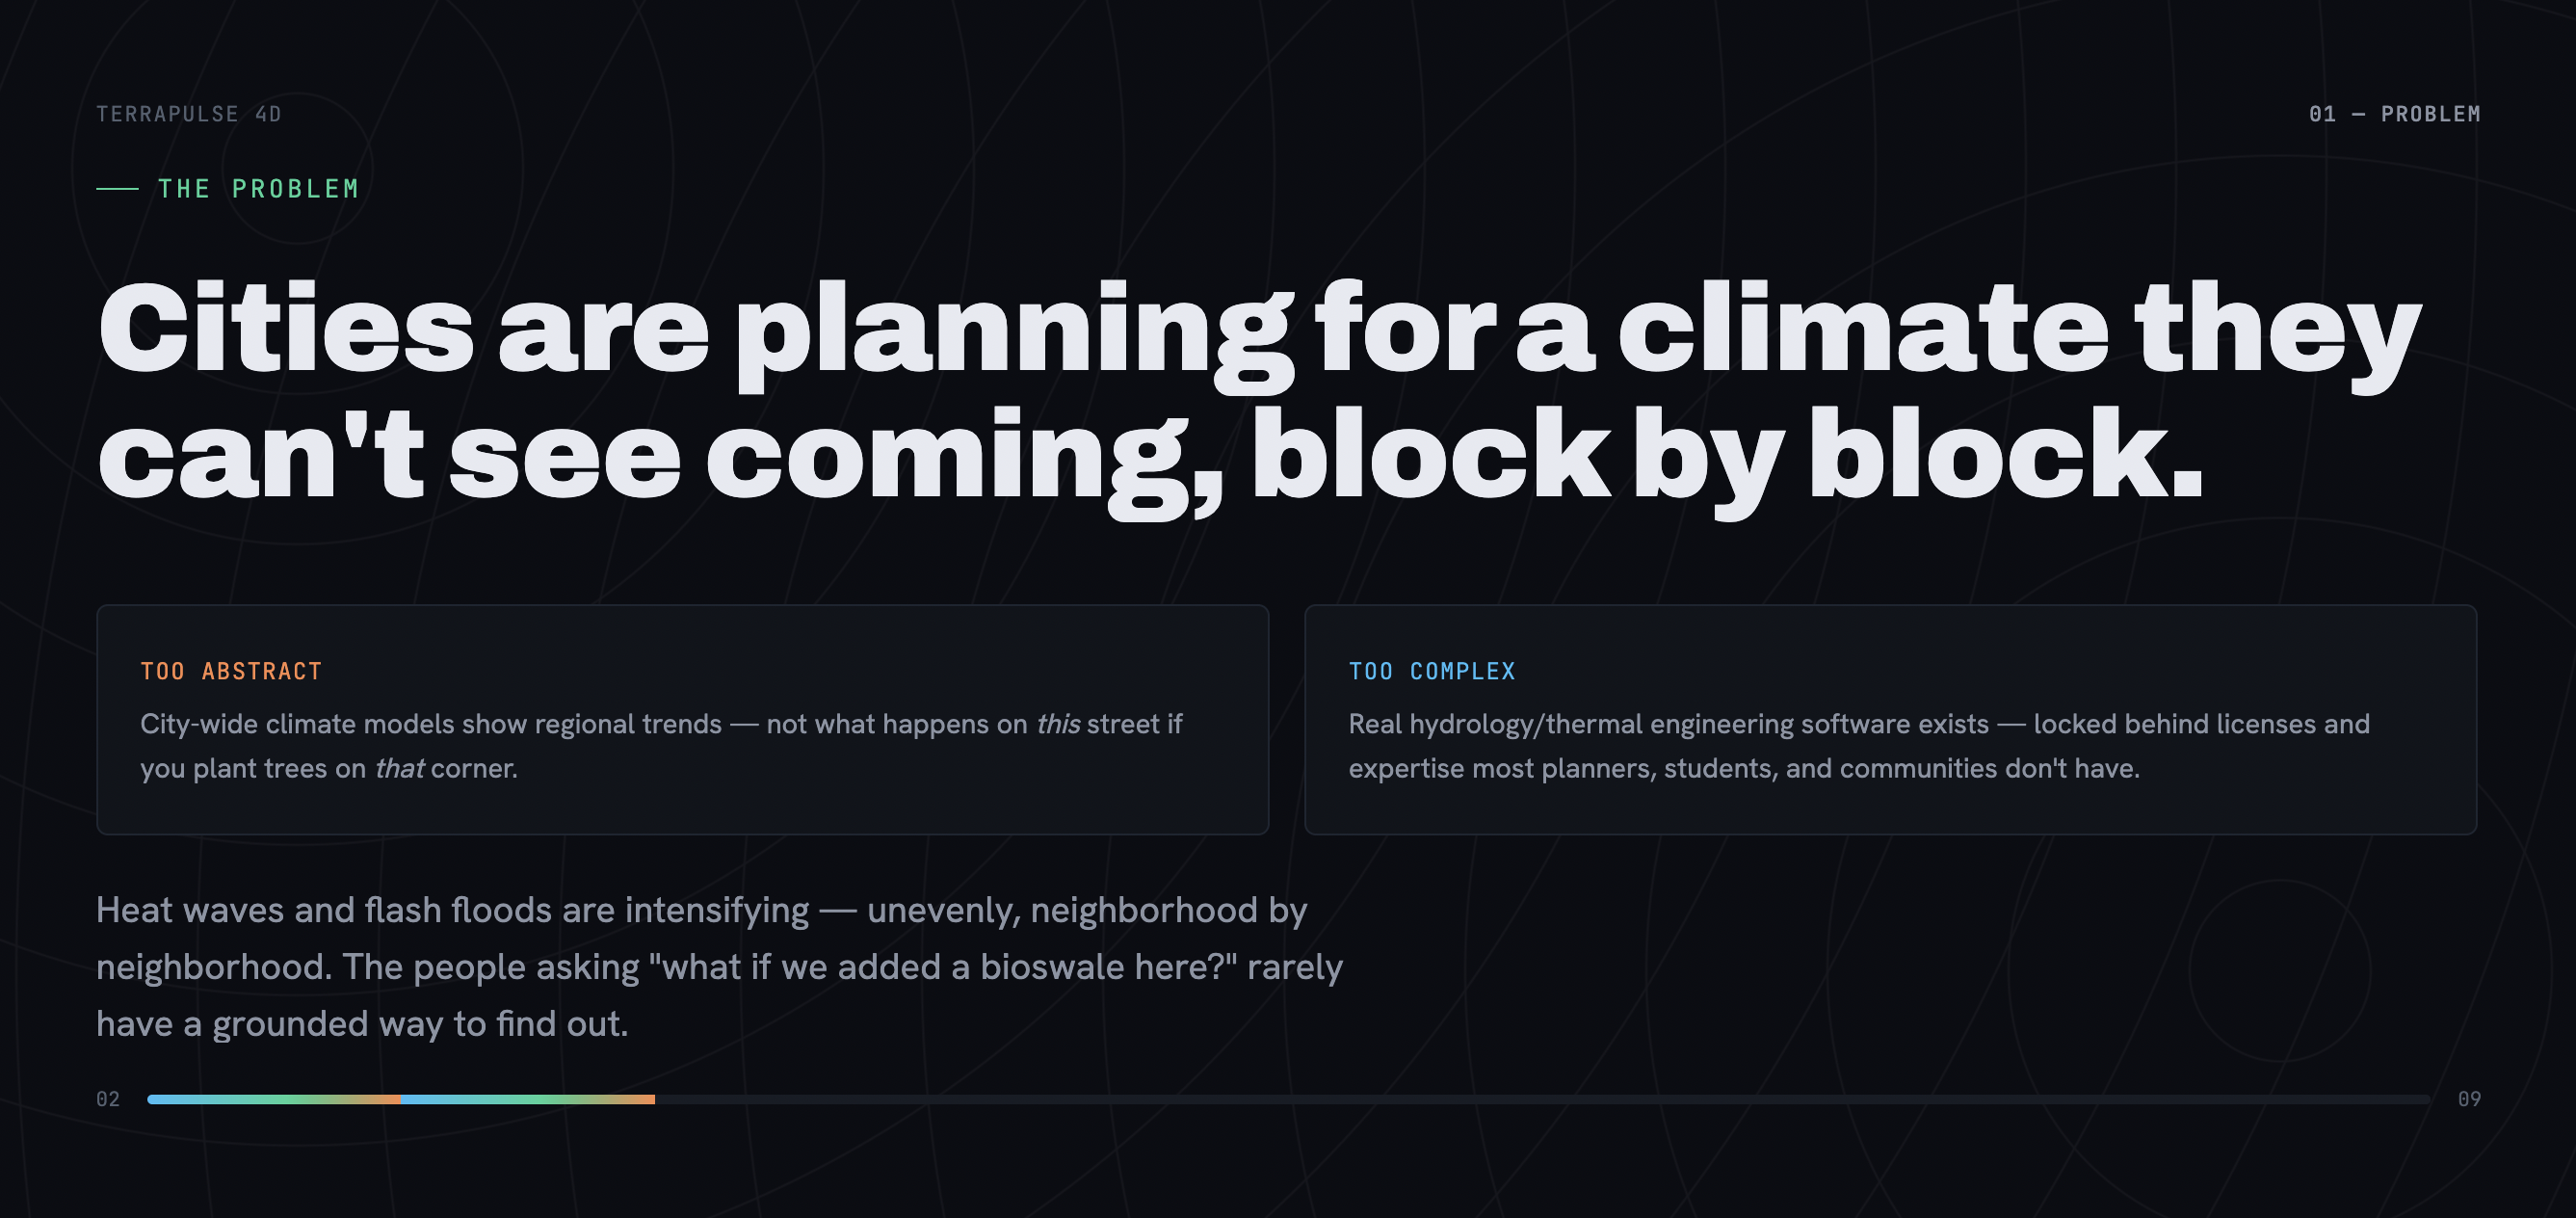
Heat waves and flash floods are intensifying, but unevenly — block by block, not city-wide. The people actually asking "what if we planted trees on this corner, or added a bioswale on that one?" rarely have a way to find out that's both grounded in a real place and simple enough to actually use. Regional climate models show trends with no address. Real hydrology and thermal engineering software exists, but it's locked behind licenses and expertise most planners, students, and communities don't have. We wanted something in between: real terrain, real climate, real physics — usable by anyone, for any real place.
What it does
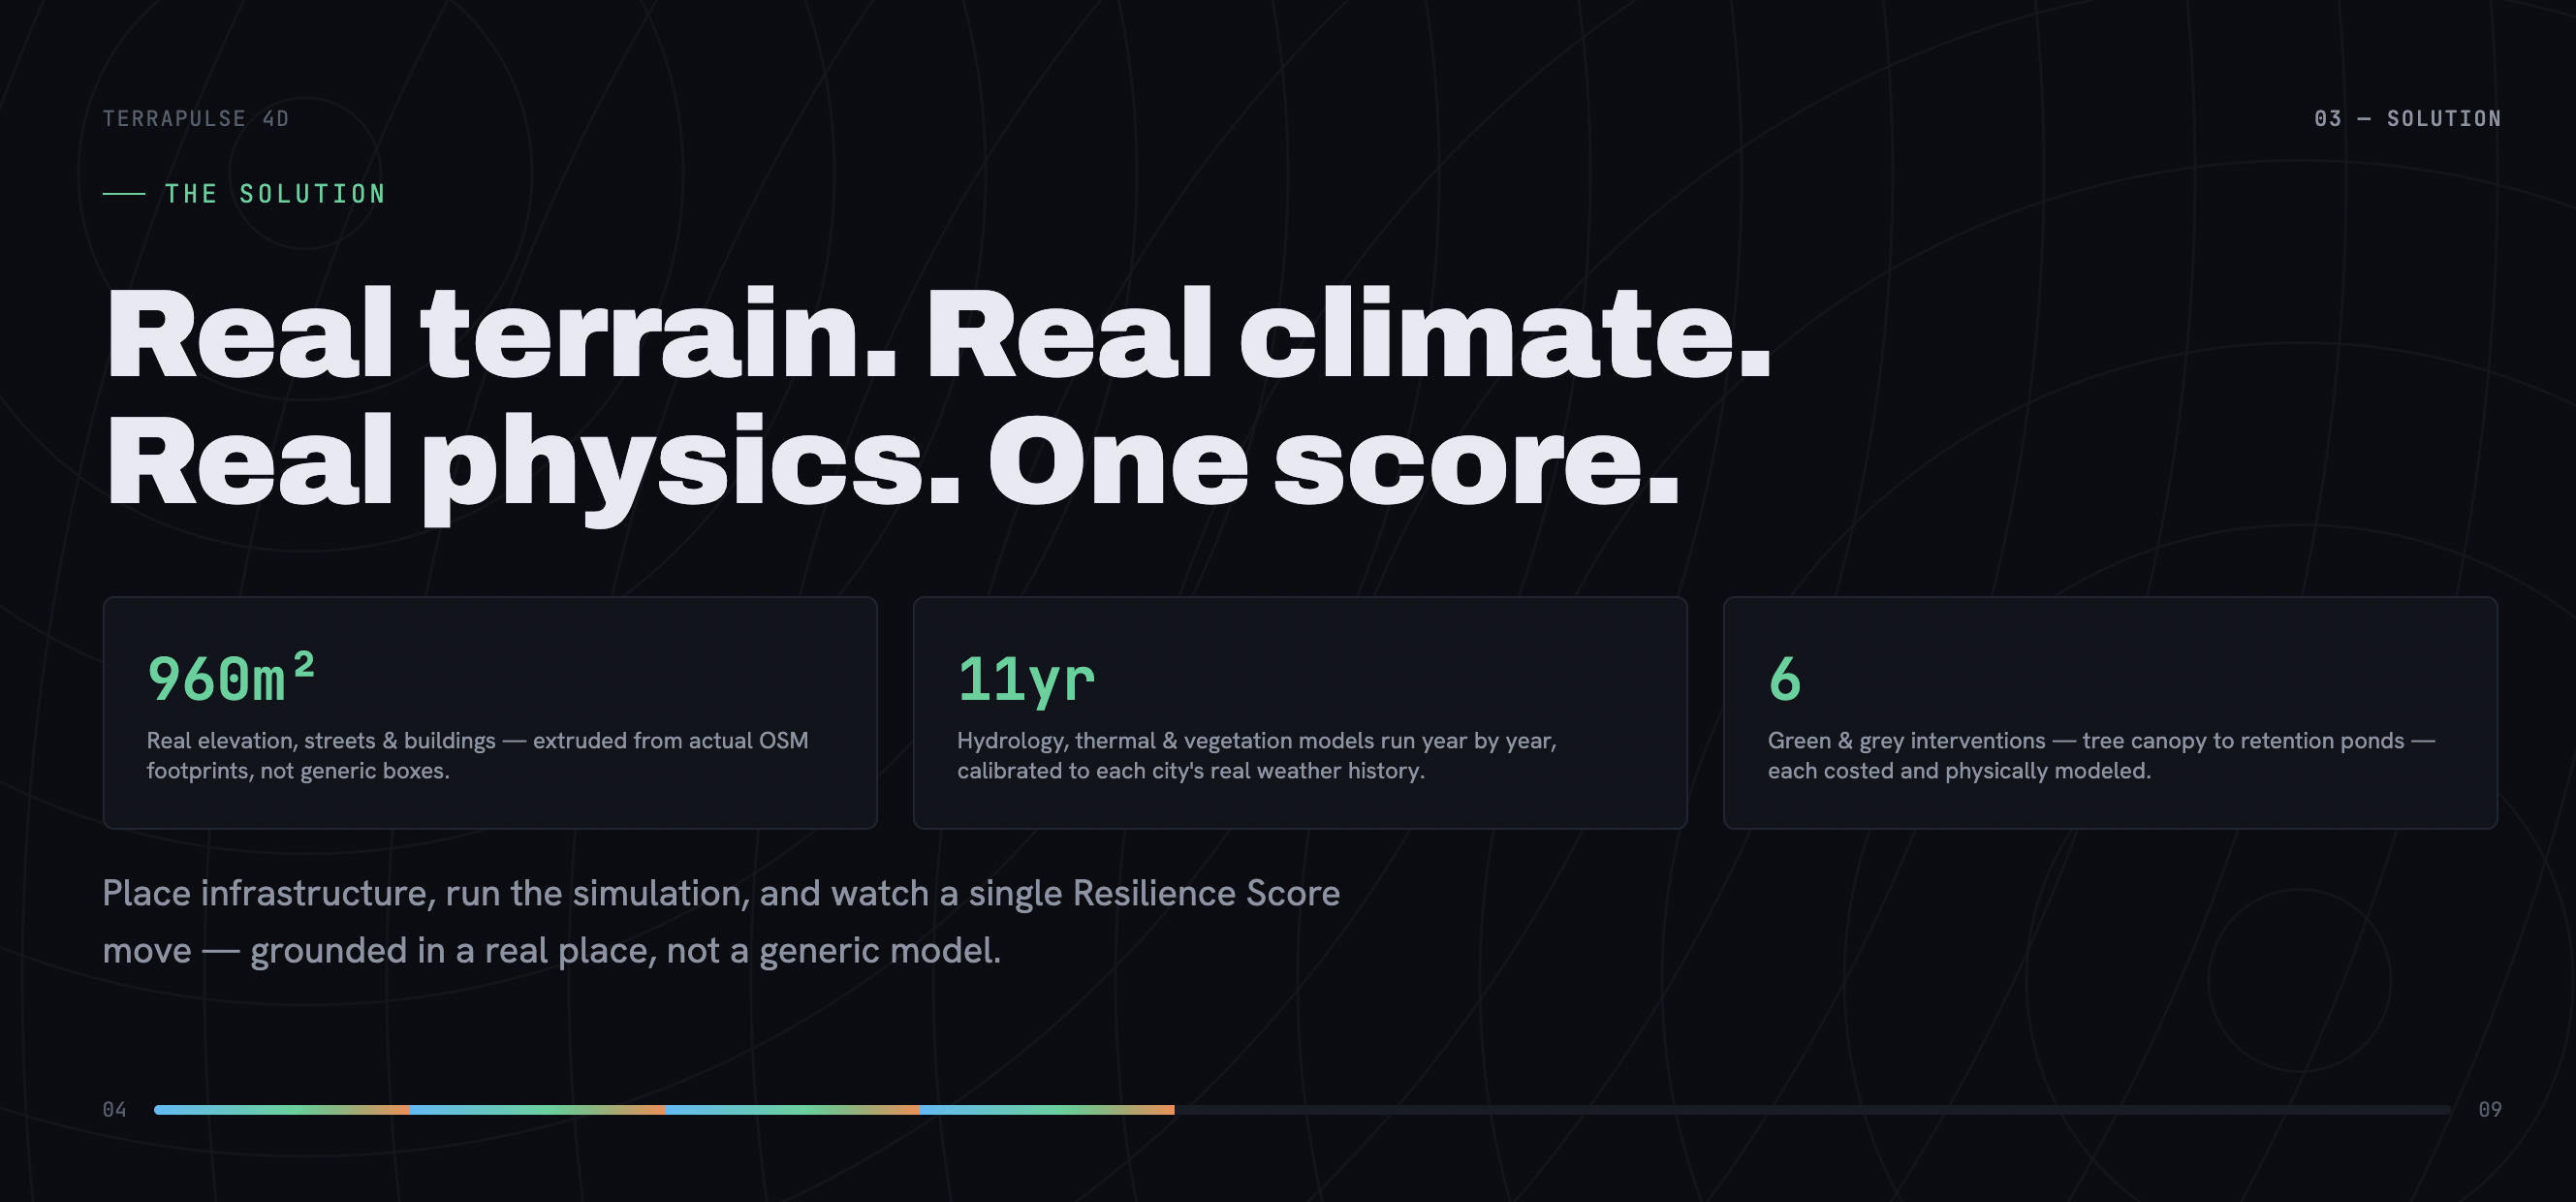
TerraPulse 4D takes a real ~960m × 960m neighborhood block — real elevation, streets, water, and buildings (each one extruded from its actual OpenStreetMap footprint, not a generic box) — pulls in that location's actual historical climate, and runs a year-by-year physics simulation of heat, flooding, and vegetation across a 10-year horizon.
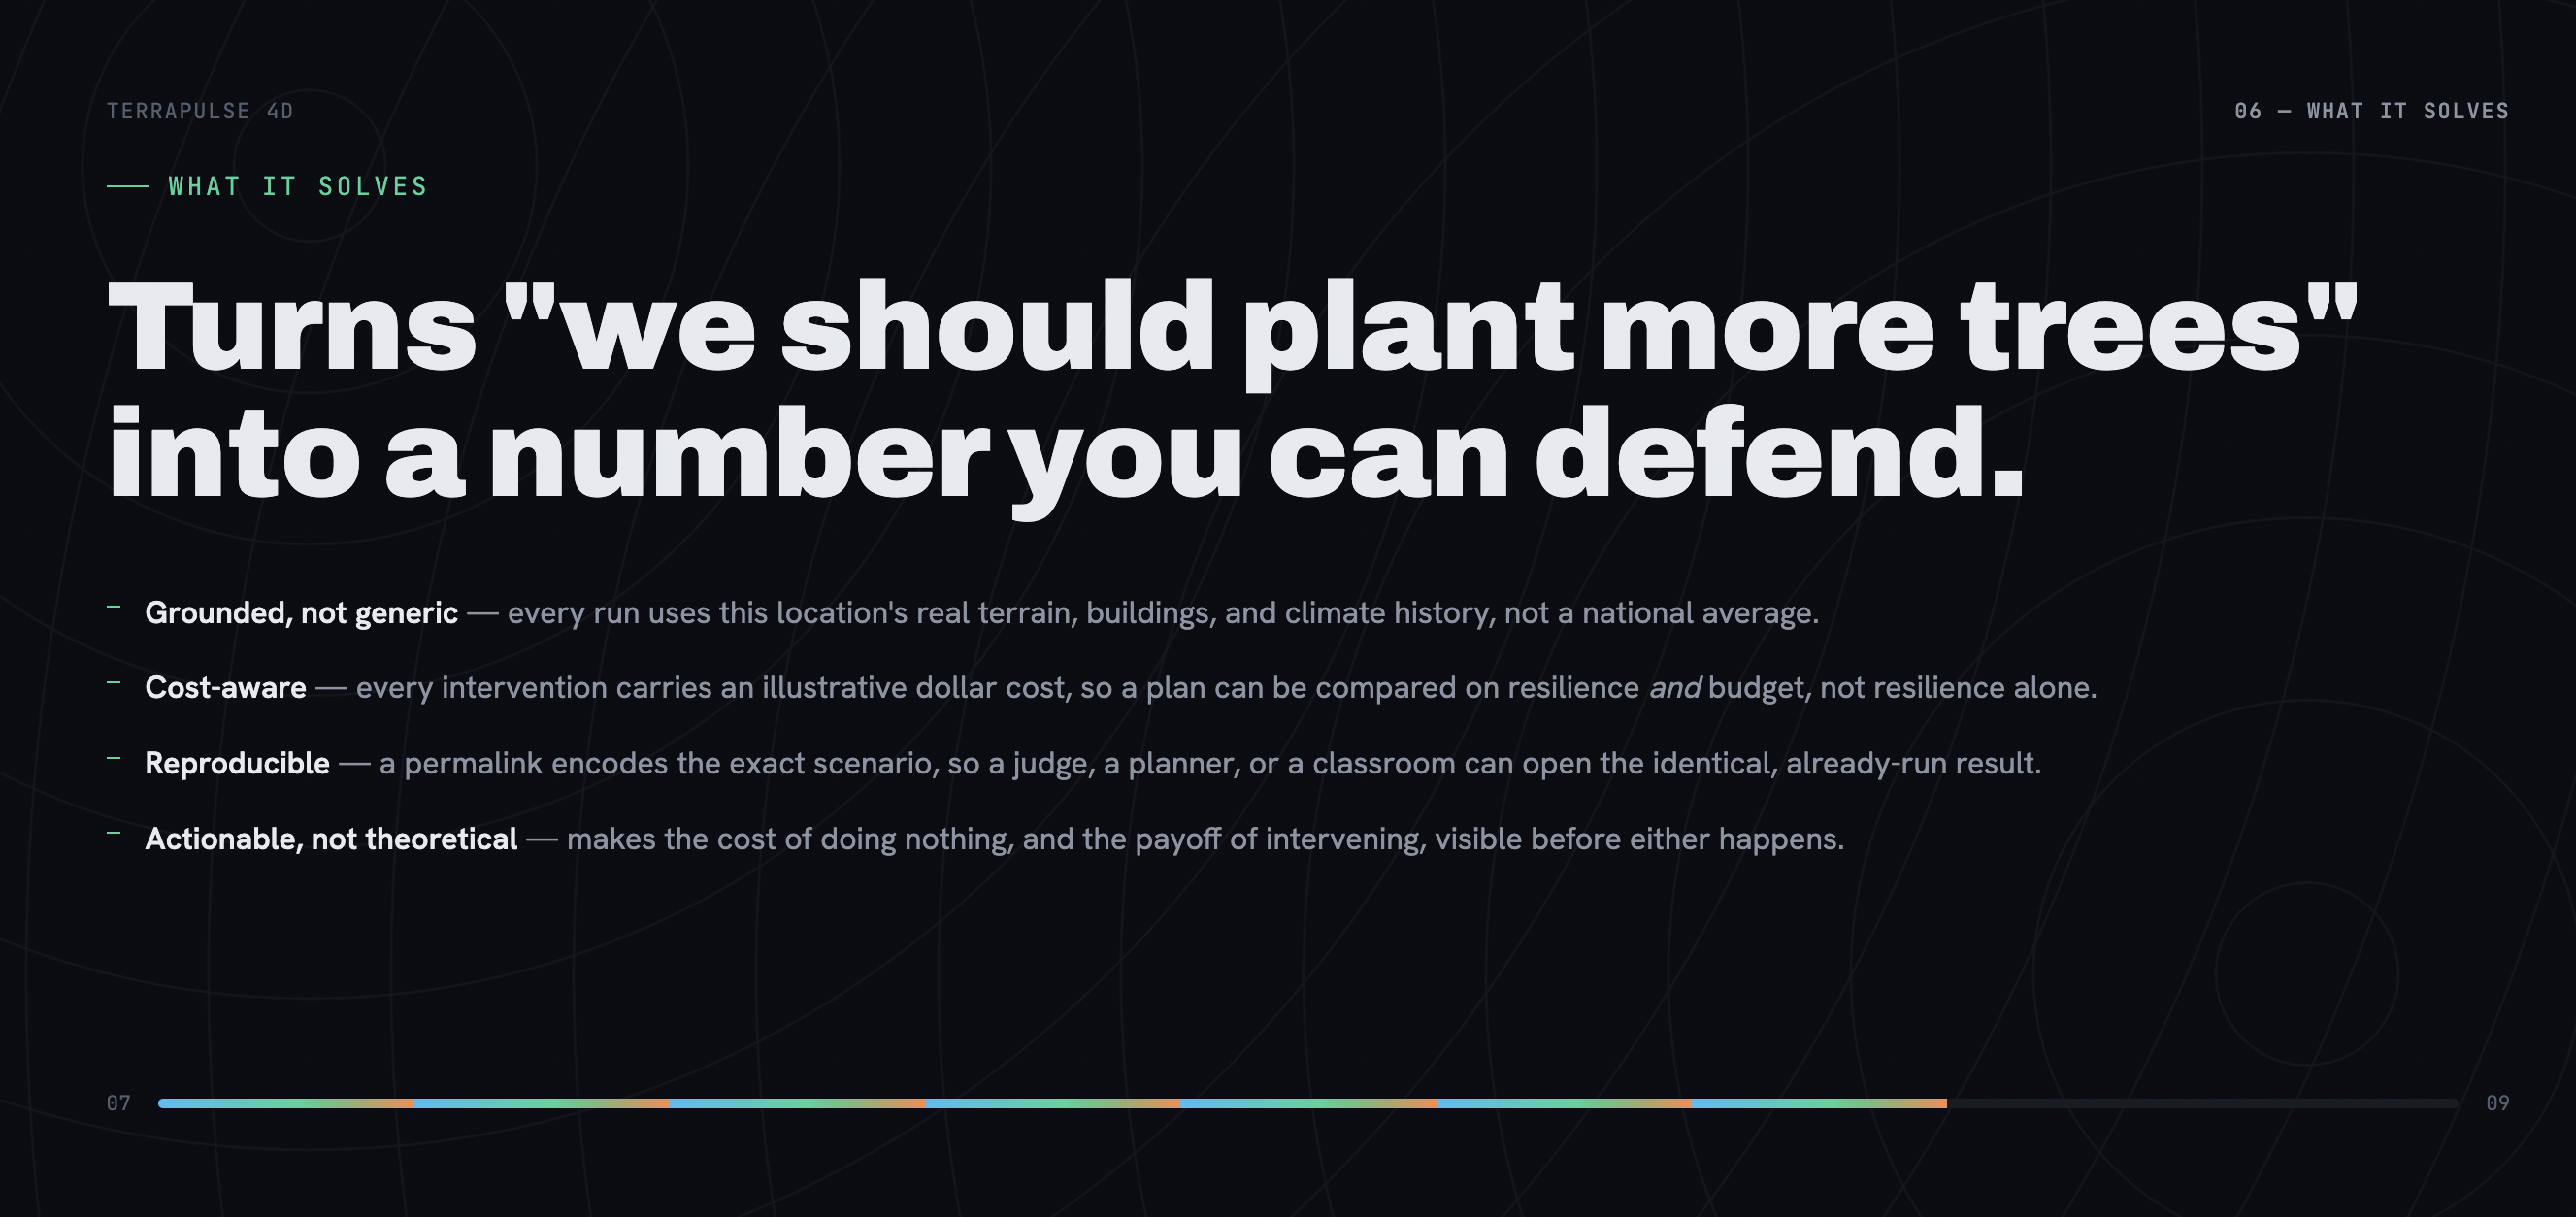
Place up to five each of six green and grey interventions — tree canopy, bioswales, permeable pavement, green roofs, cool roofs, retention ponds — and everything updates: a single Resilience Score, urban heat island delta, flood risk area, carbon sequestered, and soil moisture, each compared against an automatically computed do-nothing baseline. A trend chart tracks Resilience across all 11 years, a "what changed" callout compares your latest run to your last one, and every intervention carries an illustrative cost so a plan can be judged on budget as well as impact.
It opens on an already-placed, already-run real scenario — not an empty grid — with a short welcome tour, and a Share button copies a permalink that reproduces the exact location and plan for anyone who opens it. An optional Claude-generated narrative summarizes each run in plain language; without an API key, a deterministic recommender takes over so the demo never depends on it.
How we built it
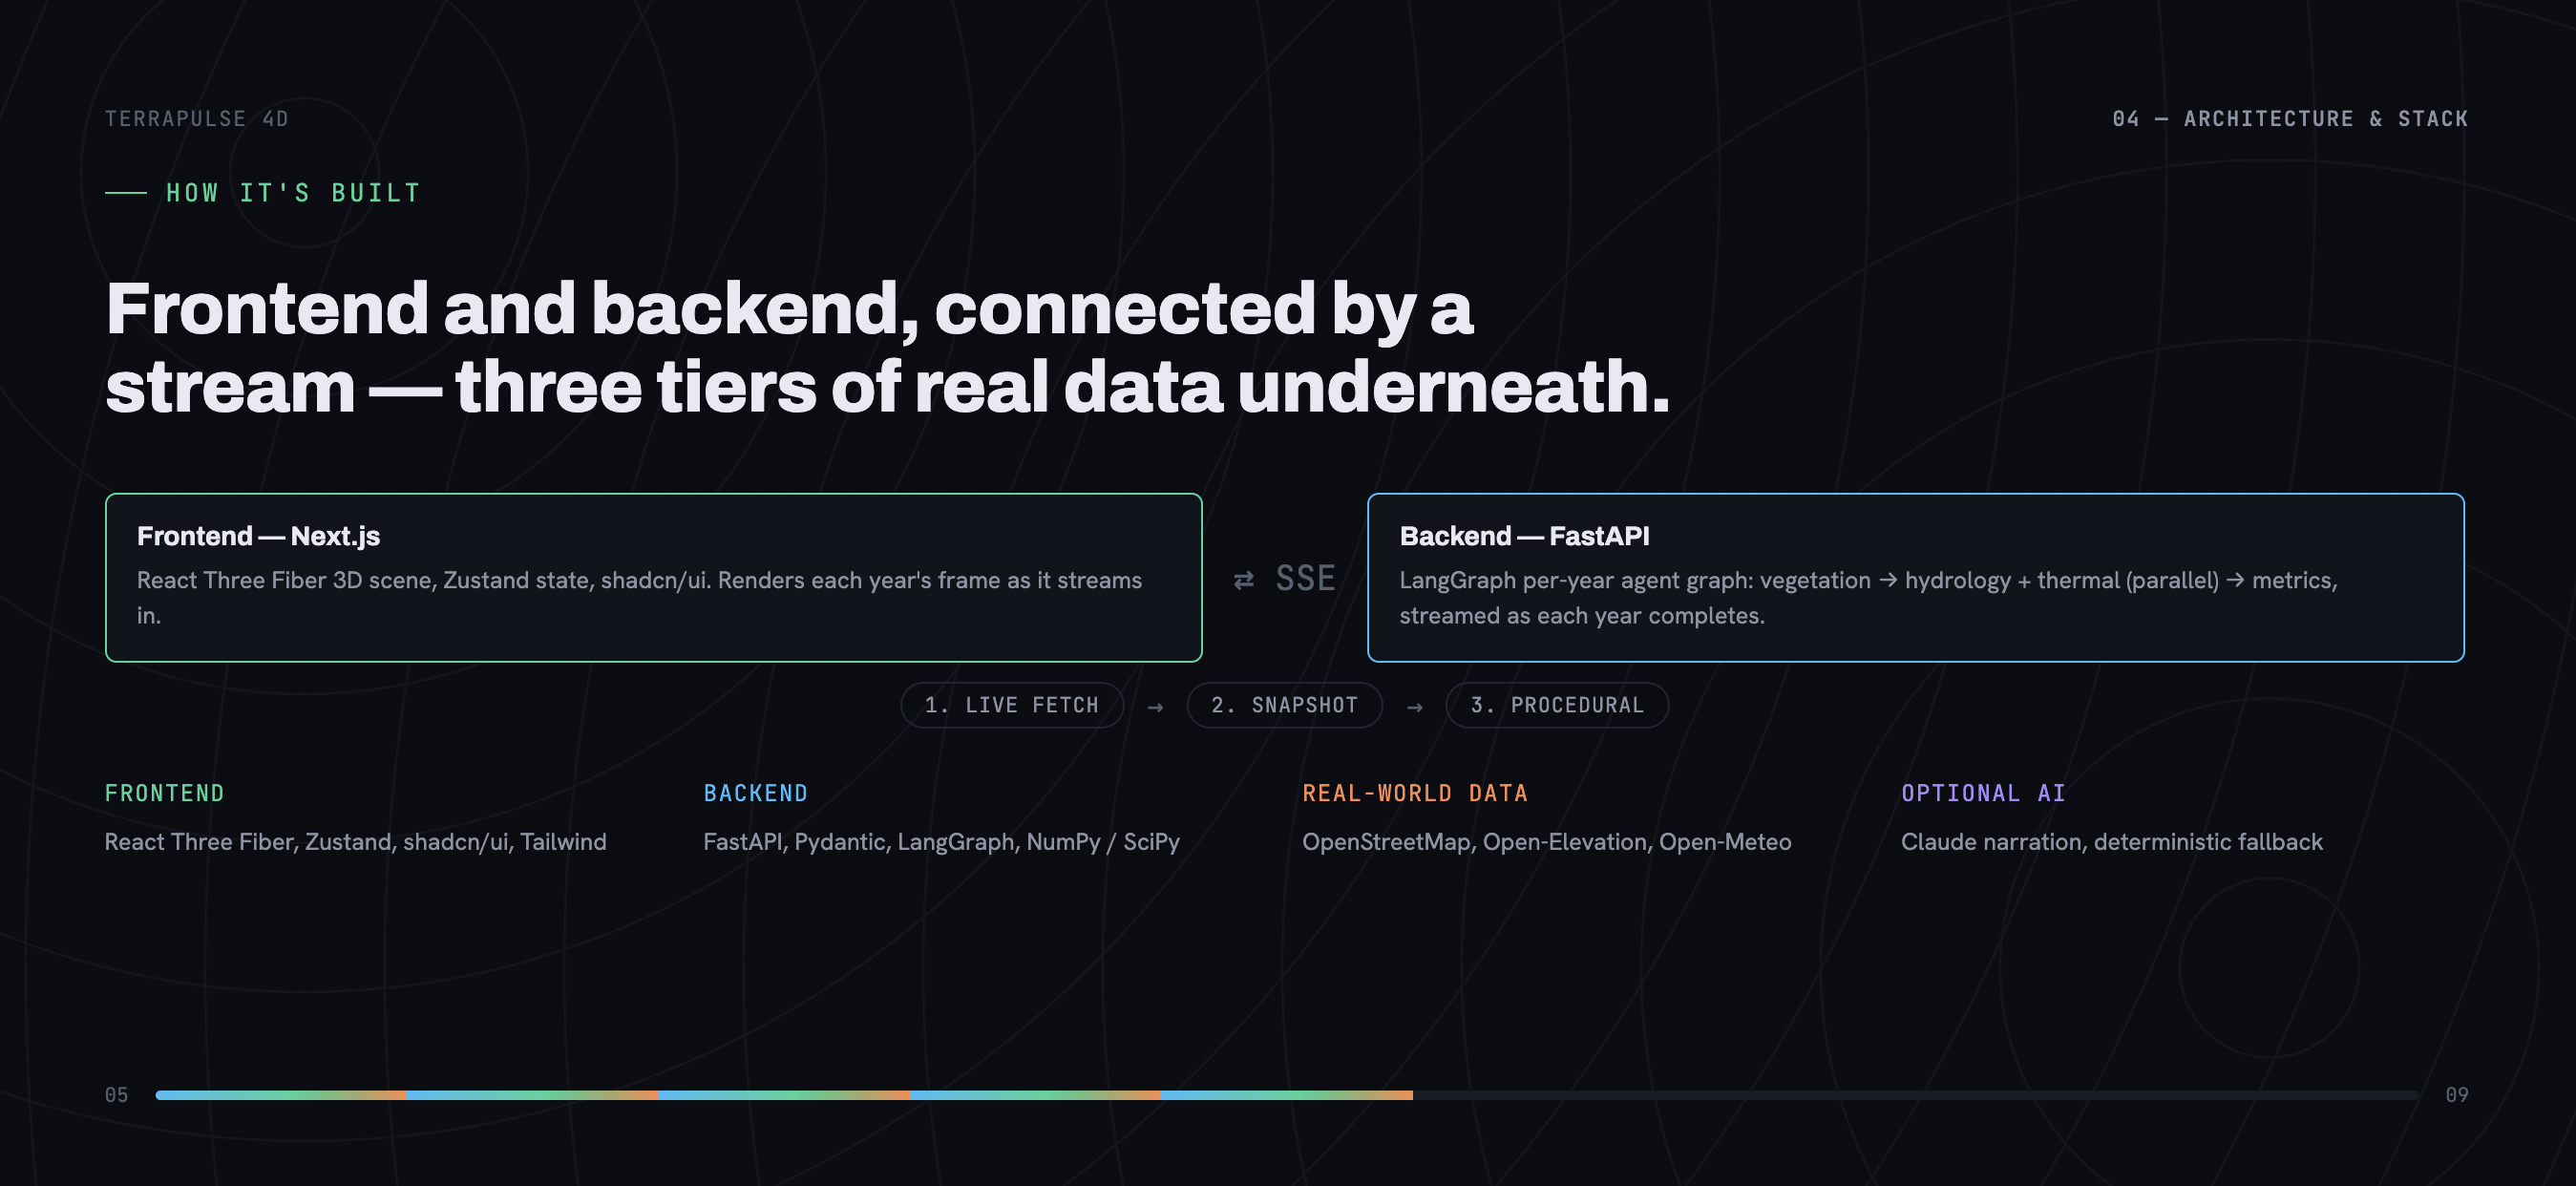
The frontend is Next.js 15 and React Three Fiber, rendering the 3D scene from data streamed over Server-Sent Events. The backend is FastAPI orchestrating a LangGraph agent graph that runs year by year: a vegetation agent computes canopy growth and soil moisture first, then hydrology (D8 flow accumulation + SCS Curve Number runoff) and thermal (surface energy balance, albedo, urban heat island) run in parallel off its output. Real-world data — OpenStreetMap building/street/water footprints, Open-Elevation terrain, Open-Meteo historical weather — flows through three fallback tiers: a live fetch first, a bundled real-data snapshot for the preset locations if that fails, and a fully deterministic procedural generator as the last resort, so a demo run never comes back broken or empty. The frontend is on Vercel; the backend is a Dockerized FastAPI service on Render.
Challenges we ran into
The "blocky" terrain that wasn't actually a rendering bug. Buildings originally rendered as one box per grid cell. We were already rasterizing each building's real OSM polygon to get its height — we just threw the shape away afterward. Preserving and extruding the actual footprint fixed it, but then buildings started floating off the edge of the map: Overpass returns a way's entire geometry the moment any single node falls inside the query area, so a building merely clipping the edge of our block could carry vertices hundreds of meters outside it. Polygon clipping (Sutherland-Hodgman) fixed that. Separately, a persistent "grid" pattern in screenshots turned out to be neither of those — it was a decorative CSS background div layered over the entire page, completely unrelated to the 3D scene, that had nothing to do with the terrain at all.
A cache that remembered failures forever. Two preset cities kept silently falling back to fake procedural terrain in production. The bug: our terrain and climate caches stored any result — including a failed live fetch — permanently, so a single transient network hiccup early in the server's life would degrade that location until the process restarted. We only found it because the "fallback" responses were suspiciously fast — too fast to be a real network attempt.
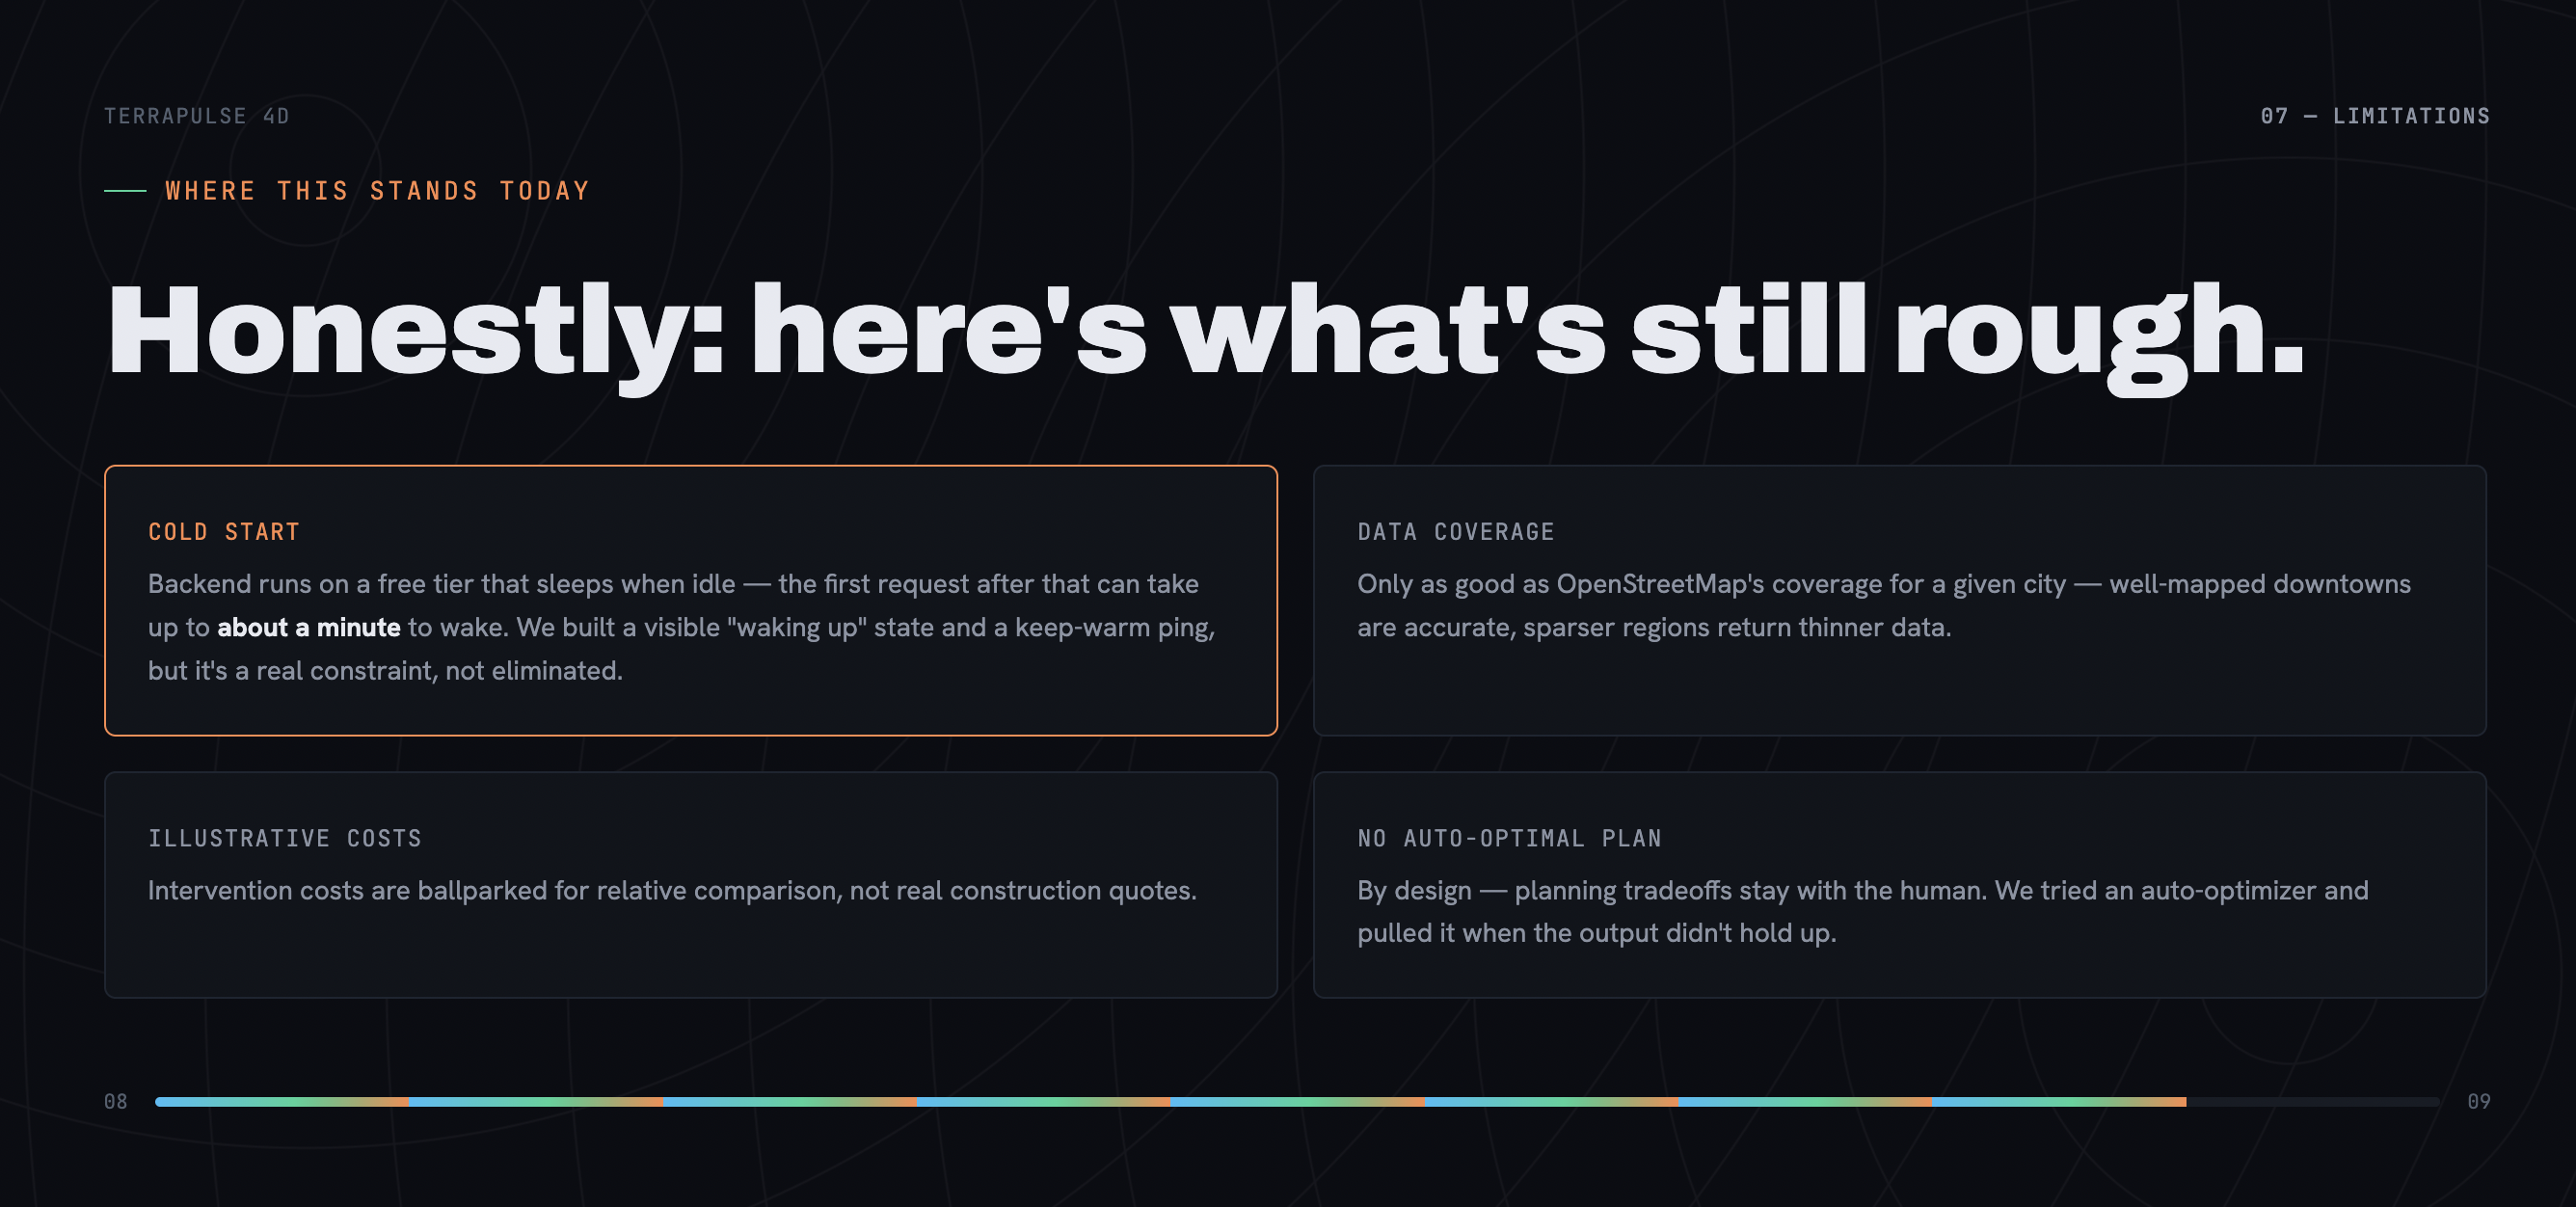
Building, then removing, an auto-optimizer. We built a budget-constrained greedy optimizer that could design an intervention plan from scratch. Getting it fast enough was its own project — profiling revealed the hydrology model's most expensive step (D8 flow accumulation) was being recomputed 11 times per run even though it only depends on elevation, a bug affecting every simulation, not just the optimizer. Fixing that plus a smarter scoring shortcut took it from 43 seconds down to a few. But when we reviewed the plans it actually produced, we didn't trust the output enough to ship it — so we pulled it, kept the performance fix (which still helps every run), and documented why for next time.
A free-tier backend that sleeps. Our host spins the backend down after ~15 minutes idle, and the first request after that can silently hang for up to a minute — or fail fast and repeatedly rather than hang once. We had to build a real bounded-retry UI state ("waking up the server…") rather than just hoping it wouldn't come up during a demo.
Accomplishments that we're proud of
- Real building geometry, not generic blocks — every structure is extruded from its true footprint polygon.
- A genuine three-tier resilience story for real-world data: live, then a real bundled snapshot, then procedural — never a blank or broken screen.
- Physics that's actually calibrated per place: Phoenix and Rotterdam behave differently because their real historical climate differs, not because of a label.
- Catching a real accessibility regression ourselves — hiding button text responsively also stripped it from the accessibility tree — and fixing it before it shipped.
- The discipline to remove a fully-working, fully-optimized feature because its output didn't meet our own bar, rather than ship it because it was already built.
What we learned
Resilience has to be designed in from the start, not bolted on — a real data pipeline needs more than one try/catch, and "never break the demo" only works if every layer has its own fallback. Small, strange-looking UI bugs often have root causes nowhere near where you'd guess (a grid pattern that turned out to be a CSS overlay, not the 3D shader). Profiling real data beats intuition — we assumed one feature would take a few seconds and it took 43, for a reason we'd never have guessed without measuring. And a deterministic fallback path deserves the same care as the AI-powered one, since you can't assume an API key will always be there.
What's next for TerraPulse 4D
- Vector road centerlines instead of rasterized tiles, for smoother street geometry.
- An equity/exposure overlay weighting heat and flood impact by real population density, not just raw temperature.
- A storm-severity / return-period slider to show how a plan holds up under a worse climate future.
- Revisiting the auto-optimizer with a fundamentally re-examined scoring approach, not just a re-implementation.
- One-click PNG/PDF export of a plan, its metrics, and its cost.
- Free-form location search beyond the 4 built-in presets.
Built With
- docker
- fastapi
- github
- next.js
- numpy
- openstreetmap
- python
- react
- shadcn
- tailwind
- three.js
- typescript
- vercel
- zustand

Log in or sign up for Devpost to join the conversation.