-
-
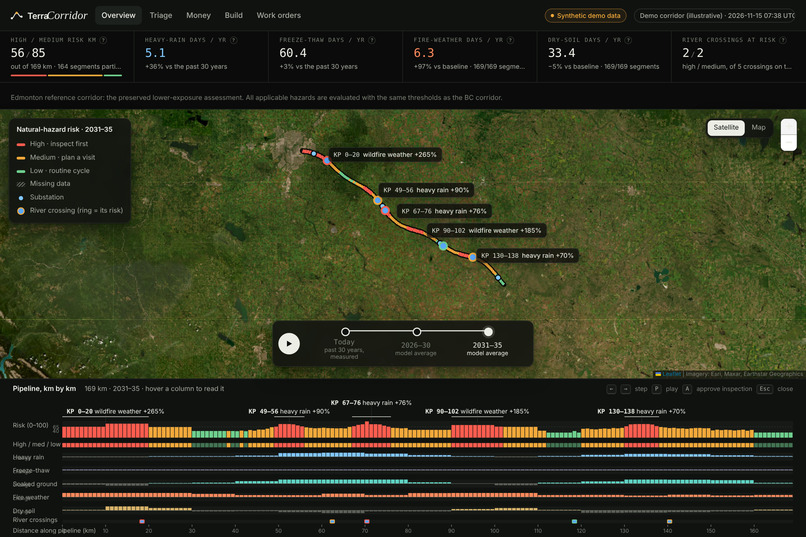
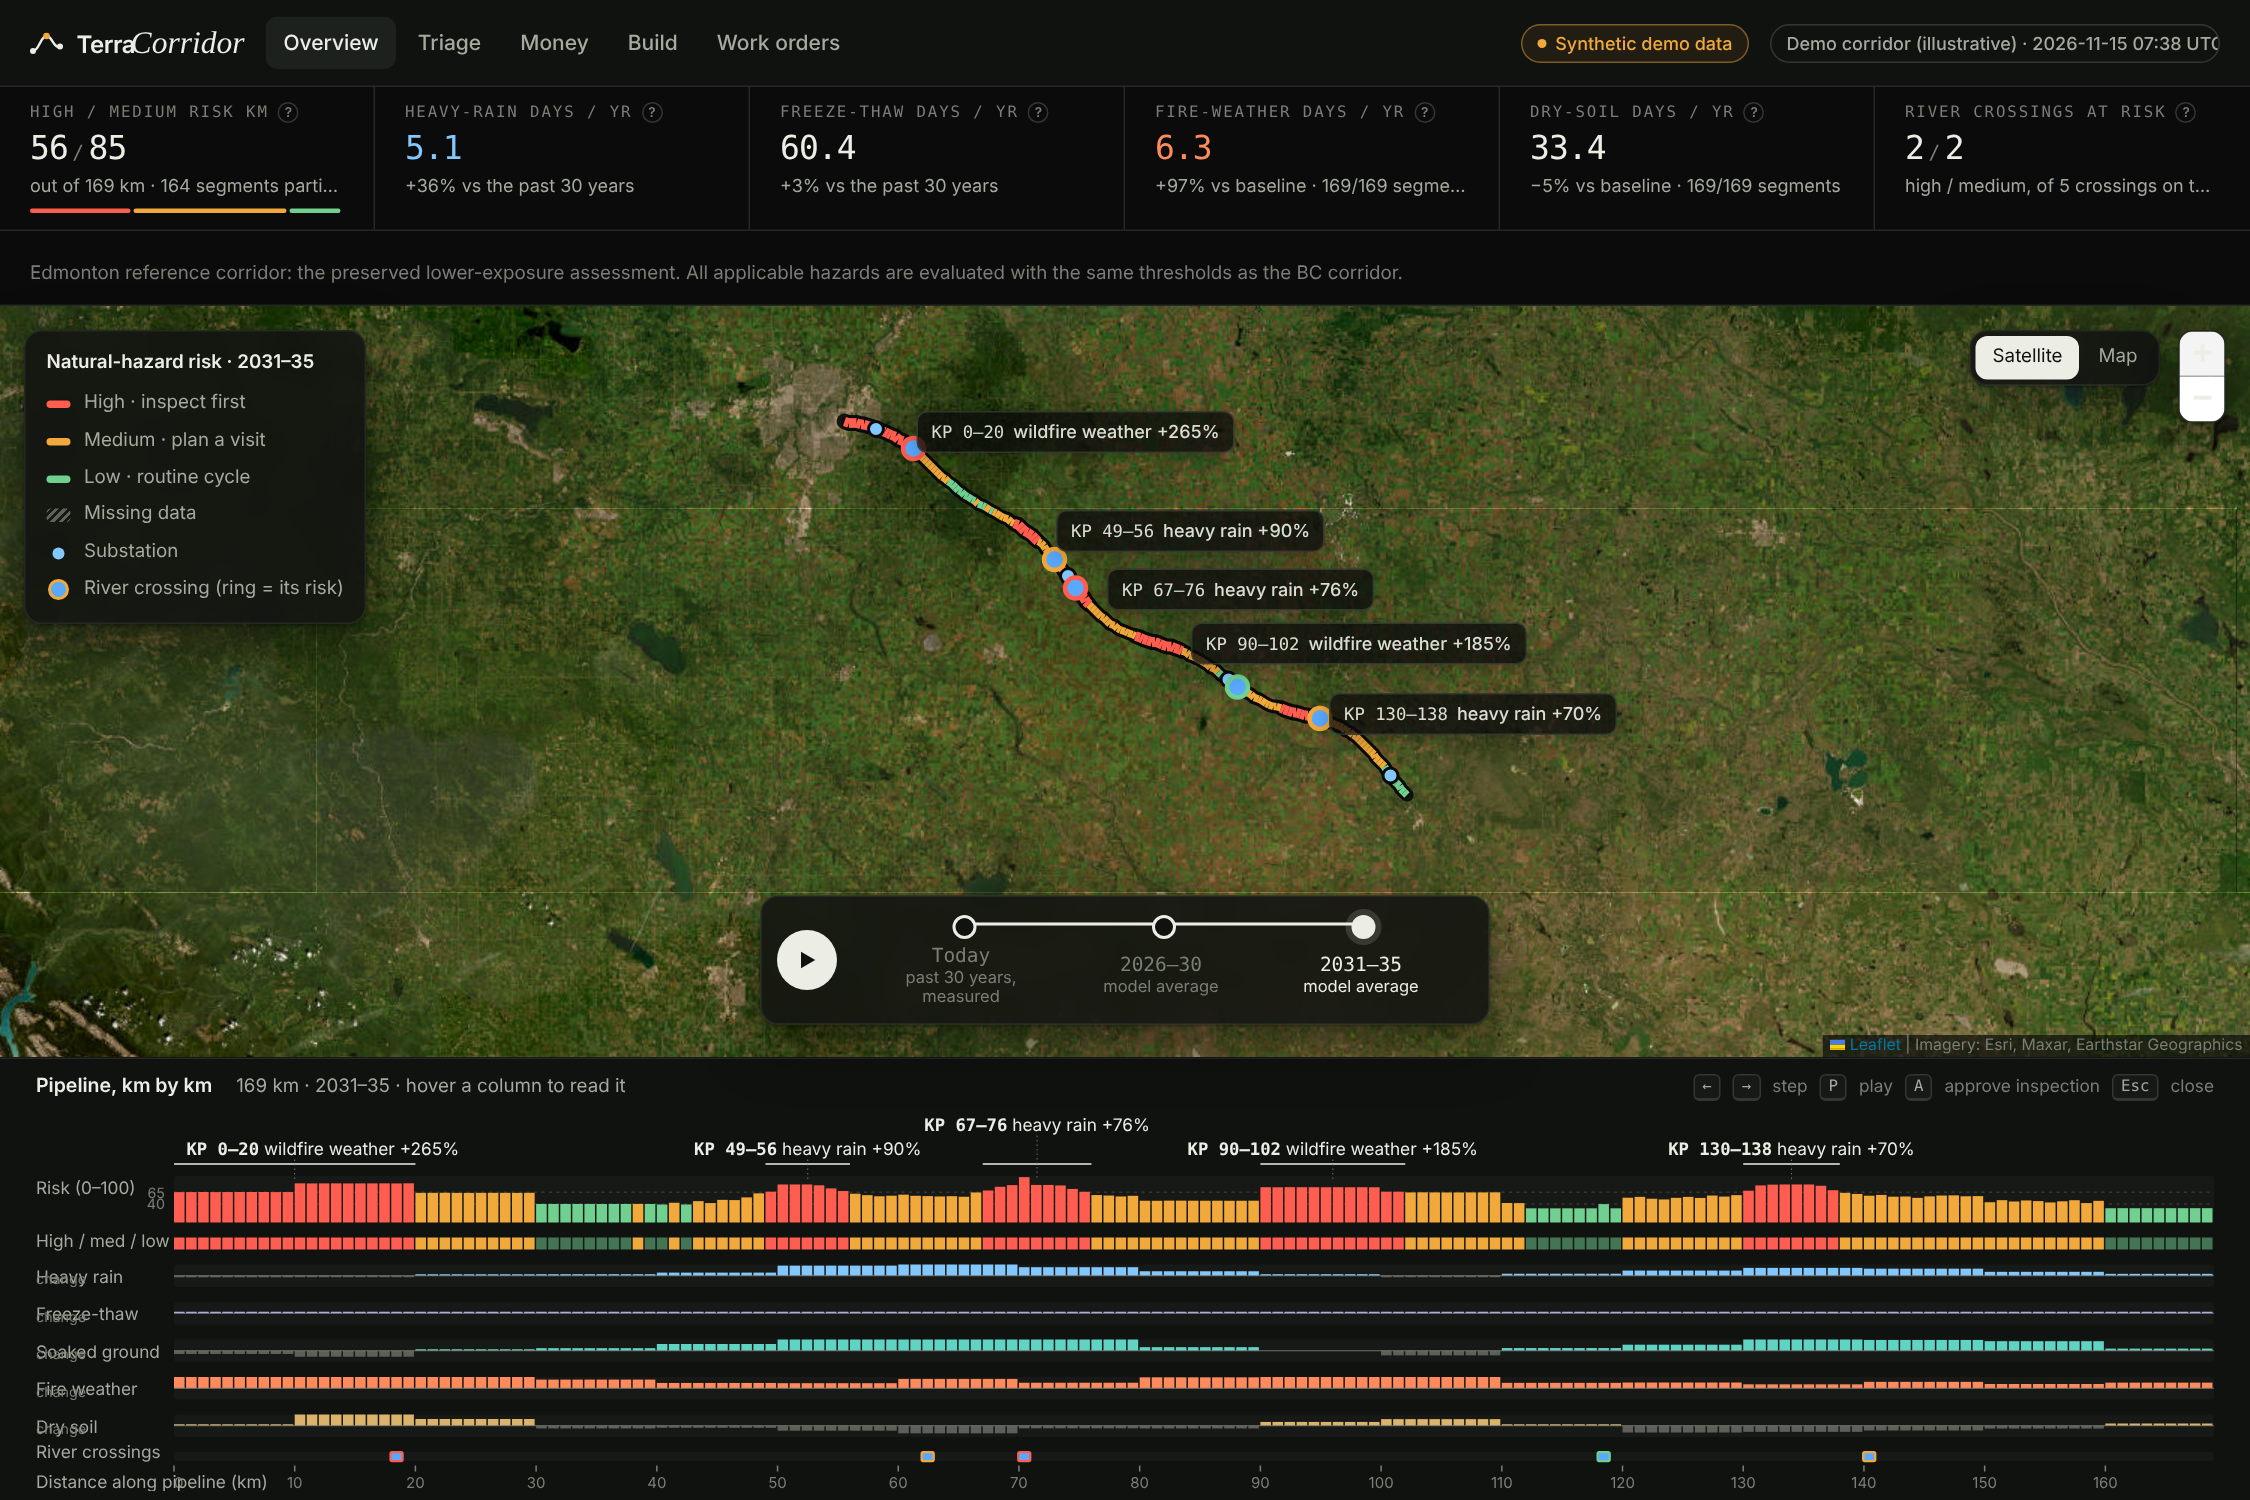
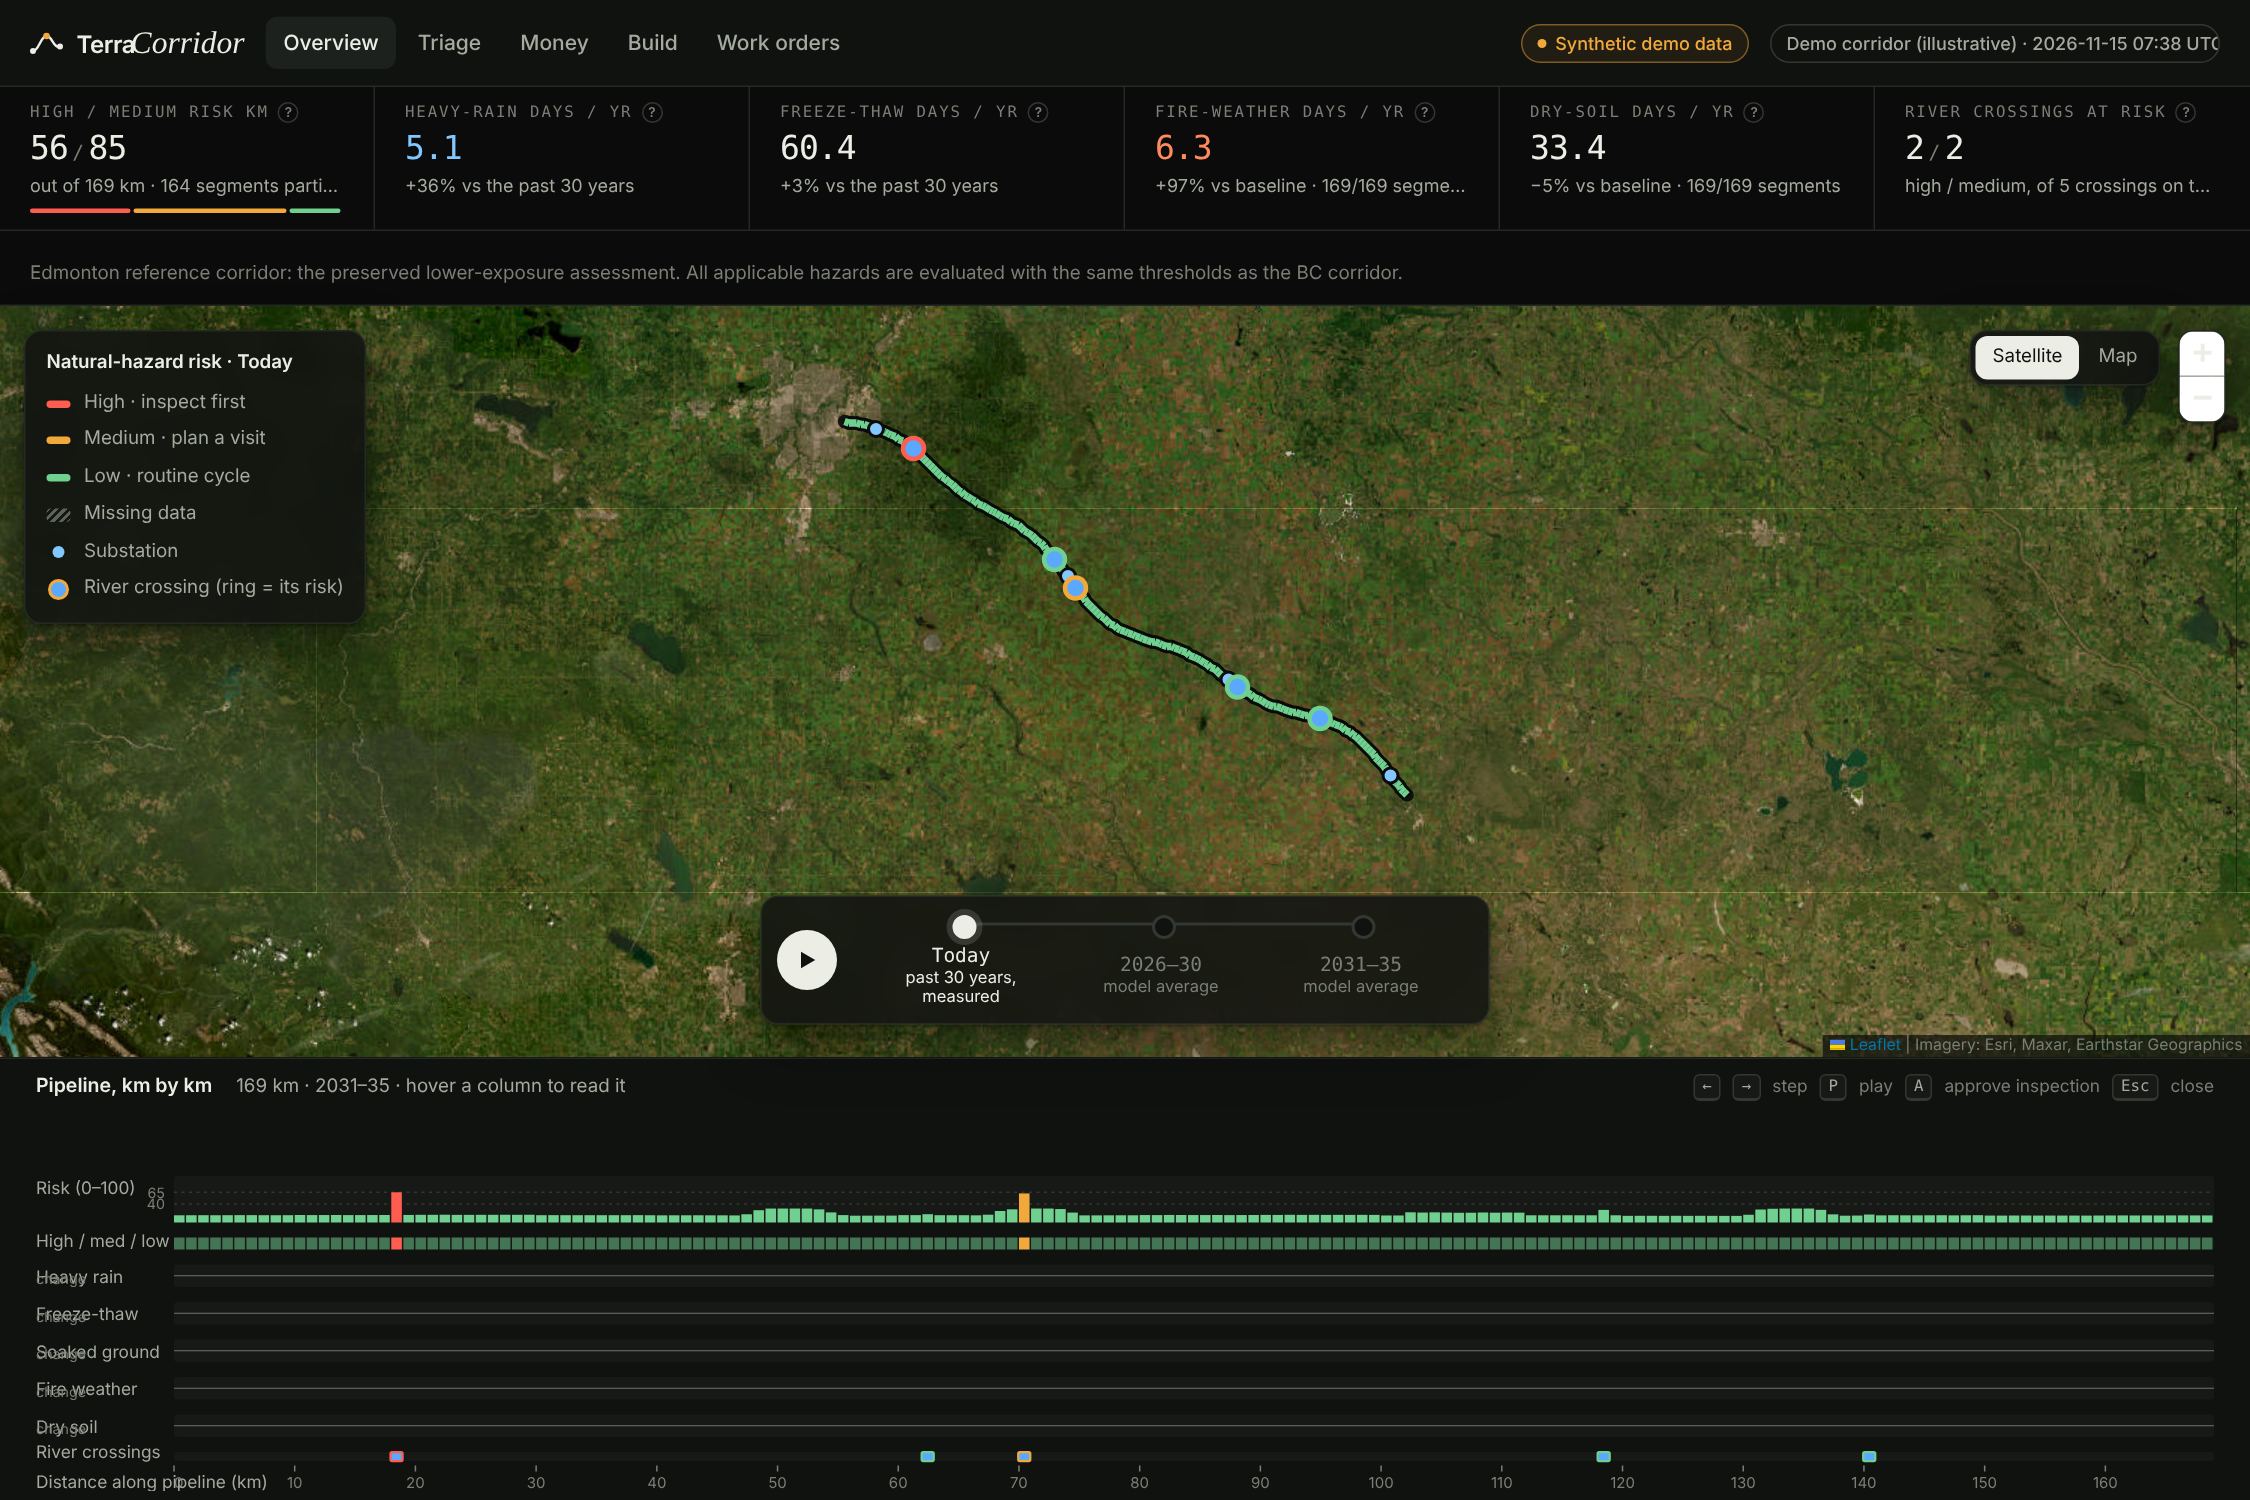
Mapping current climate hazards across a 169 km pipeline corridor using 30 years of historical weather data.
-
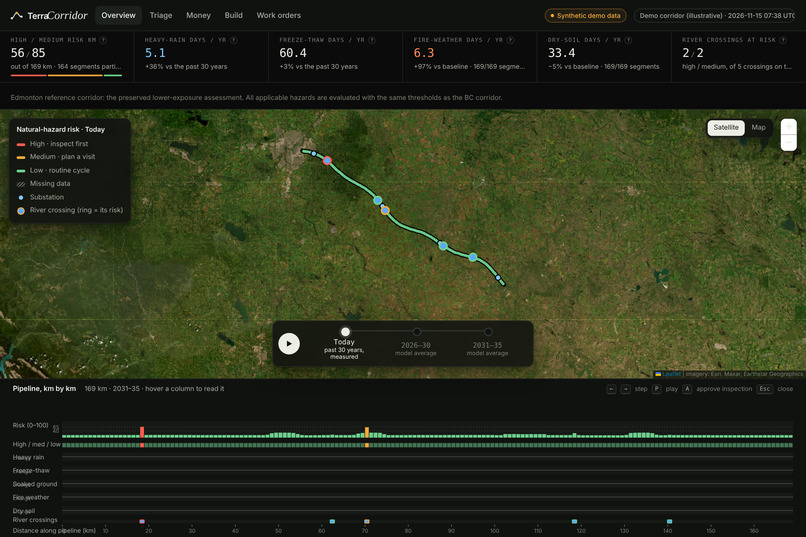
Watch climate risks evolve through 2035 as projected rainfall, wildfire weather, and drought reshape pipeline vulnerability.
-
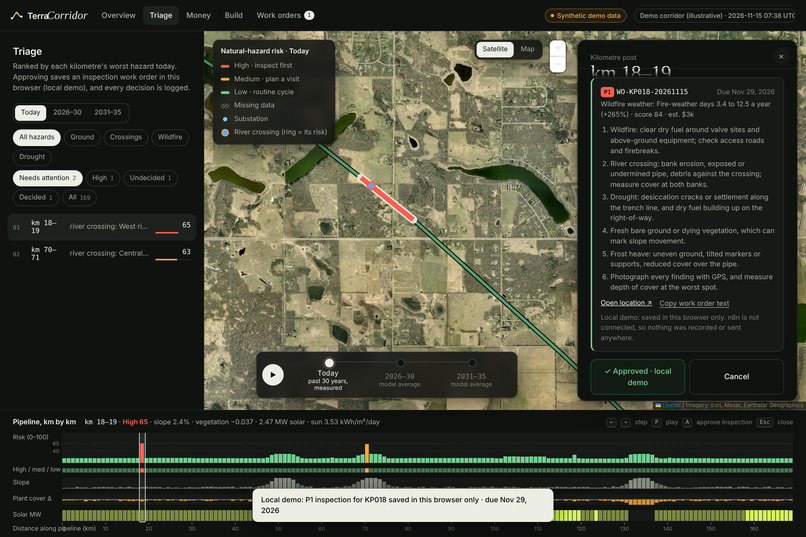
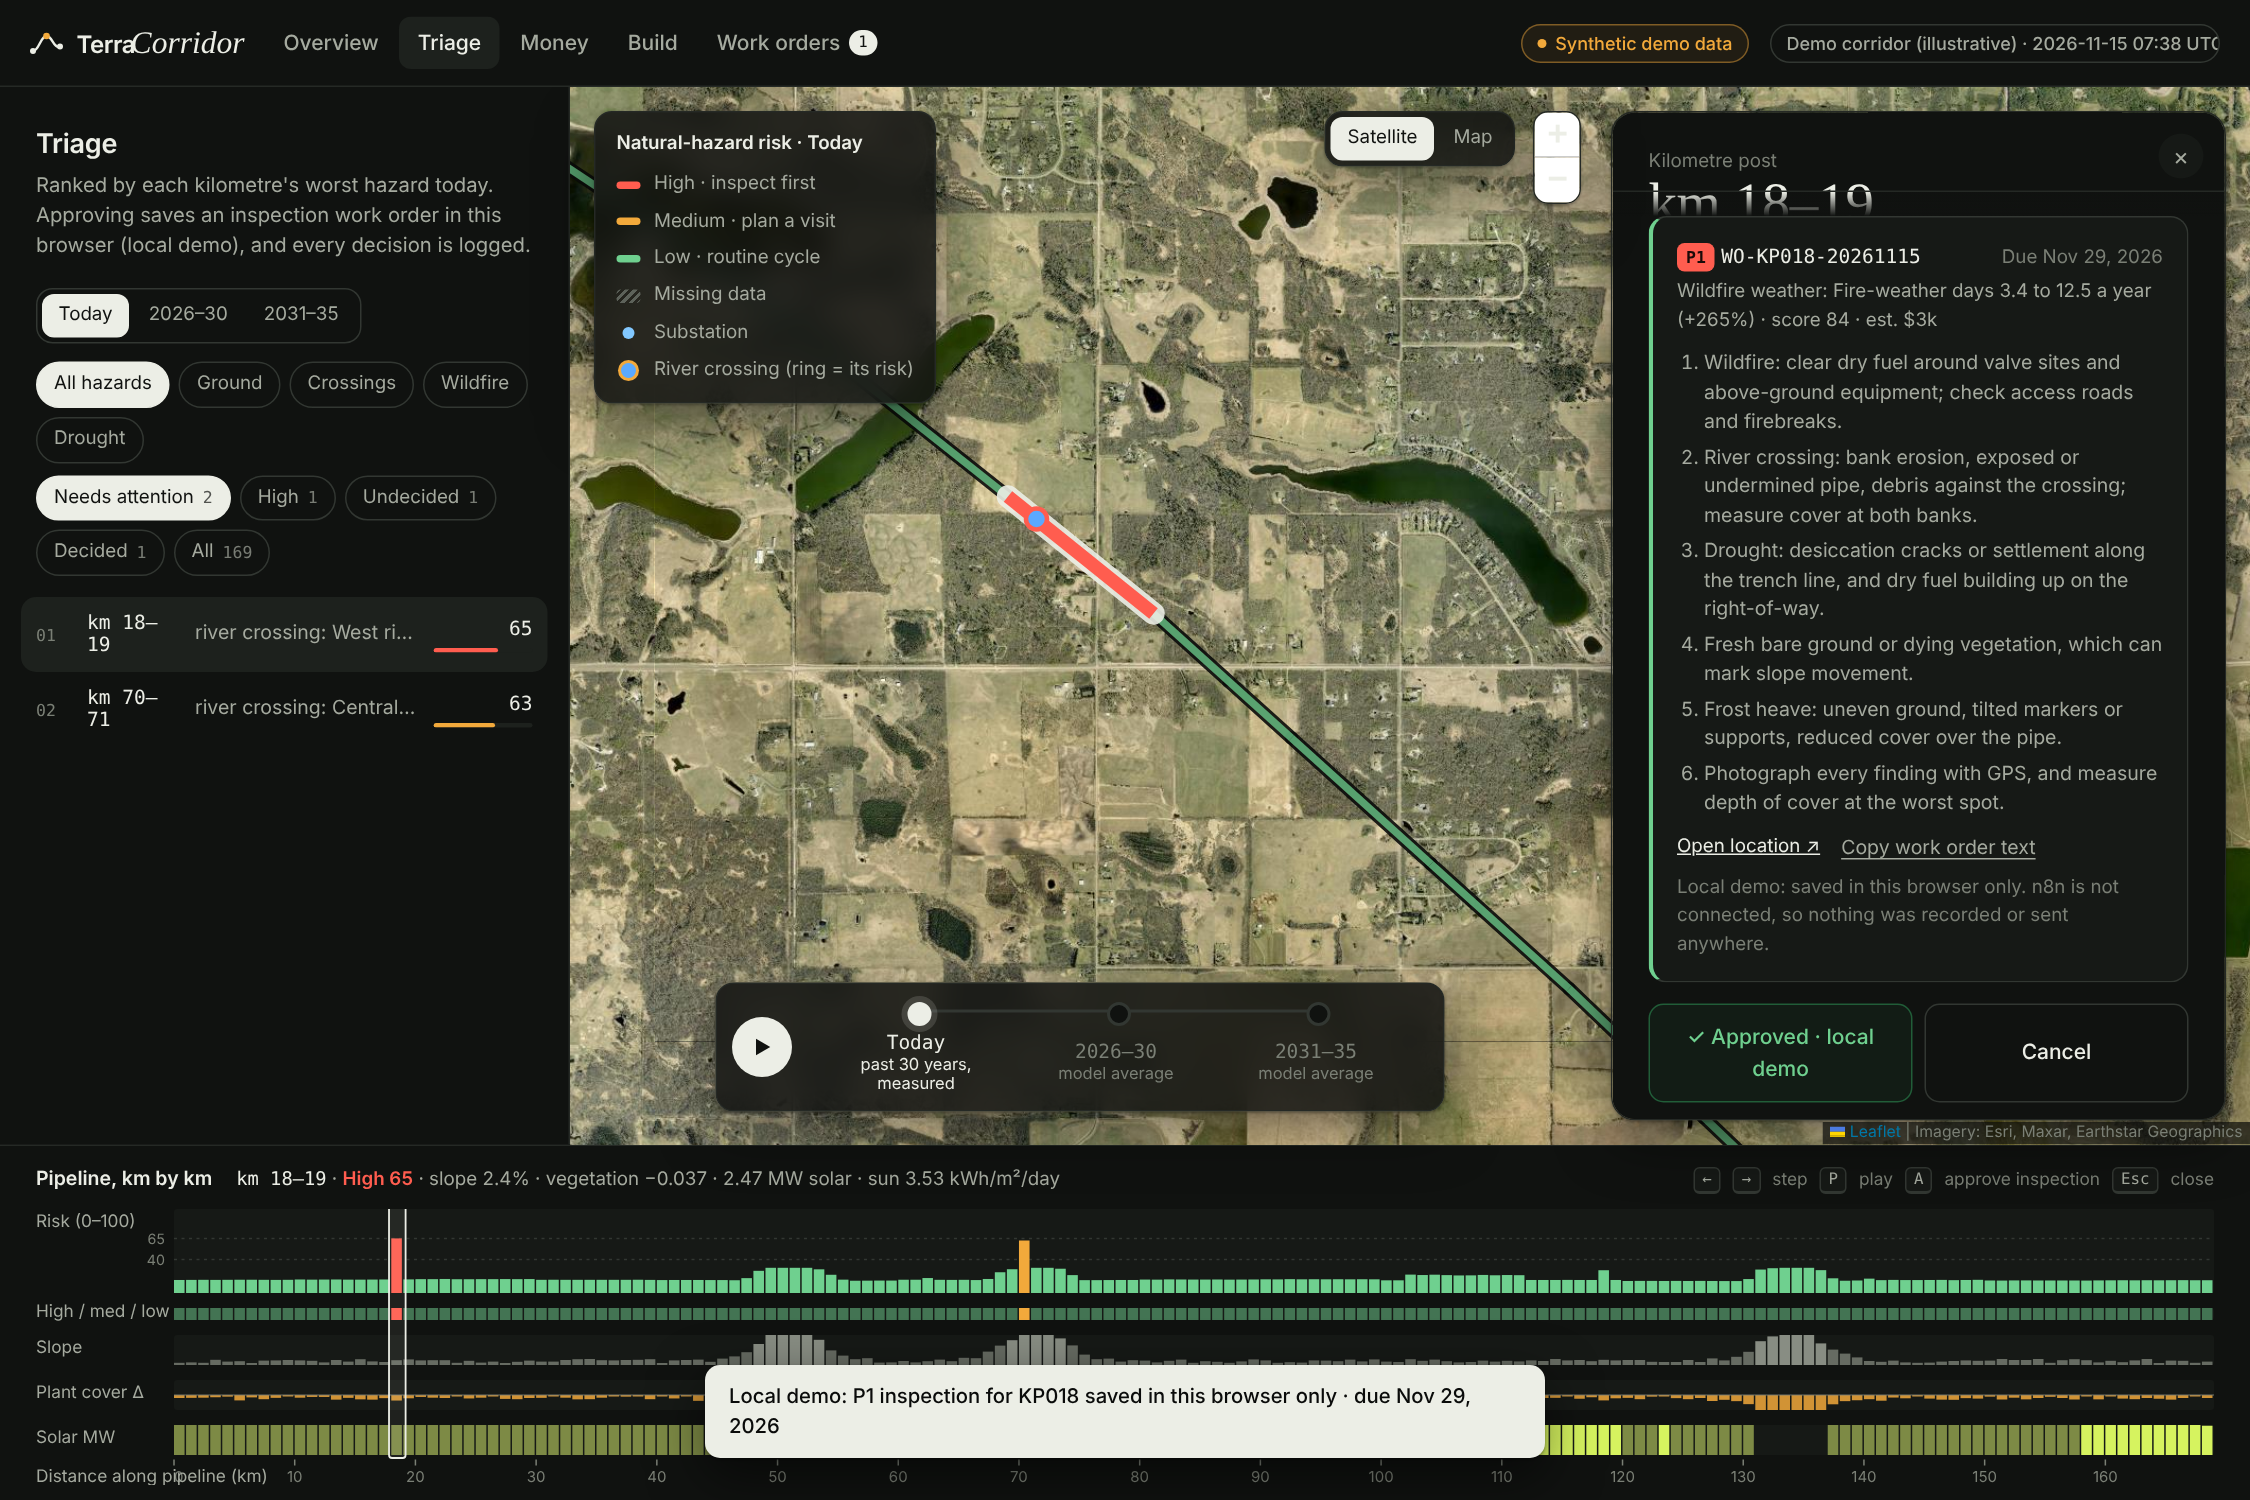
From risk to action: prioritize vulnerable segments and approve targeted inspections with clear checklists and deadlines.
-
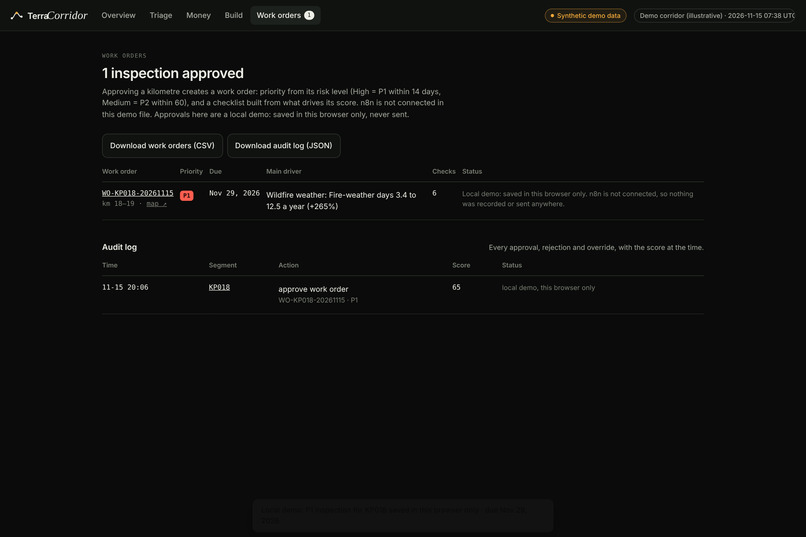
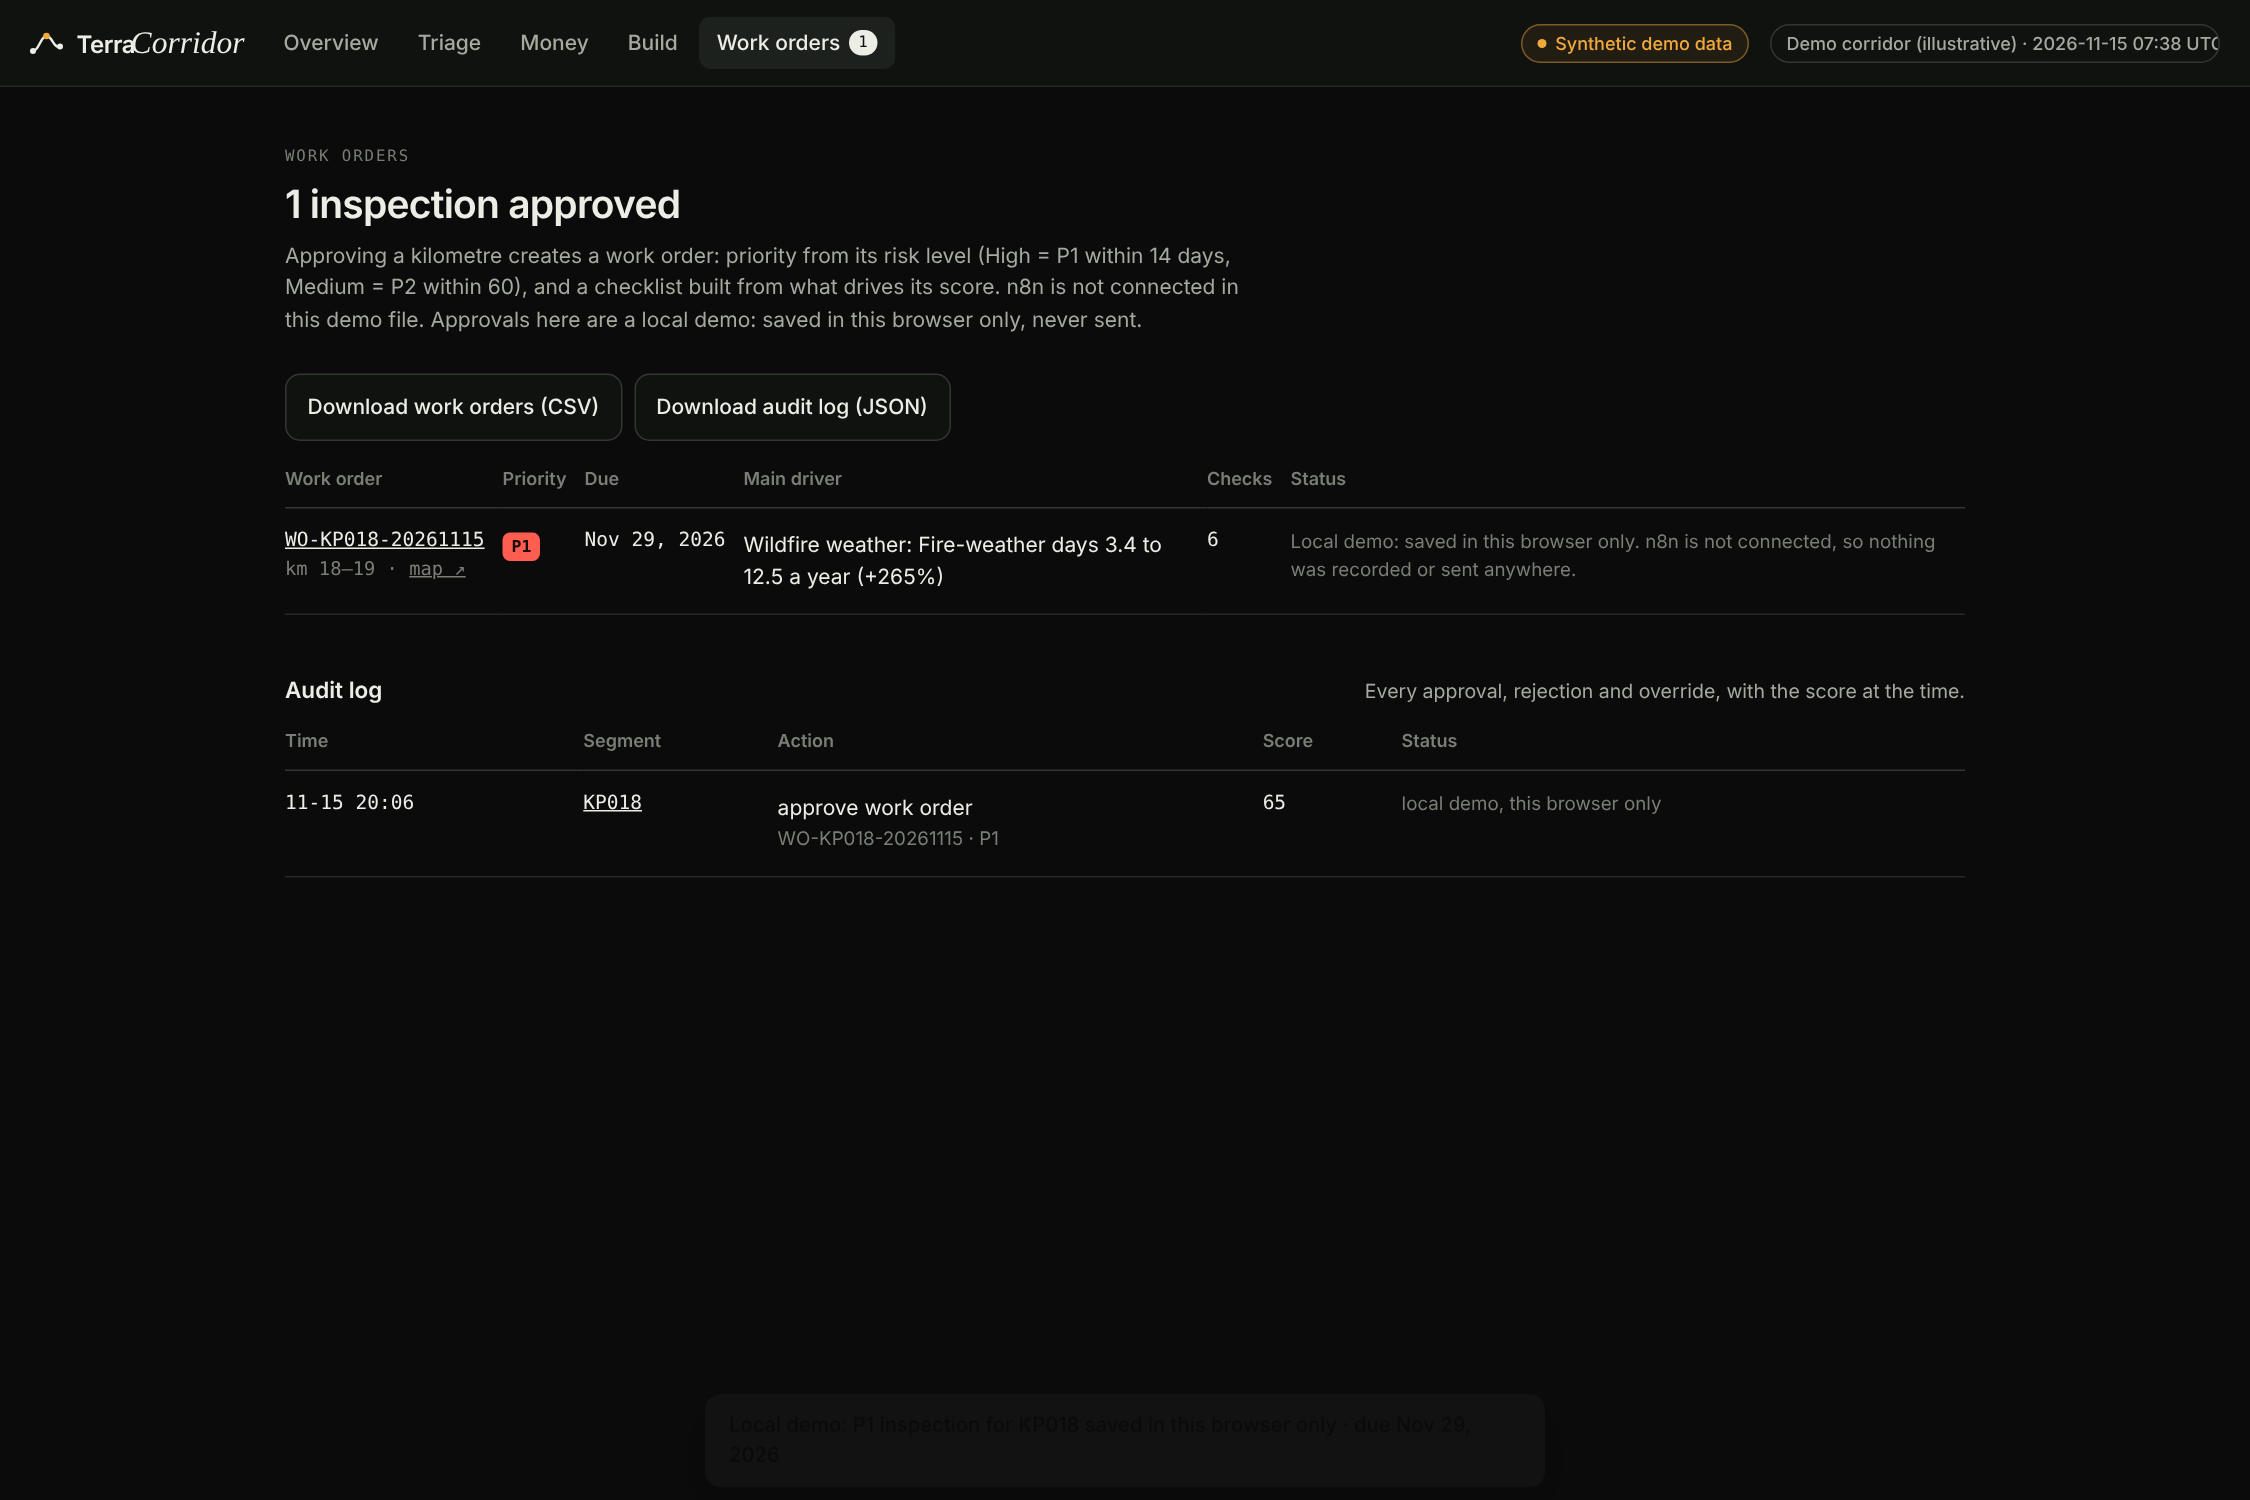
Approved inspections become trackable work orders with priorities, due dates, and downloadable audit trails.
-
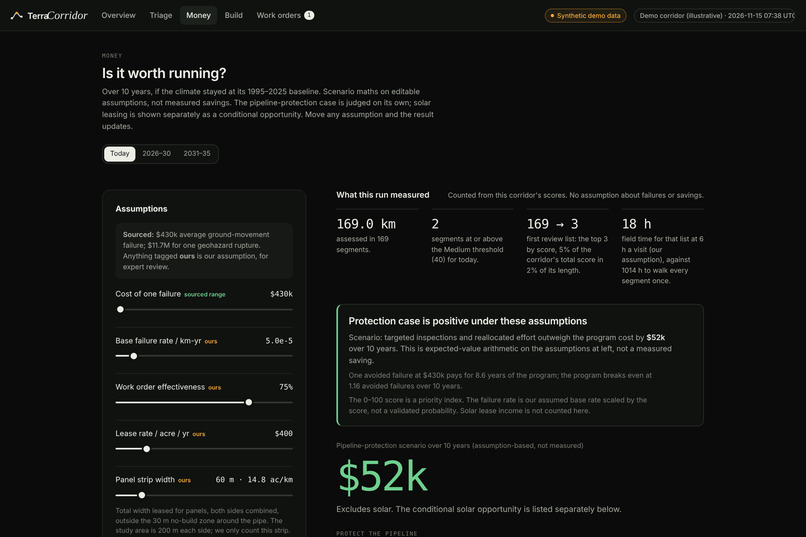
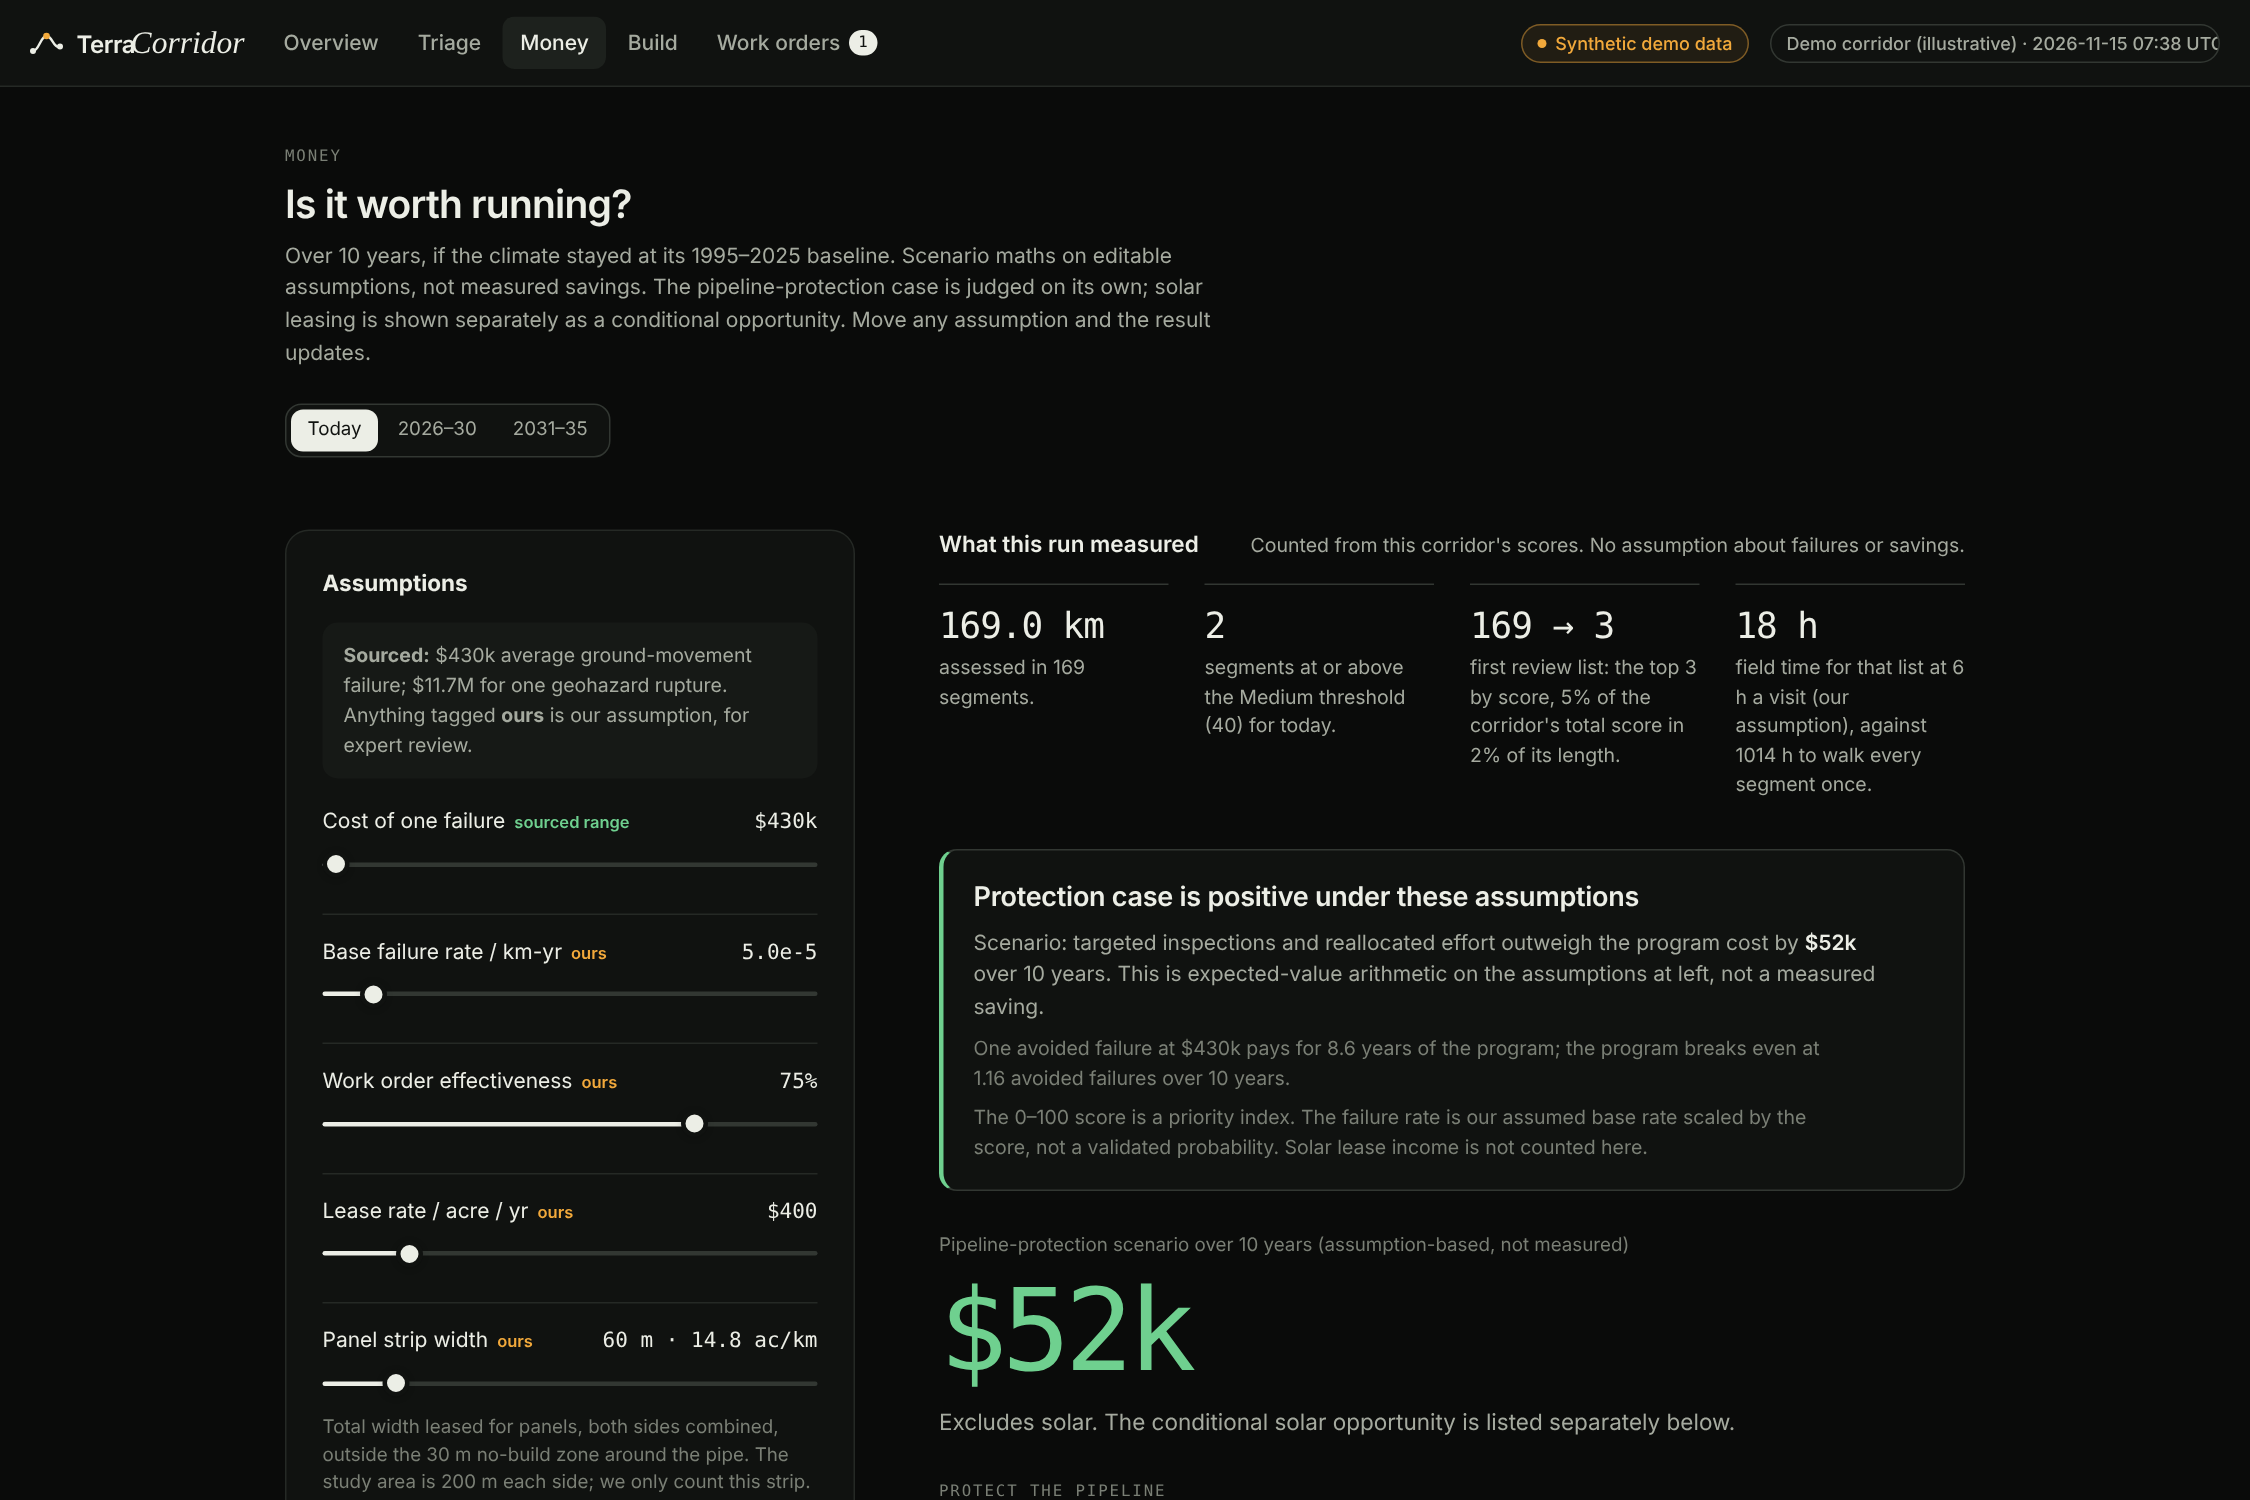
Turning climate resilience into financial decisions with transparent cost assumptions and projected savings.
-
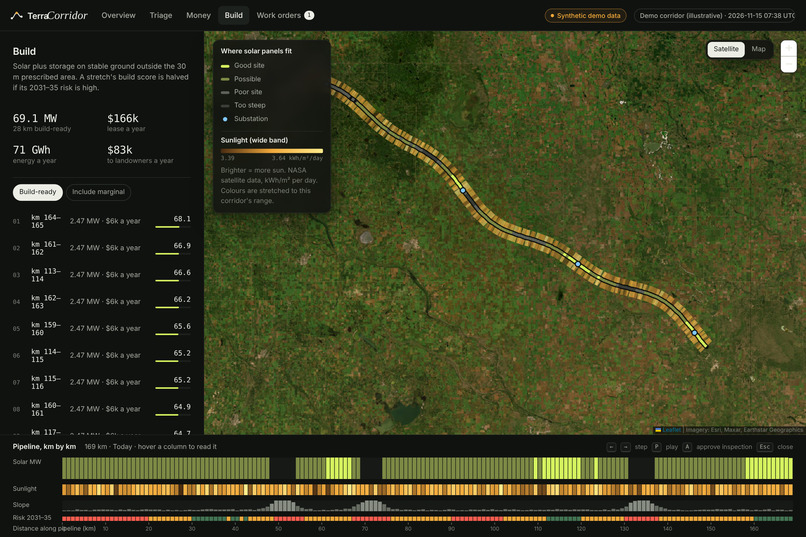
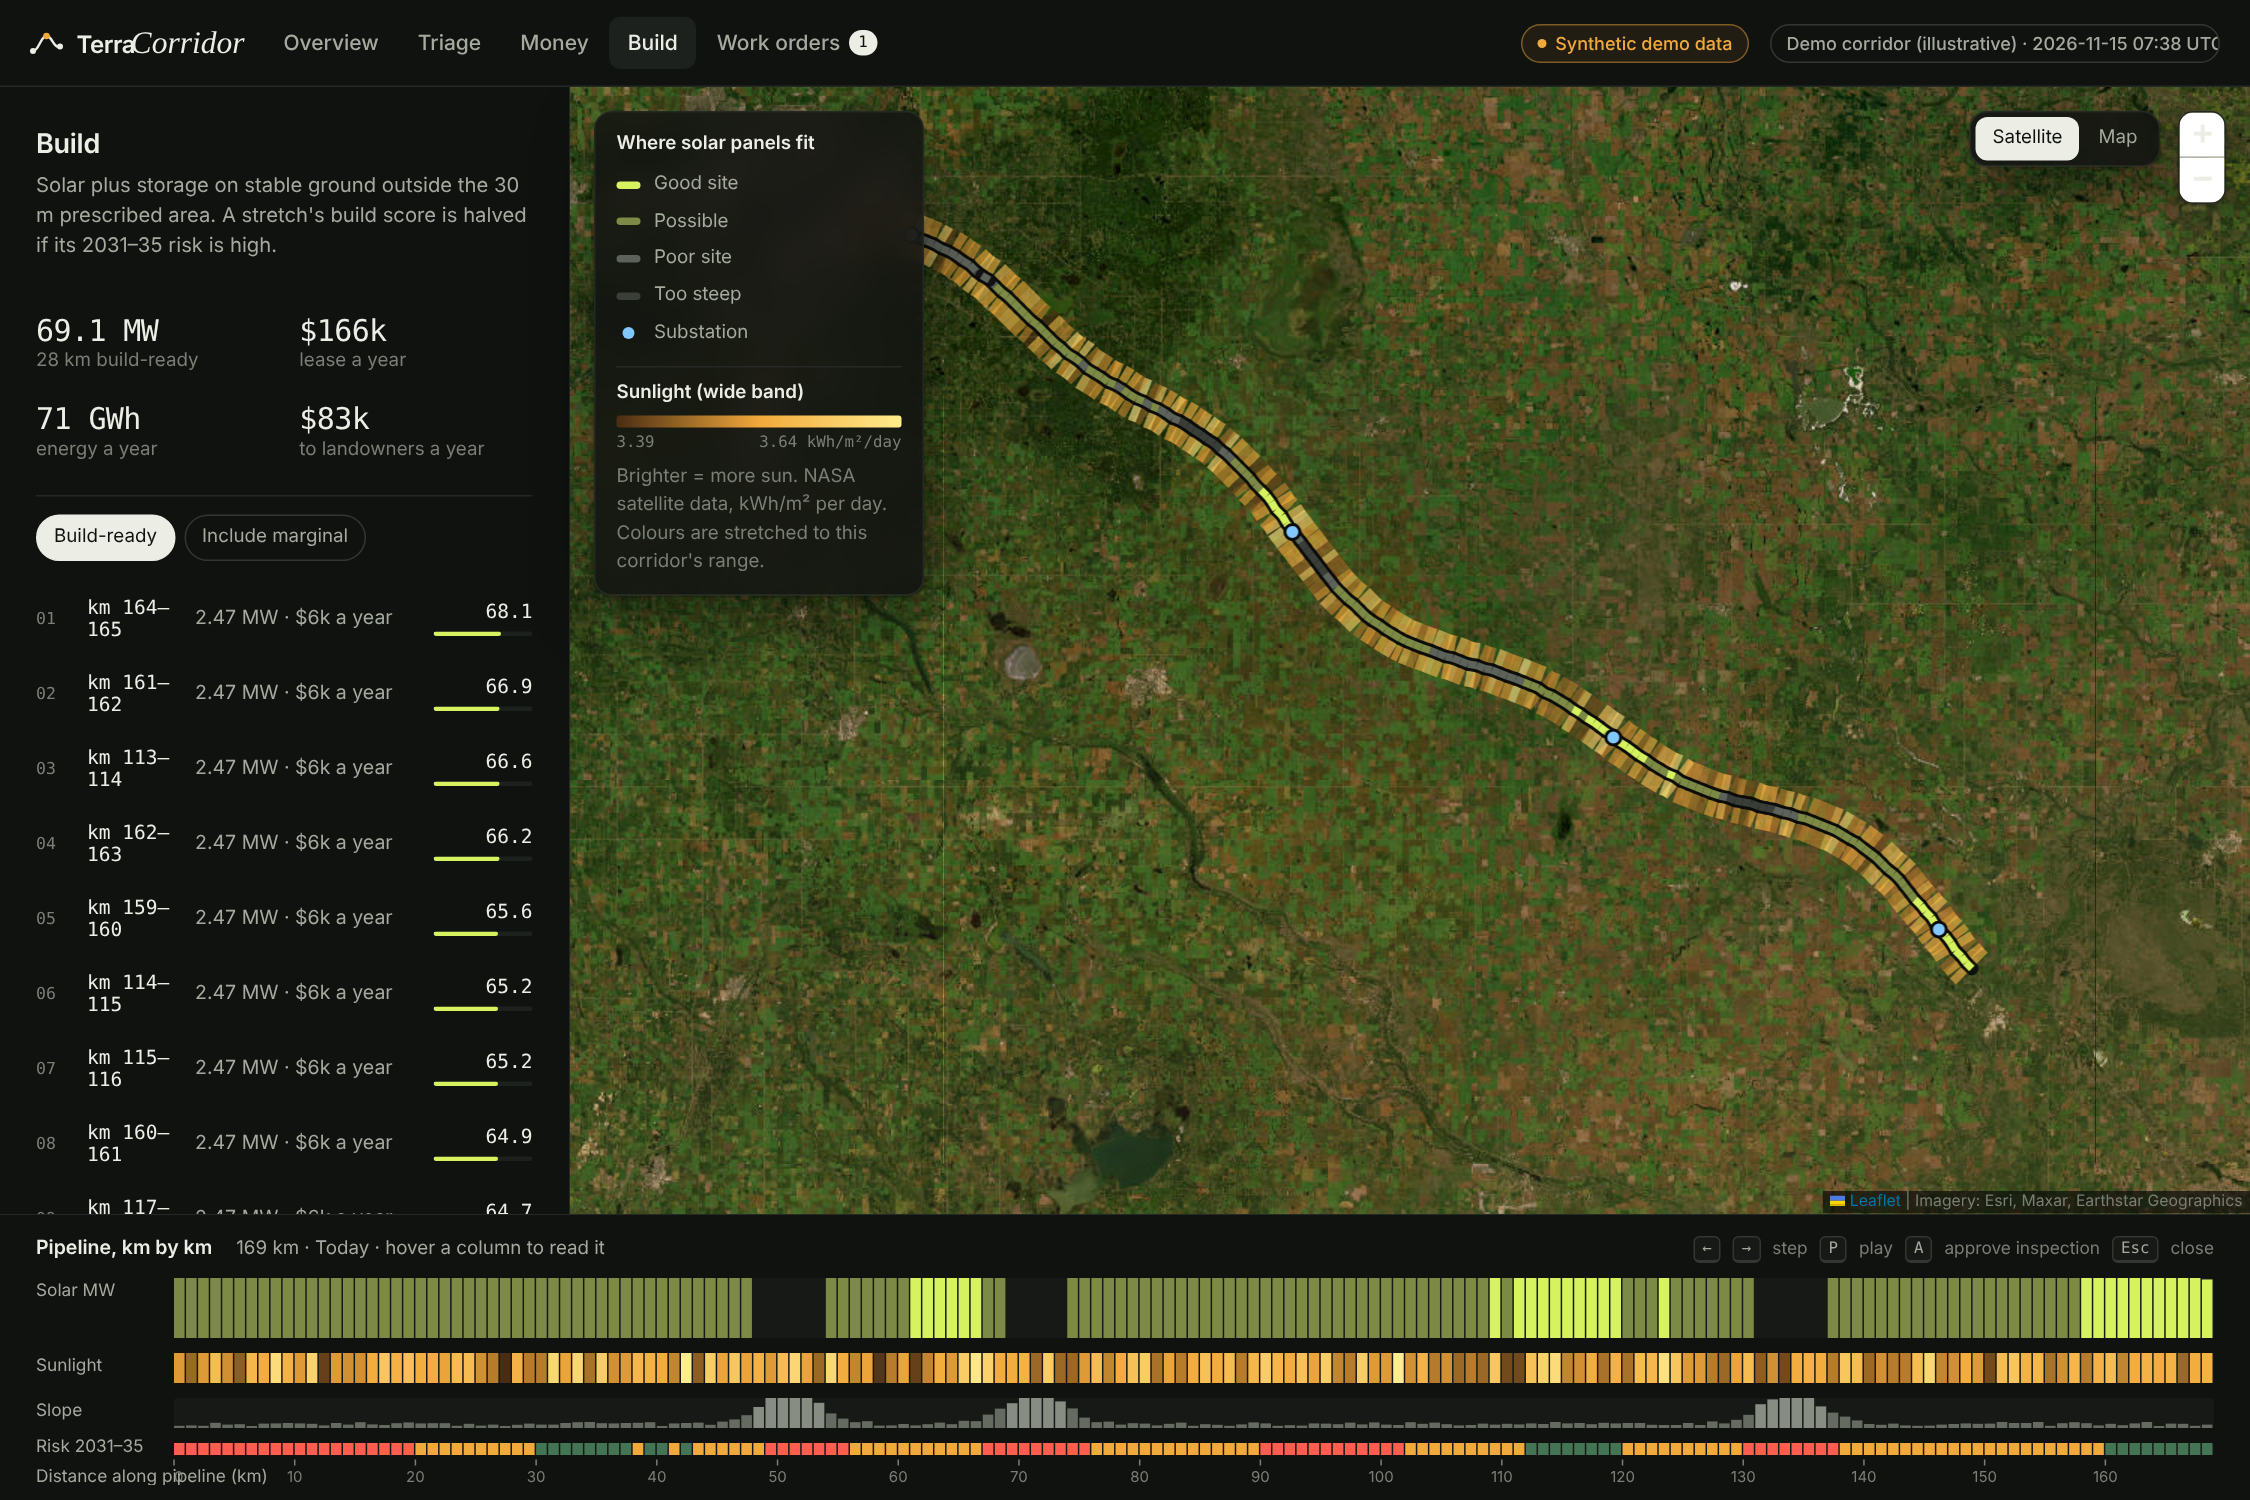
Identifying stable corridor land for potential solar development, with estimated energy generation and lease revenue.
-
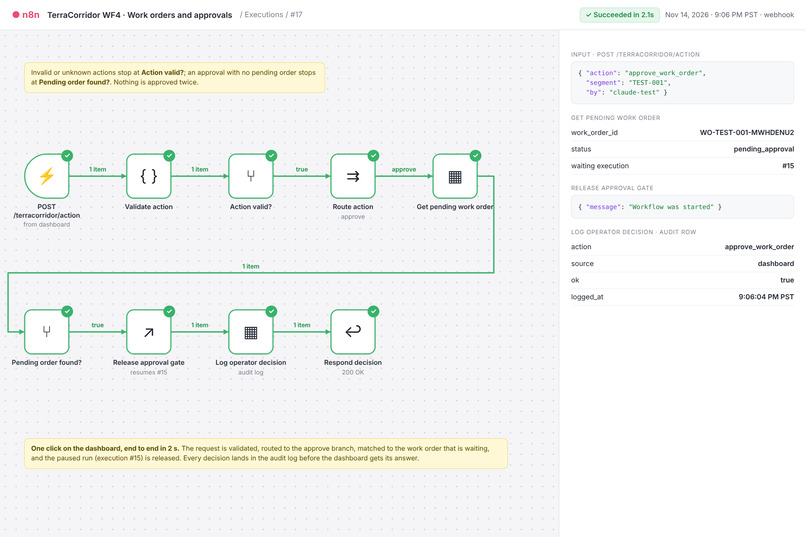
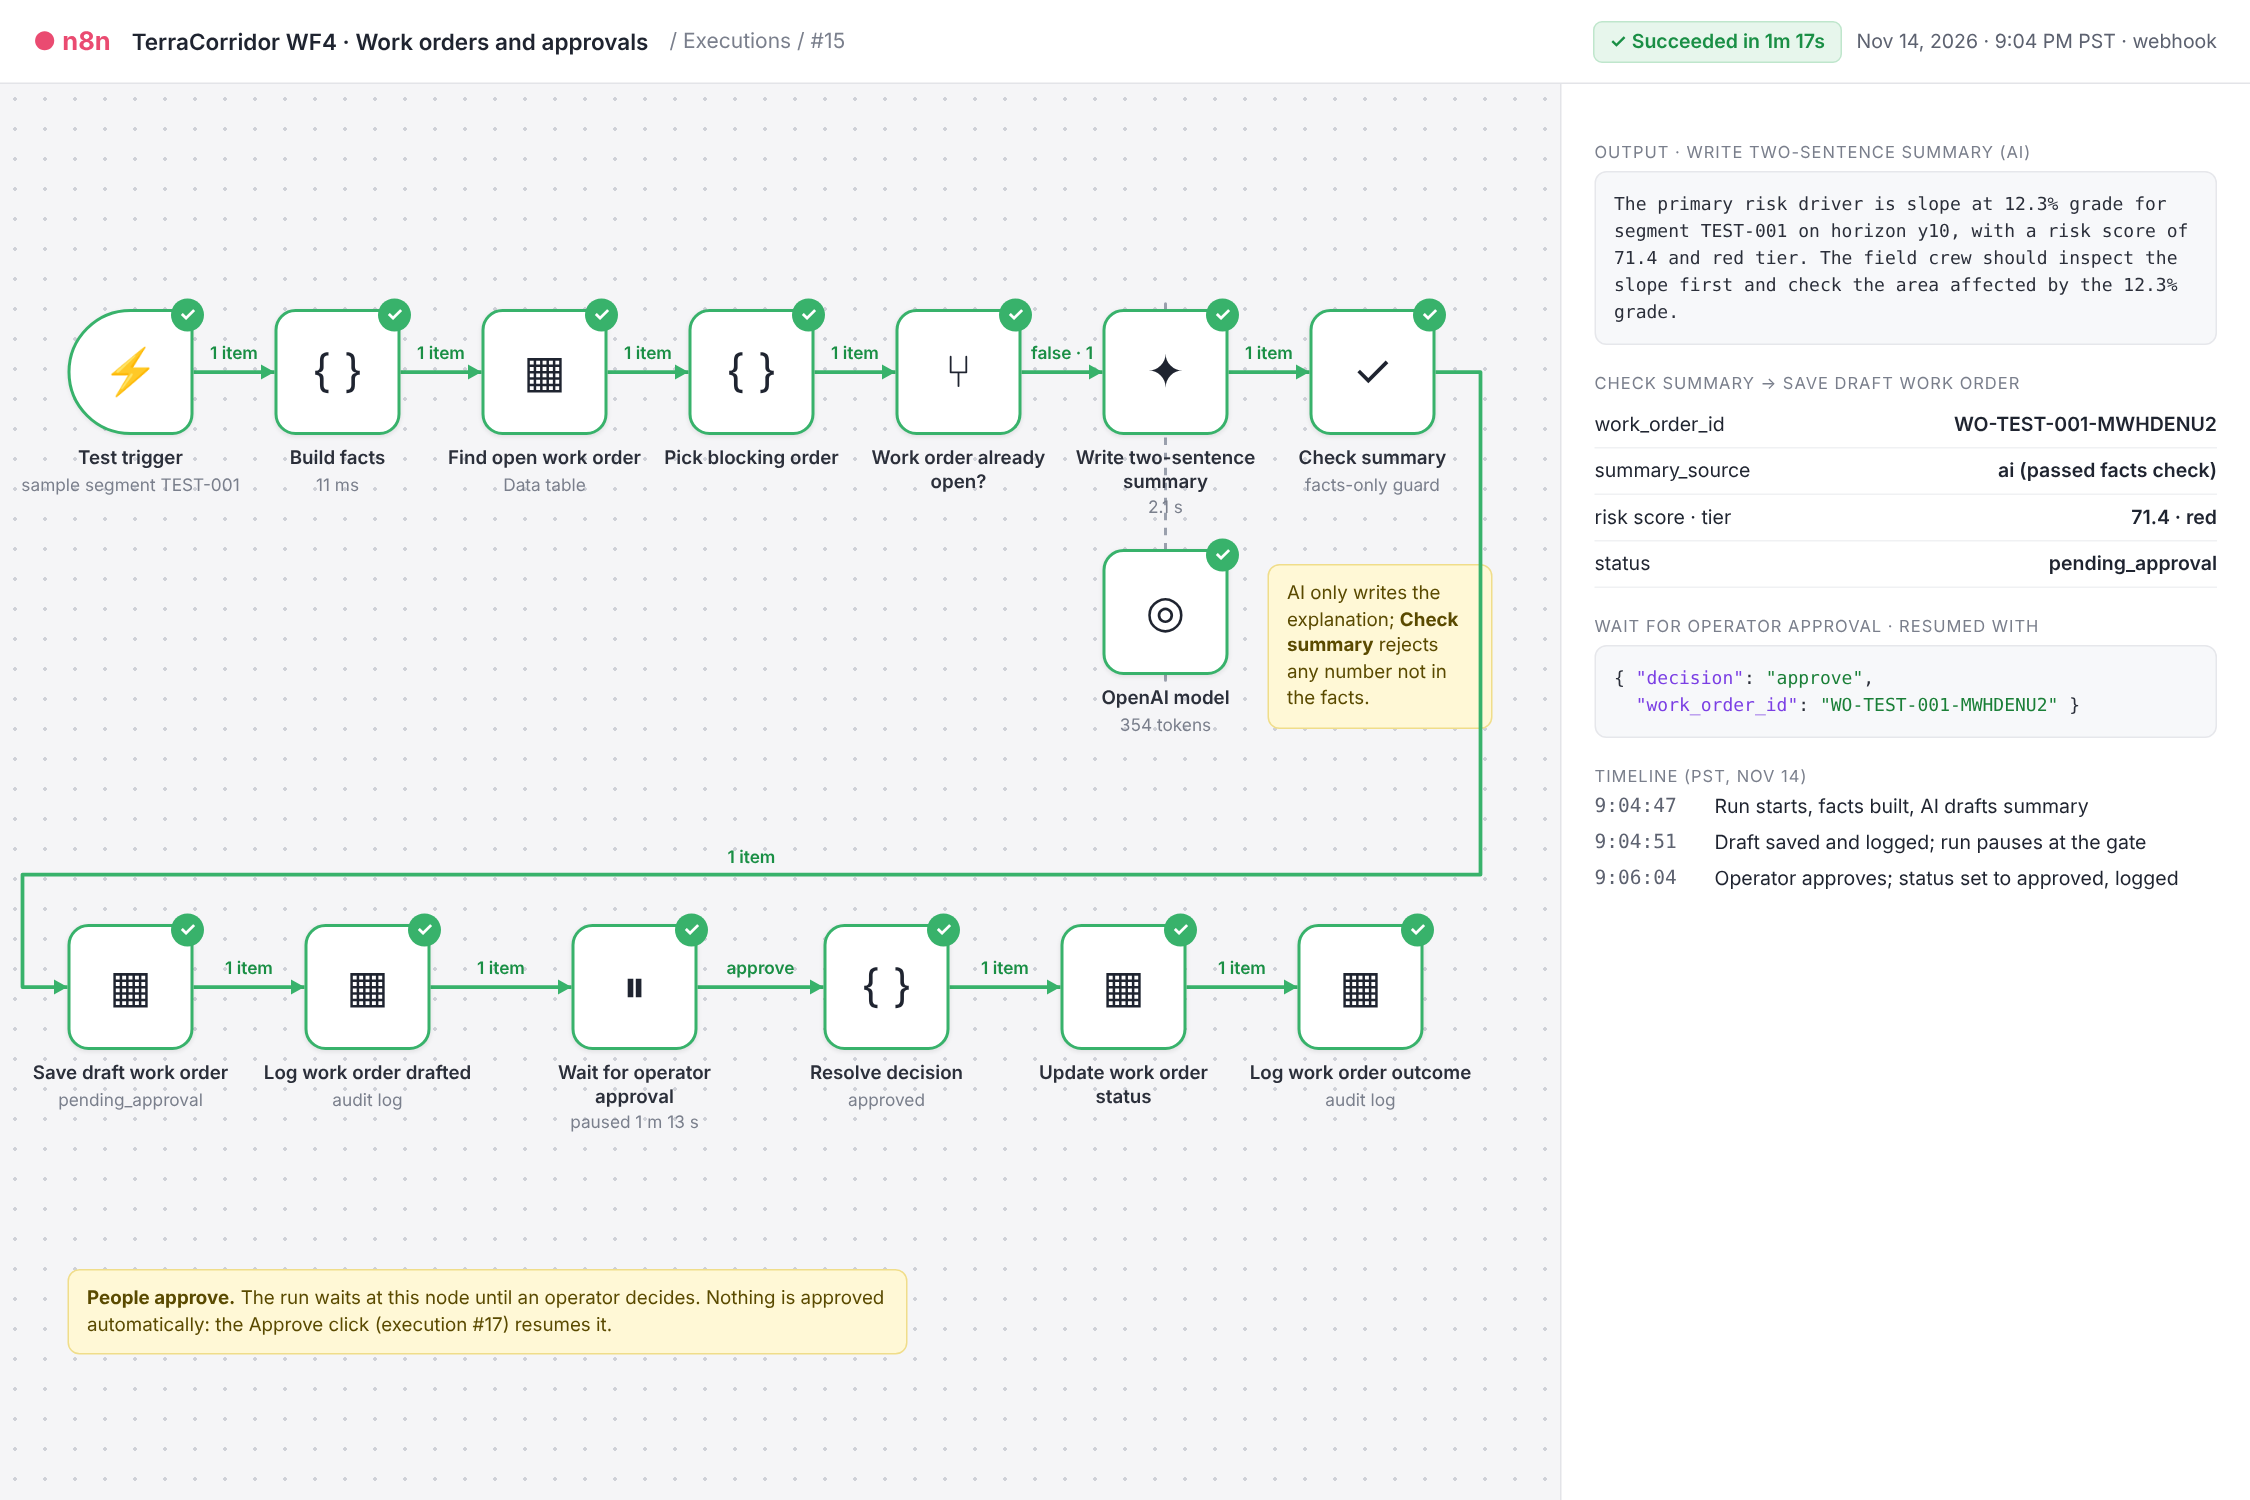
n8n drafts evidence-based work orders, pauses for human approval, and records every decision.
-
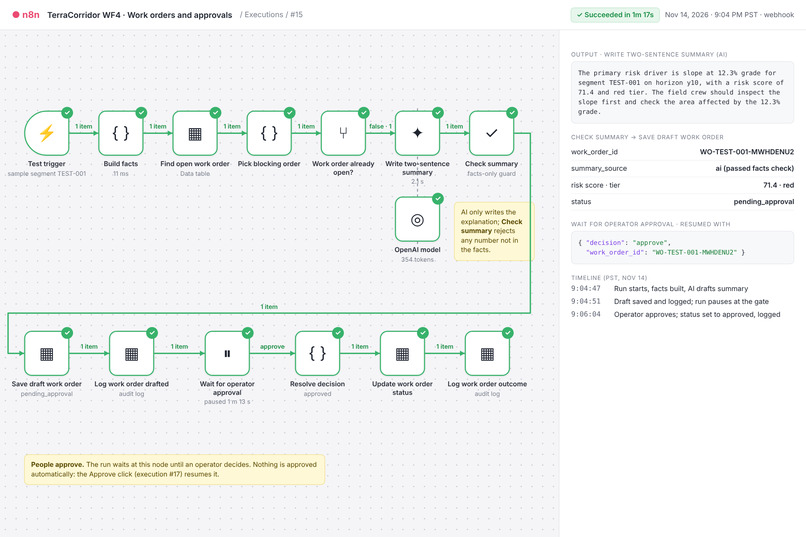
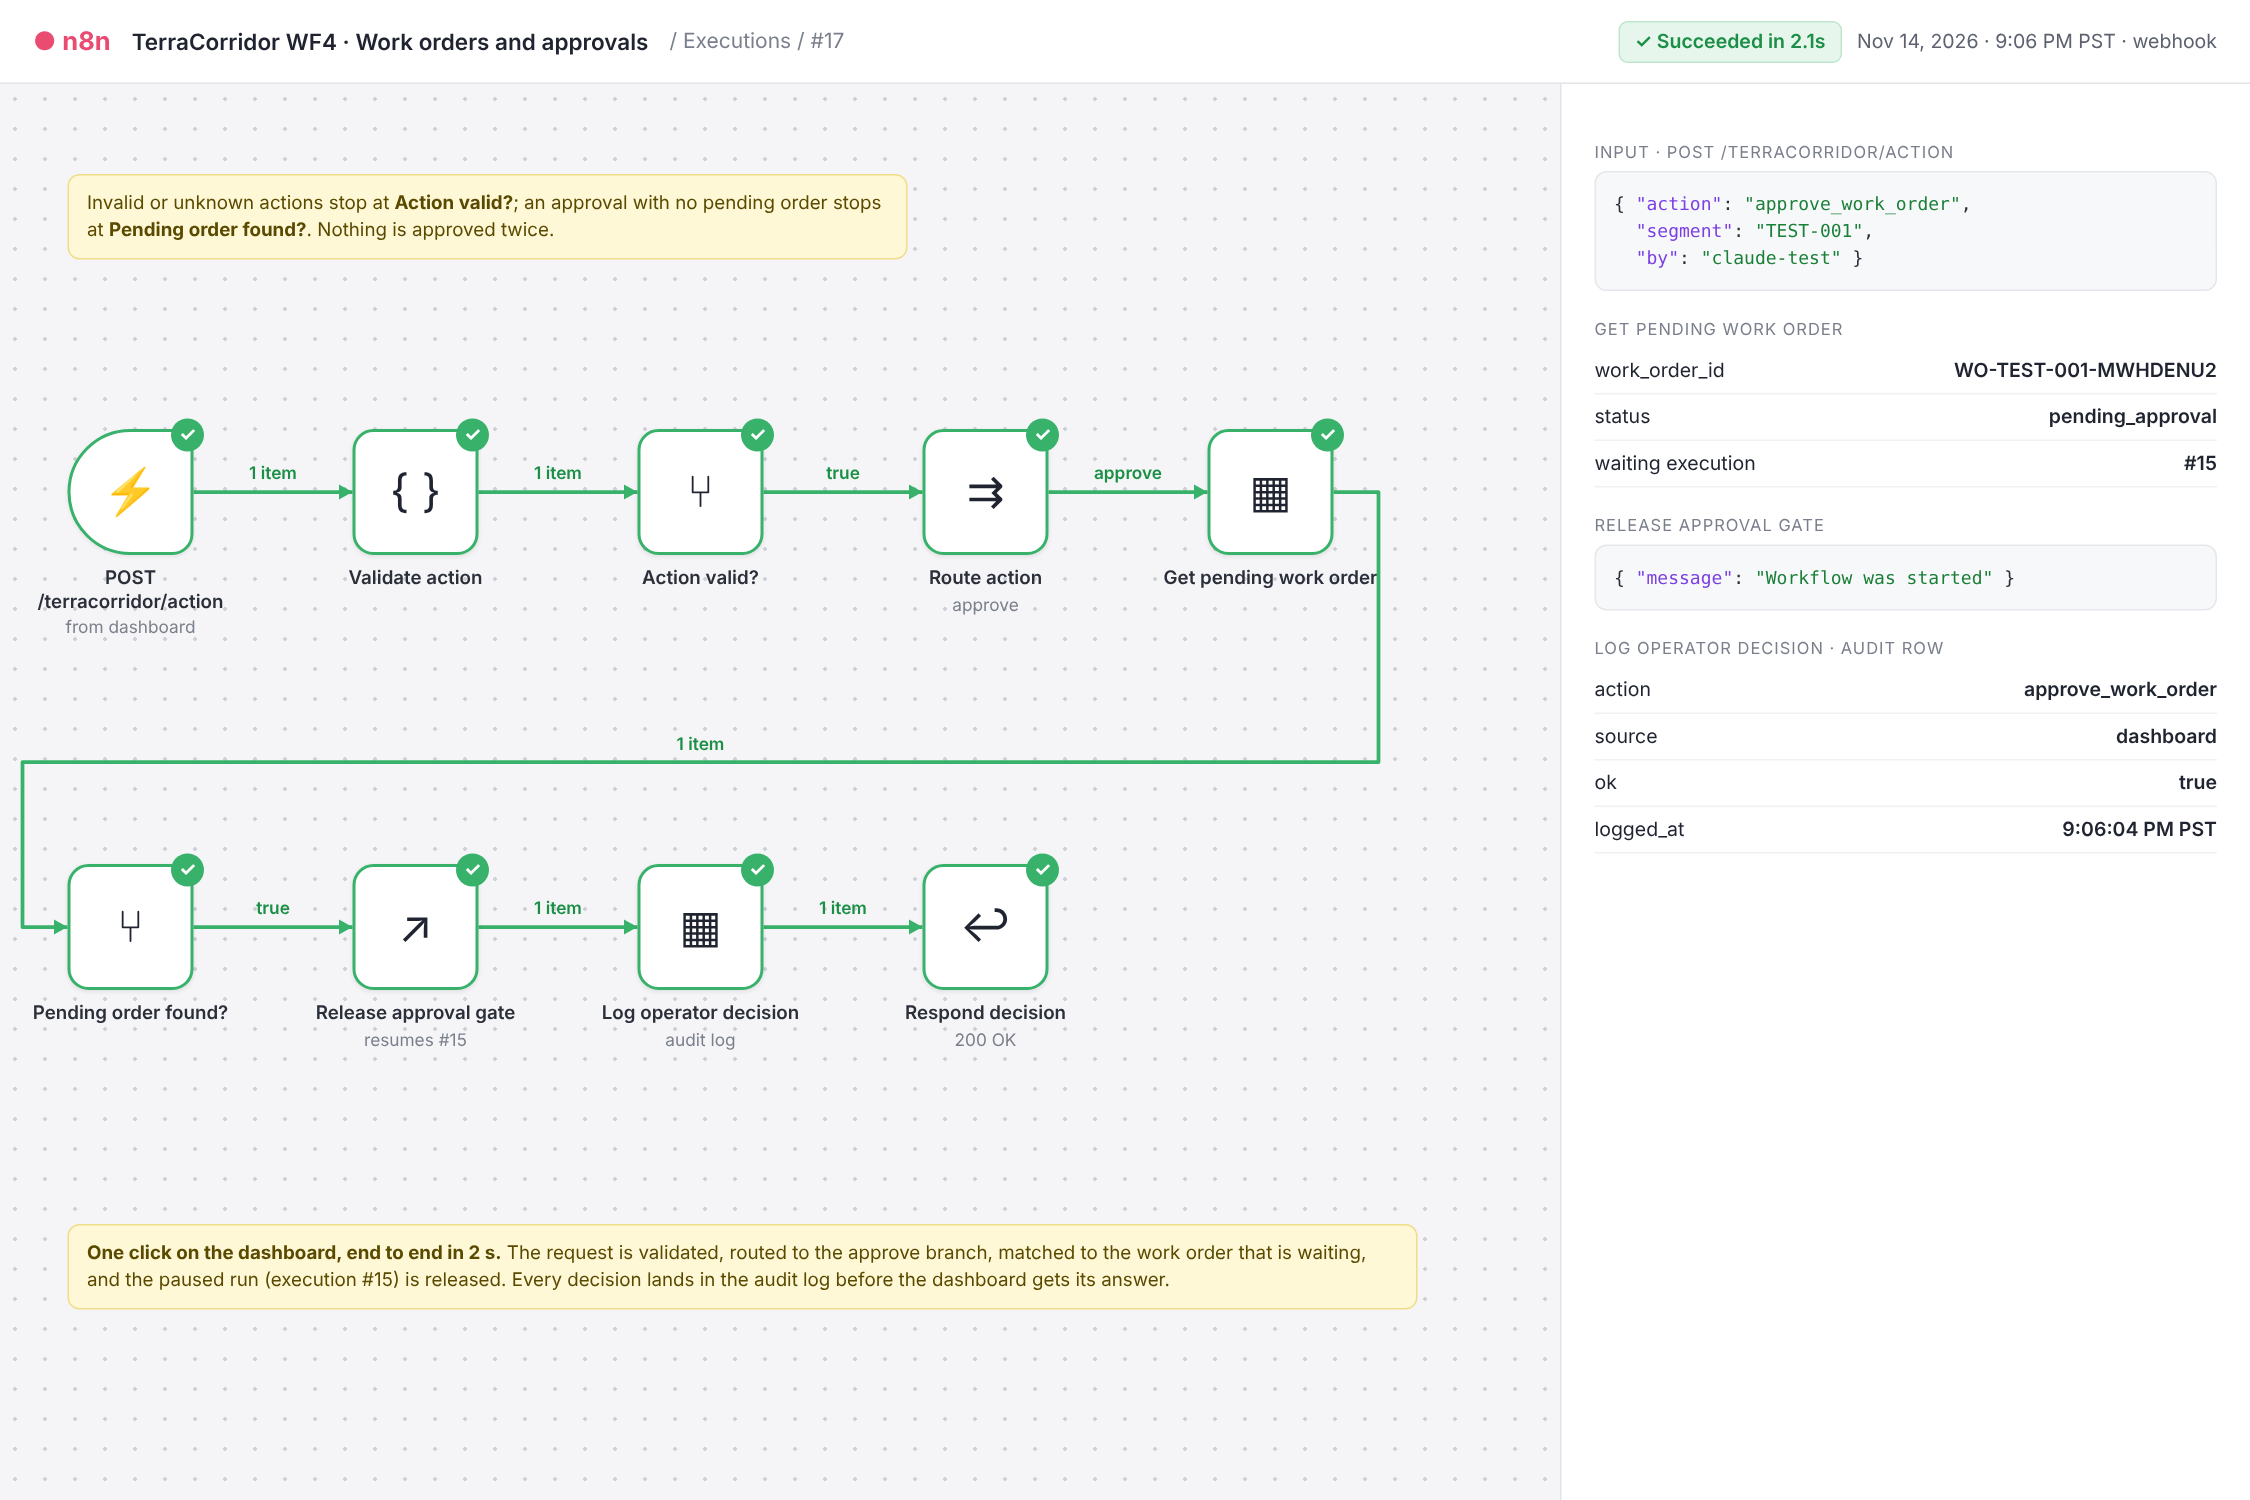
One click connects the dashboard to n8n, approving an inspection and updating the work-order audit trail.
TerraCorridor
Protect pipeline value. Prioritize climate risk. Find the upside.
Inspiration
With several members of our team coming from Alberta, the oil and gas industry has always felt close to home. We have personal connections to an industry that plays a major role in our communities and Canada's economy, but we're also increasingly concerned about how climate change is affecting the infrastructure and environments around us.
We wanted to explore how technology could help bridge these two realities: supporting an economically important industry while making it more resilient to a changing climate.
As extreme rainfall, flooding, wildfires, and drought become growing concerns, pipeline operators face difficult decisions about where to direct limited inspection and maintenance budgets. A single pipeline can stretch hundreds of kilometres, yet climate risks vary significantly along its route. Inspecting everything equally isn't always the most effective use of resources.
That's what inspired TerraCorridor. We wanted to build something that goes beyond visualizing climate change and actually helps operators respond to it. By combining climate projections, satellite imagery, and financial analysis, TerraCorridor identifies vulnerable pipeline segments, supports smarter maintenance decisions, and explores opportunities for renewable energy development along suitable corridors.
Our goal is simple: help the oil and gas industry adapt more responsibly to climate change.
What it does
TerraCorridor maps two study corridors in 1 km segments: an Edmonton-area reference corridor and a 12 km Coquihalla-area corridor in British Columbia. It screens each segment for four natural hazards:
- Ground failure, including erosion and slope instability
- River and waterway crossings
- Wildfire weather
- Drought
Reviewers can compare two climate-model periods, examine the evidence behind each segment's risk ranking, and approve or reject targeted inspections. n8n automates the workflow, recording decisions and work-order details for follow-up.
An interactive financial dashboard helps operators explore inspection costs, estimated avoided losses, and the financial implications of preventive maintenance. A separate solar screening tool identifies potentially suitable land for renewable energy and storage development.
Our risk scores are screening priorities, not predictions of failure or safety certifications. Missing data and uncertainty remain visible rather than being treated as evidence of safety.
How we built it
TerraCorridor combines JavaScript, Node.js, Leaflet, and n8n to automate environmental data collection, climate-risk assessment, and human-approved inspection workflows.
We integrated several publicly available datasets:
- Open-Meteo: Historical weather observations and CMIP6 climate projections
- Sentinel-2: Satellite vegetation observations
- Copernicus DEM GLO-30: Elevation and terrain information
- NASA POWER: Solar irradiance data
- OpenStreetMap: Pipeline routes and mapped waterways
Our shared JavaScript scoring engine evaluates four hazards and ranks segments according to their highest applicable risk score. n8n orchestrates data processing, decision approvals, work-order recording, and audit logging.
For Coquihalla, our 12 km study follows a publicly mapped OpenStreetMap pipeline route. Its operator and precise alignment have not been independently verified. Climate inputs are shared across the 12 segments, while terrain, vegetation, and waterway crossings help distinguish local conditions.
Climate resilience and financial decisions
Our Coquihalla assessment compares two non-overlapping climate periods: 2026–2030 and 2031–2035, using consistent scoring rules and thresholds.
The results highlight a meaningful shift in priorities:
- 2026–2030: All 12 segments are classified as Medium risk.
- 2031–2035: Four segments become High risk, while eight remain Medium.
- Key finding: All four High-priority segments correspond to mapped river crossings.
These results illustrate how changing climate conditions could influence where operators focus their inspection resources. They are not predictions of pipeline failures.
Our financial dashboard translates this information into scenario-based business decisions, allowing operators to adjust assumptions about failure costs, inspection expenses, and mitigation effectiveness.
Rather than presenting hypothetical savings as guaranteed, we show how the financial case changes under different assumptions.
Solar development is assessed separately as a potential sustainability and revenue opportunity. It is not included in the pipeline-protection business case, and suitability does not establish land rights, grid access, permits, or commercial viability.
What makes it useful
TerraCorridor brings together climate intelligence, financial decision-making, and operational action in one interface.
Instead of simply showing where climate risks exist, the platform helps pipeline integrity managers identify which kilometres deserve attention first and why.
Its key advantages include:
- Explainable prioritization: Each segment's ranking is supported by environmental evidence.
- Quantifiable decisions: Operators can compare inspection priorities, costs, and scenario-based financial benefits.
- Human oversight: Managers approve or reject inspection recommendations rather than allowing automated dispatch.
- Traceability: n8n records work orders and decisions for review and follow-up.
- Transparency: Missing data, uncertain assumptions, and limitations are clearly disclosed.
The goal isn't to replace engineering judgment. It's to give operators better information for allocating limited resources.
Challenges we ran into
One of our biggest challenges was working with real environmental data while maintaining an honest understanding of its limitations.
Public pipeline geometry is not equivalent to an operator-verified survey. Satellite observations can be irregular, and our selected imagery tile lacked scenes from 2022. We also encountered a river-flow observation that could not be confidently matched to the mapped waterway, so we excluded its discharge data rather than making an unsupported assumption.
Terrain presented another challenge: substantial elevation changes can exist even when a segment's endpoint grade appears relatively flat. We chose to display additional terrain information without silently changing our scoring methodology.
We also had to balance technical ambition with hackathon constraints. Building multiple climate-risk models, integrating external APIs, designing an interactive dashboard, and implementing n8n approval workflows required us to prioritize what we could demonstrate reliably.
Finally, translating risk into financial value meant being careful about assumptions. Failure probabilities, inspection effectiveness, solar output, and lease revenue all depend on real-world conditions that a hackathon prototype cannot fully verify.
What we learned
We learned that building a useful climate-risk tool is about much more than processing environmental data.
A risk score is only valuable when someone can understand it, trust its limitations, and use it to make a better decision.
Working with climate projections taught us the importance of data provenance, model uncertainty, and distinguishing long-term climate trends from short-term weather forecasts.
Most importantly, we discovered how automation can support human decision-making without replacing it. By combining n8n workflows with explicit approval steps, we could move from climate observations to actionable inspection recommendations while keeping operators in control.
What's next for TerraCorridor
Our next step is to turn TerraCorridor from a hackathon prototype into a validated climate-resilience and cost-optimization tool for the oil and gas industry. Our future development goals include:
- Expand sustainability opportunities: Quantify potential renewable electricity generation (MWh), lease revenue, and avoided emissions from feasible solar and energy storage projects.
- Validate in the real world: Pilot TerraCorridor across at least three Canadian pipeline corridors, comparing recommendations against existing inspection schedules and evaluating risk coverage, estimated avoided losses, and cost efficiency.
We want to demonstrate that pipeline operators can identify more high-risk infrastructure with the same inspection budget, reducing climate-related financial exposure while improving long-term infrastructure resilience.
Built with
JavaScript, Node.js, Leaflet, n8n, Open-Meteo, CMIP6 climate data, Sentinel-2, Element84 Earth Search, Copernicus DEM GLO-30, NASA POWER, and OpenStreetMap.
Links and demo
- Live demo: https://terracorridor.netlify.app/?corridor=bc-coquihalla#/
- GitHub repository: https://github.com/chlooood/eprojects
- n8n workflow showcase:
workflows/TerraCorridor · All workflows (showcase).json
Our demo showcases the corridor map, climate-risk analysis, individual segment evidence, financial scenarios, and n8n's human-approved work-order workflow.
Built With
- artificial-intelligence
- climate
- cmip6
- copernicus
- css3
- github
- html5
- javascript
- leaflet.js
- n8n
- nasa-power
- netlify
- open-meteo
- openstreetmap
- sentinel-2
