-
-
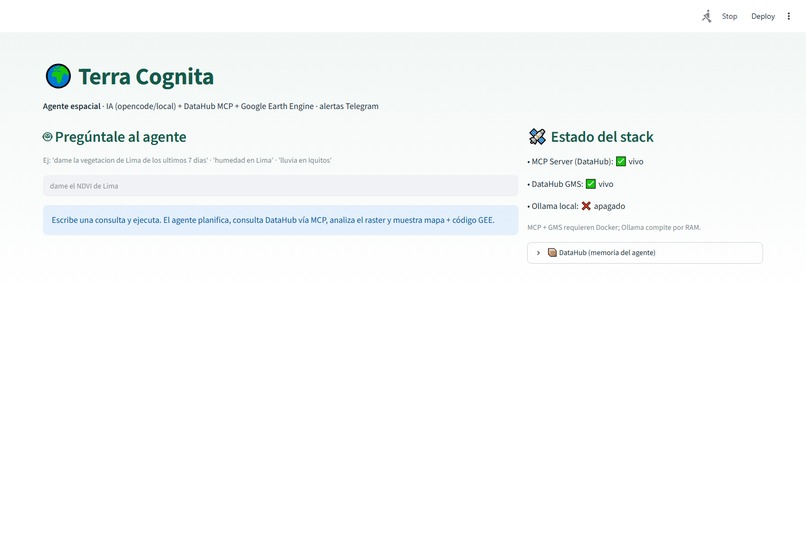
REAL-TIME DASHBOARD
-
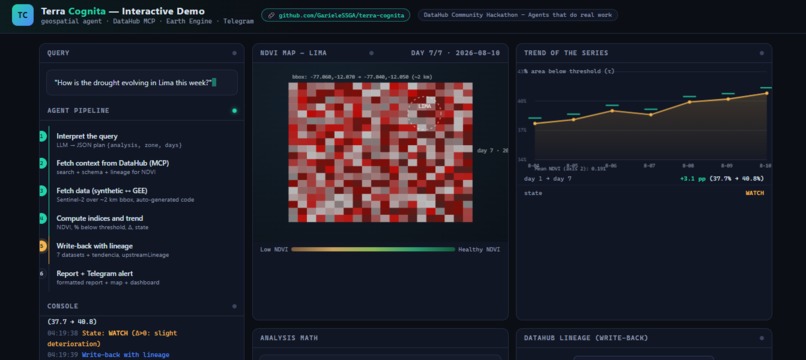
DASHBOARD DEMO
-
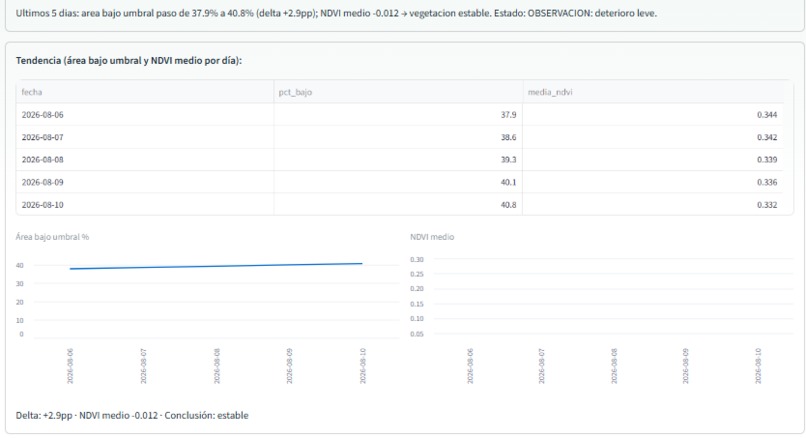
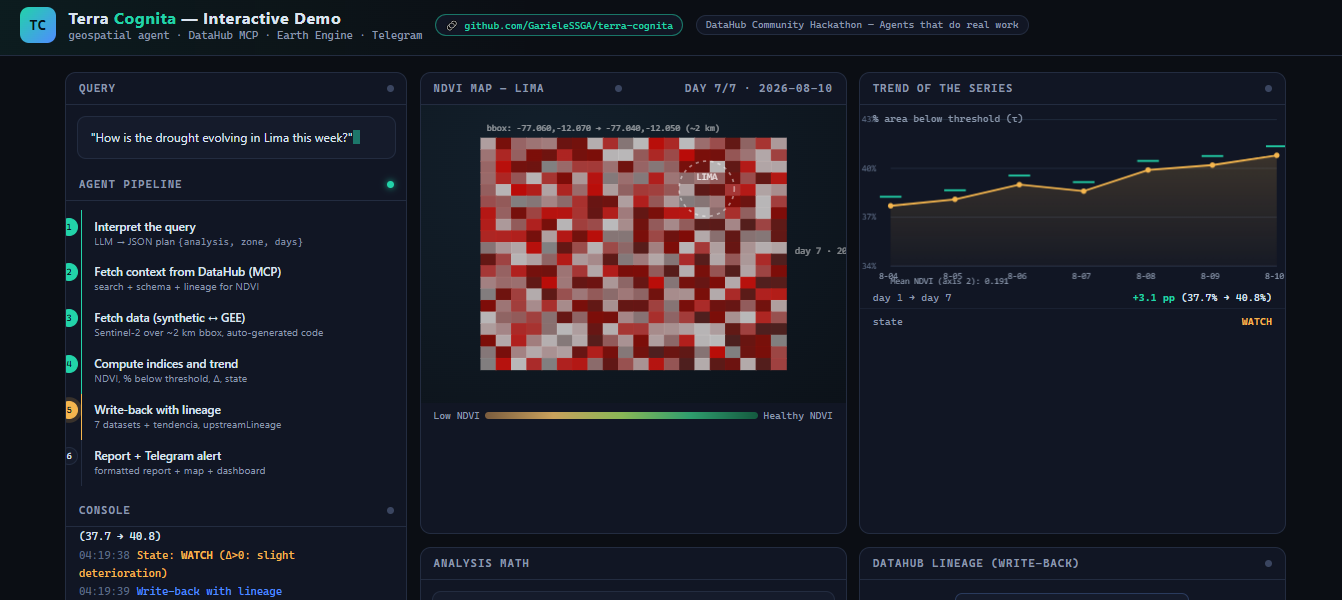
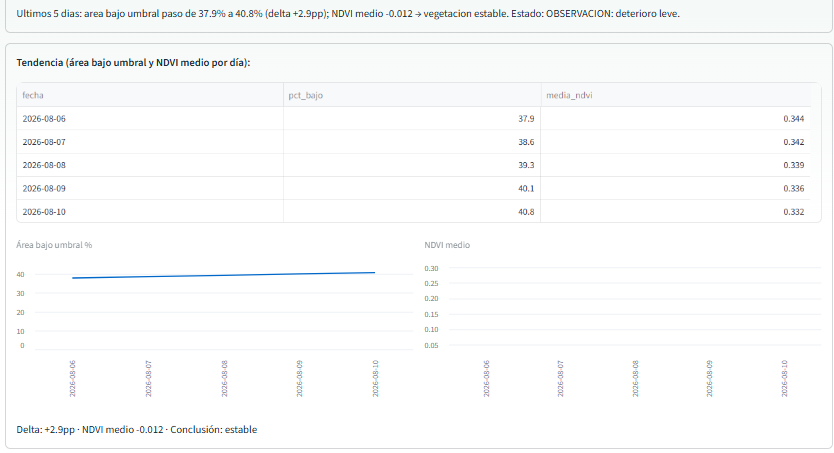
7-day vegetation trend: % of area below threshold and mean NDVI, day by day.
-
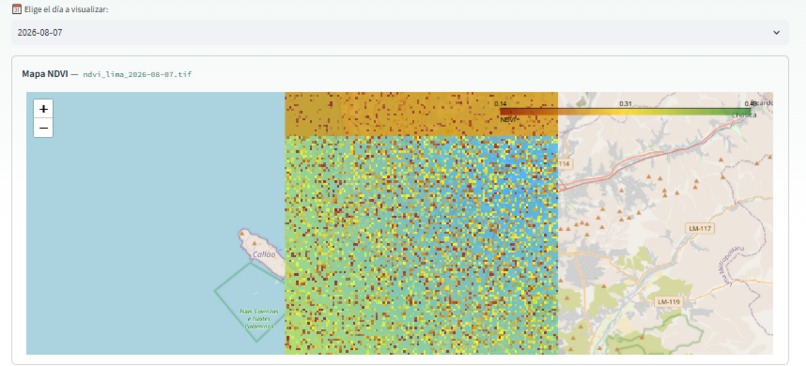
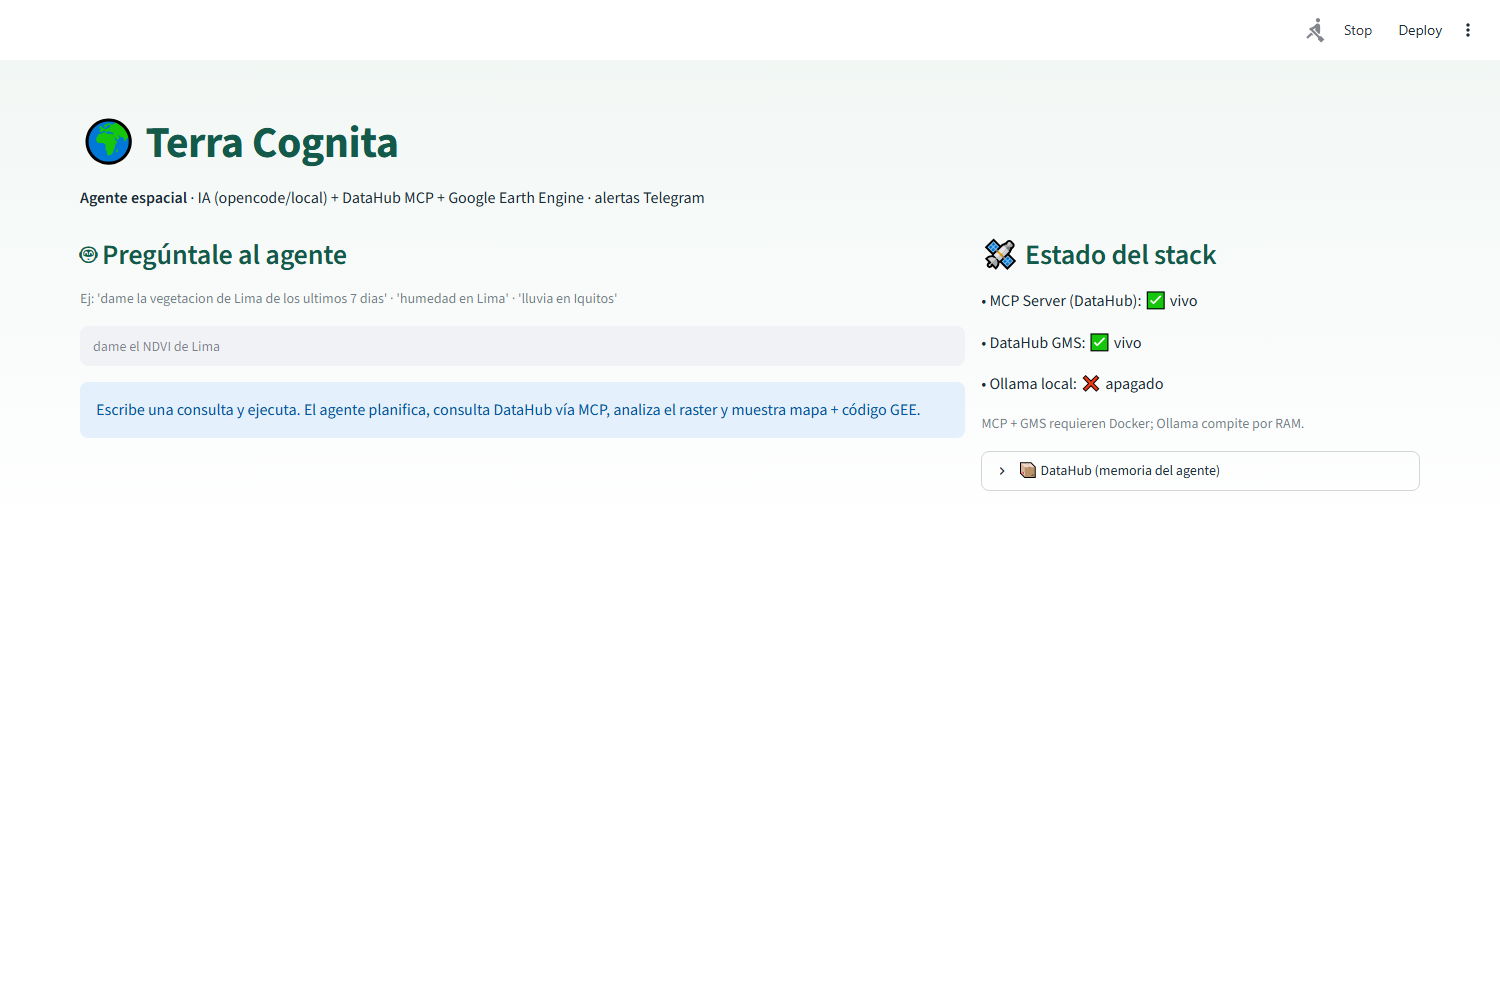
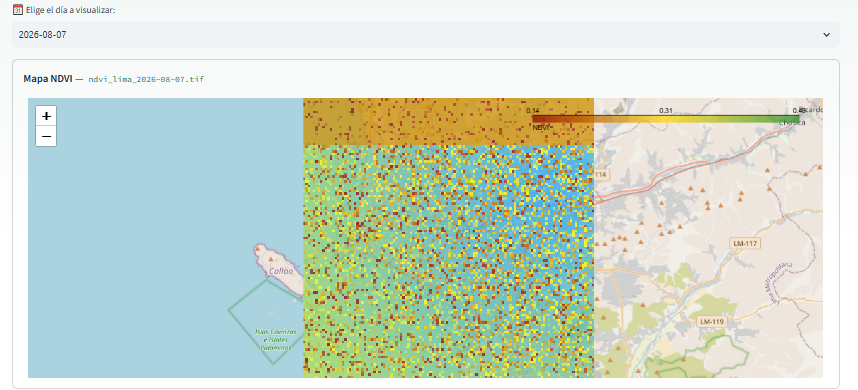
Terra Cognita dashboard: NDVI map of Lima with legend, metrics and agent chat
-
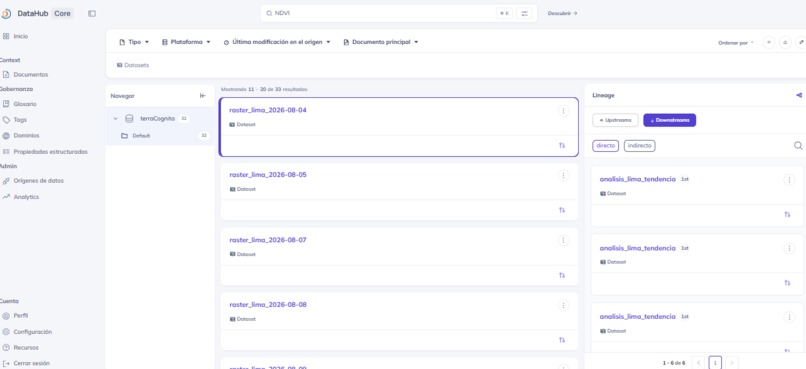
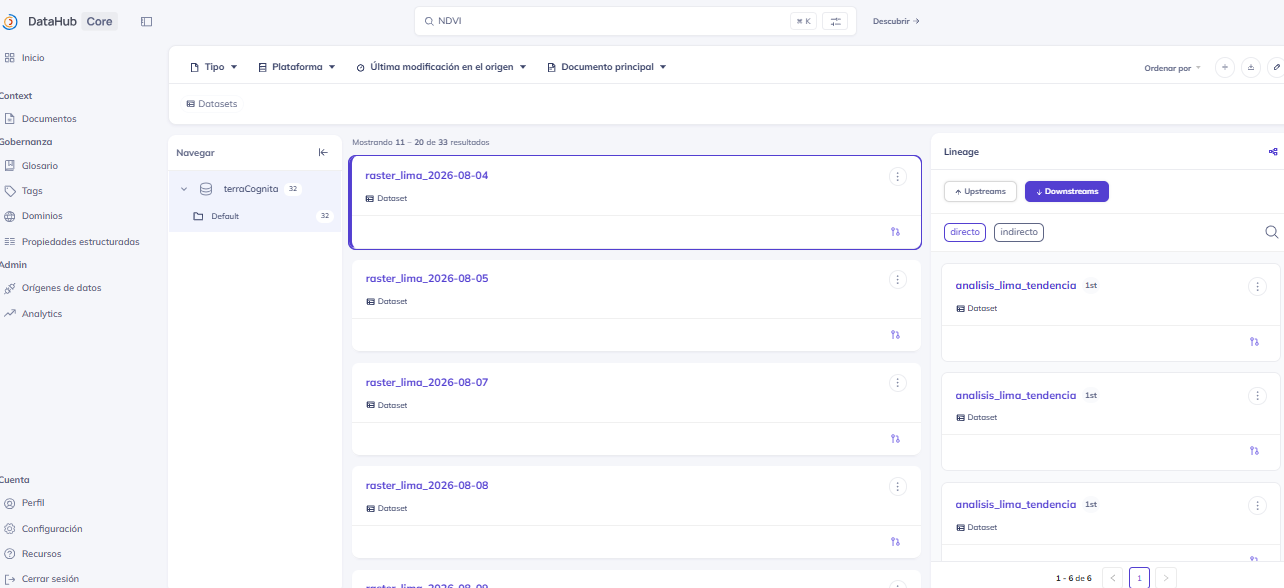
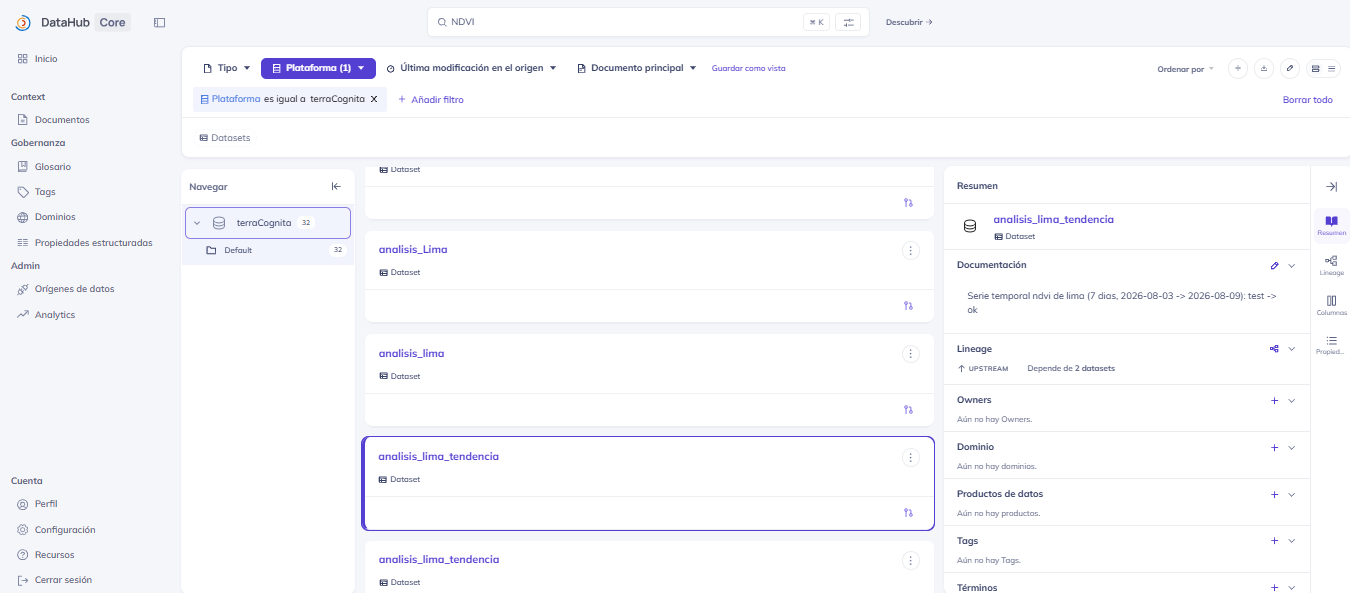
The agent's memory: 29+ datasets catalogued by the agent in the DataHub graph
-
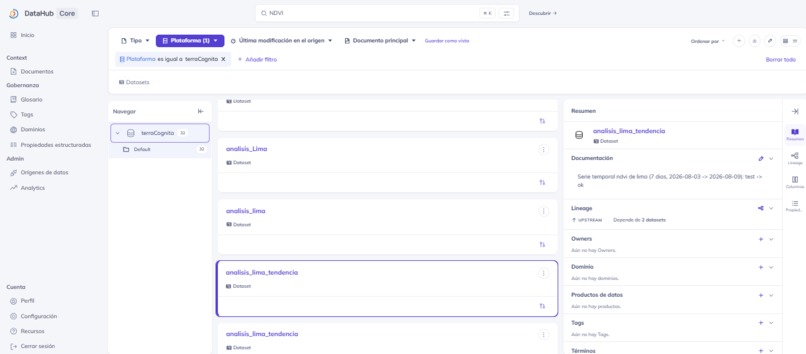
Lineage in DataHub: the trend summary points to its 7 source rasters — the agent writes memory with full lineage
-
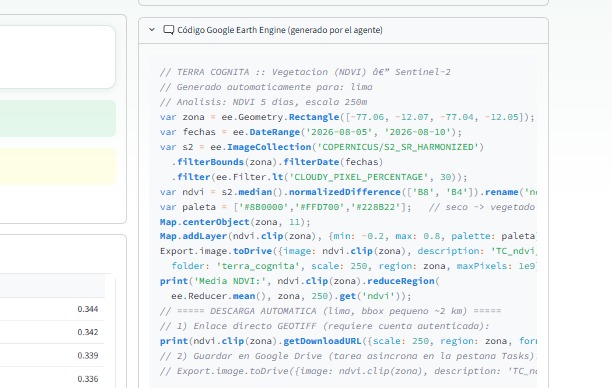
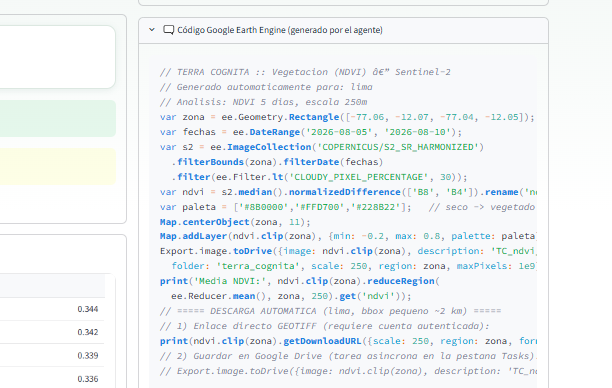
Auto-generated Google Earth Engine code: small bbox + getDownloadURL to fetch real Sentinel-2 data
Project Story — Terra Cognita
About the project: our inspiration, what we learned, how we built it, and the challenges we faced.
What inspired us
We live in a country where watching the land matters: drought creeps into coastal green spaces, urban zones expand over fragile hills, and a single delayed warning can mean days of unnecessary risk — or worse, a missed alert that arrives too late.
The problem is not data. Sentinel-2, CHIRPS, SMAP and MODIS publish free, daily information about vegetation, rain, soil and temperature. The problem is access: reading those layers requires GIS expertise, fragmented tools and days of manual work — so most decisions are made without spatial evidence.
We imagined a different user: a mayor, a small farmer, a journalist. Someone who asks, in plain Spanish:
"¿Cómo está evolucionando la sequía en Lima esta semana?"
…and gets, in about a minute: a map, the trend, the lineage of every number, and an alert on Telegram if something is wrong.
That is Terra Cognita: an agent that uses the memory of its own data graph, so it never hallucinates.
What we learned
The project pushed us across four very different worlds:
- Agents as software, not chatbots. The orchestration pattern — interpret → query context → act → write back → notify — turned the LLM into a small workflow engine. The model plans, the code executes, and the model reasons over real results.
- DataHub as an agent's memory. The most surprising lesson was that a data catalog is also a cognitive tool: asking the MCP server "what datasets exist for NDVI?" before acting eliminates hallucination by construction — the agent reasons about real entities (datasets, schemas, lineage), not about what it believes.
- Earth Engine is closer than it looks. With a small bounding box (~2 km) the free quota is more than enough, and code generation means the agent itself writes the download script per query: NDVI, rain, soil moisture, water, LST and EVI share one template engine and one pipeline.
- A demo must never hang. On an 8 GB laptop, running THREE systems at once (Docker+DataHub, the agent, the dashboard) means less than ~0.3 GB of free RAM. We ended up building a cascade of interpreters (opencode → Ollama → LLM API → heuristic) so the demo always finishes, no matter what dies underneath.
How we built it
The pipeline is a closed loop, each stage with a deliberate role:
User (natural language)
   │
   ▼
AGENT — cascade: opencode → Ollama (local) → LLM API → heuristic
   │  plan = {analysis, zone, days}  (JSON from LLM)
   ├──► DataHub via MCP server (HTTP :8000): search/schema/lineage
   ├──► rasters (synthetic for the demo, or GEE real: one-line switch)
   ├──► computation: % below threshold, means, delta, trend, state
   ├──► GEE code auto-generated (small bbox + getDownloadURL)
   ├──► datahub_write: 1 dataset per date + upstreamLineage
   └──► Telegram (alert reasoned by the agent) + dashboard/map/chat
The math is simple but meaningful. For vegetation we follow the classic normalized difference index:
$$ NDVI = \frac{NIR - RED}{NIR + RED} $$
and the share of degraded area on day $t$:
$$ P_t = \frac{1}{N_t}\sum_{i=1}^{N_t} \mathbf{1}\big[NDVI_i < \tau\big] \cdot 100 $$
The trend report compares the first and last day of the series:
$$ \Delta = P_{t_0} - P_{t_{N}} \qquad\text{(percentage points)} $$
with alert rules:
$$ \text{state} = \begin{cases} \text{ALERTA} & P_{\max} \geq 50 \ \text{ALERTA} & \Delta > +5 \ \text{OBSERVACIÓN} & \Delta > 0 \ \text{OK} & \text{otherwise} \end{cases} $$
The same template engine powers rain (CHIRPS), soil moisture (SMAP), water (NDWI), temperature (MODIS LST) and robust vegetation (EVI).
For the demo we use synthetic rasters so the flow is reproducible in any room, and the real-data path (GEE) is one config line away:
gee:
  fuente_default: "sintetico"   # → "gee" downloads Sentinel-2 for real
Challenges we faced (and fixed)
| Challenge | What actually happened | Fix |
|---|---|---|
| Demo "hung" silently | Prints without flush + a 4-minute process → output lost on kill | flush=True everywhere + explicit timeouts (Ollama 90 s, MCP 45 s) |
| Write-back crashed | asegurar_raster_fuente ran outside the try/except |
moved inside → local fallback with URN |
| Config loaded empty | parents[2] pointed outside the repo → tokens ignored |
fixed path to parents[1]; verified len(token) each session |
broken CURL_CA_BUNDLE on Windows |
TLS requests failed randomly | Remove-Item Env:CURL_CA_BUNDLE first thing every session |
| GEE template crash | .format() collided with Earth Engine's {min: ...} braces |
token placeholders (__ZONA__, __ESCALA__, …) instead |
| map didn't render | modern folium moved Colormap to branca; ImageOverlay to raster_layers; then cmap(arr) broke on 2-D arrays |
branca.LinearColormap (legend) + manual RGB rasterization |
| raw HTML leaked into the UI | Streamlit required st.html for the styles we wanted |
moved all styling to st.html |
| Telegram sent ugly Python dicts | limit: report was the raw results repr |
formatted report: per-day table, delta, conclusion, DataHub URN |
| secrets in git | config.yaml with the bot token was tracked |
git rm --cached + config.example.yaml in the repo |
| Telegram emoji corrupted through console | cp1252 CLI mangled multi-byte chars | reports sent from the code path (UTF-8), not the console |
Hardware taught us discipline too: with ~0.3 GB free RAM, imports are slow, Ollama times out and processes compete for memory. The cascade interpreter design was born from a real constraint: the demo must finish, and finishing with heuristics beats theory without output.
The result
- A public repository with Apache-2.0 license, full docs and real agent outputs (report, catalogued JSON, generated GEE code).
- A dashboard (map per day + trend charts + live stack status).
- A narrated execution script — 8 visible stages to explain the architecture while it runs.
- An agent that writes its results back into the graph with lineage, so any other agent can inherit them: 29+ datasets, 5 trend datasets, each traceable to its source rasters.
Terra Cognita shows that a modest machine can run a strong geo-agent: the brain is swapable (any provider, any local model), but the memory — DataHub and its lineage — is what makes it trustworthy.
Built With
- agents
- api.ai
- data-catalog
- data-lineage
- datahub
- docker
- elasticsearch
- folium
- geojson
- geospatial
- google-earth-engine
- interactive-maps
- langchain
- llm
- machine-learning
- mcp
- ndvi
- ollama
- postgresql
- python
- raster-analysis
- remote-sensing
- sentinel-2
- streamlit
- telegram-bot-api


Log in or sign up for Devpost to join the conversation.