-
-
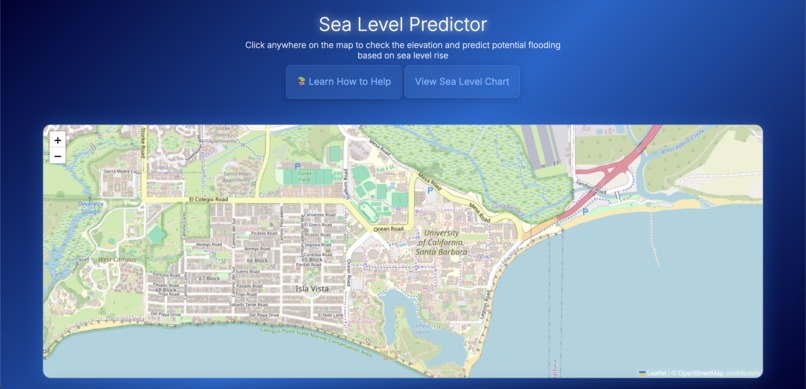
Main Page
-
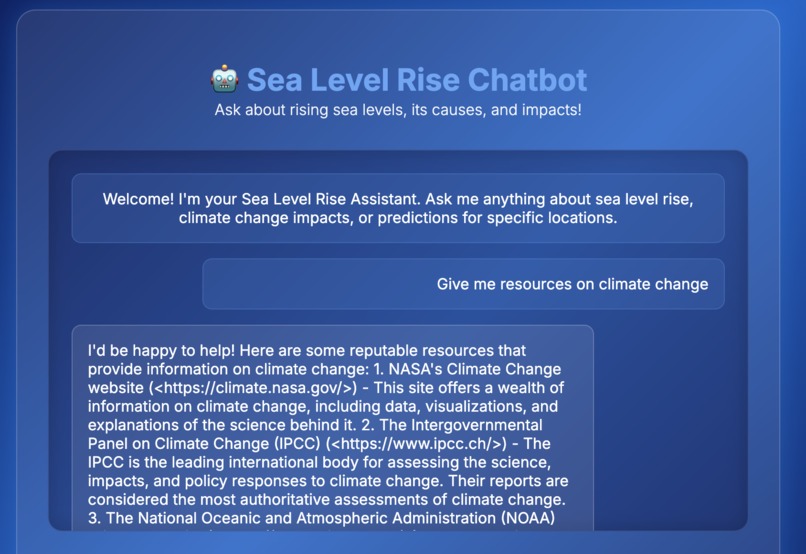
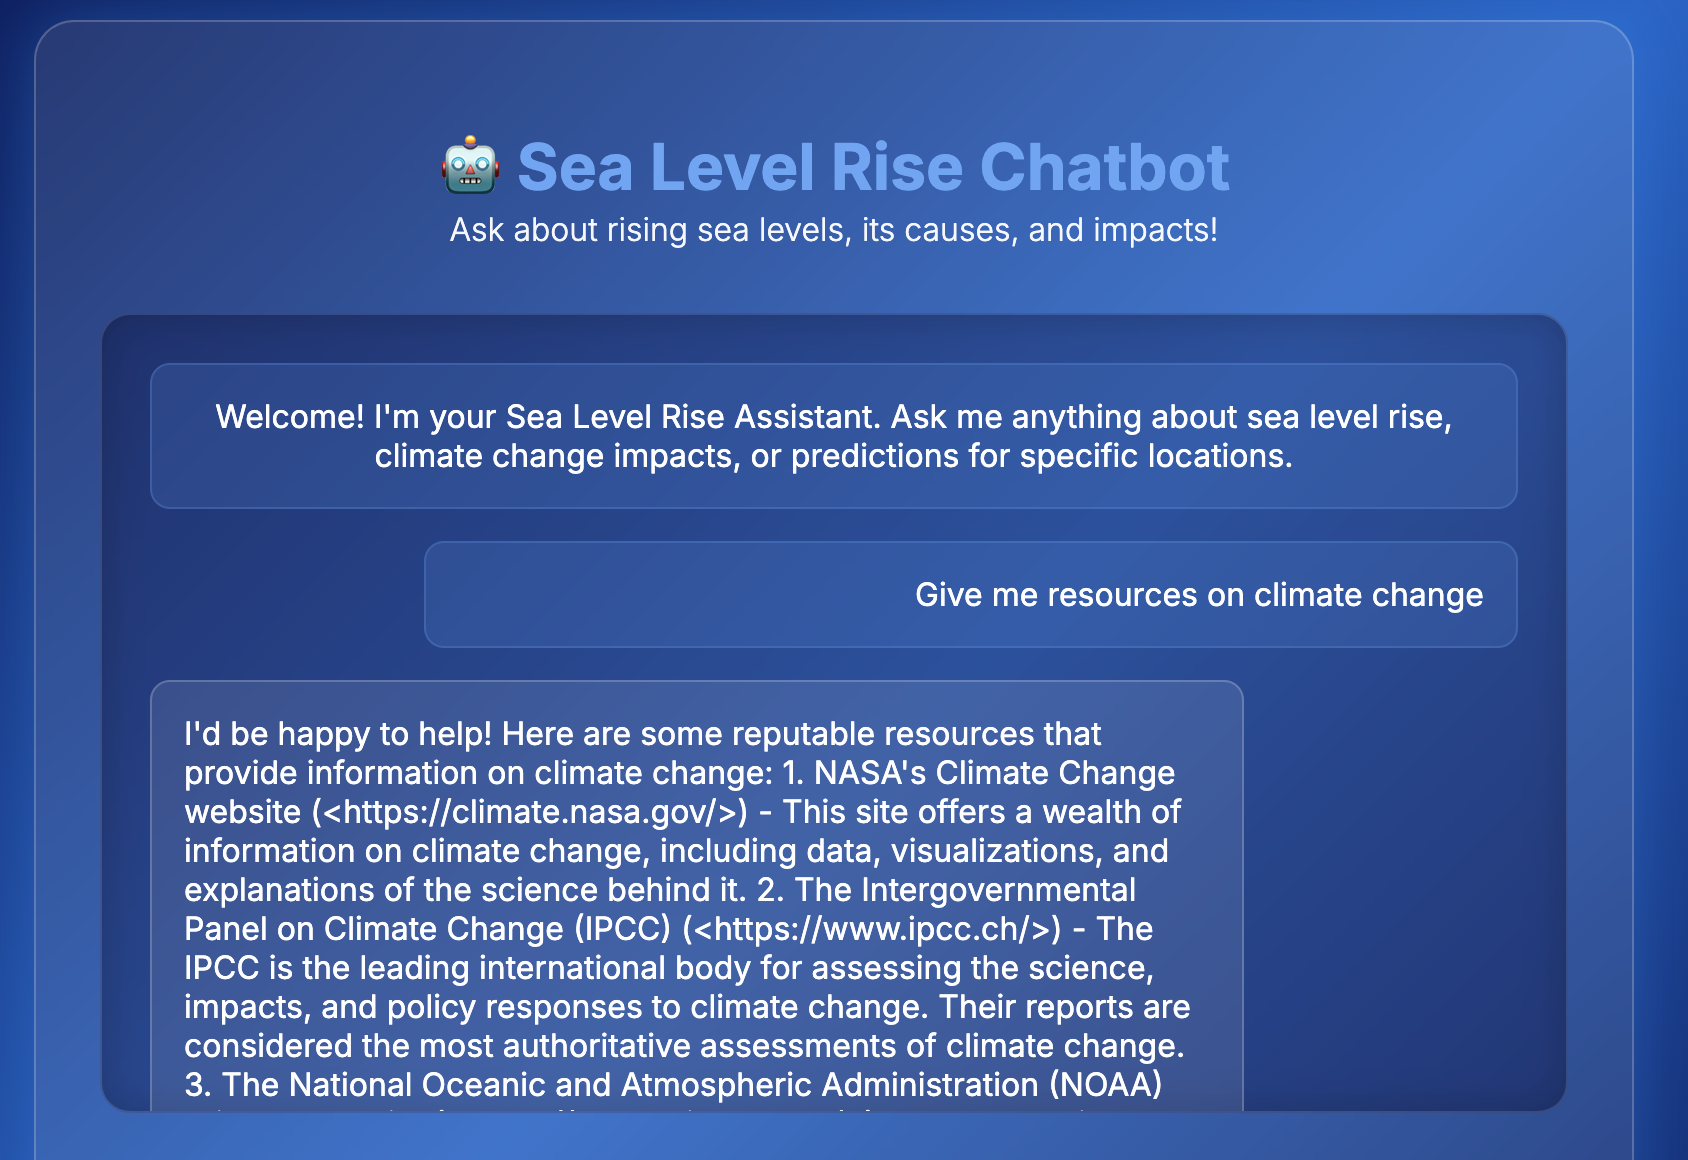
Sea Level Rise Assistant w/ Groq
-
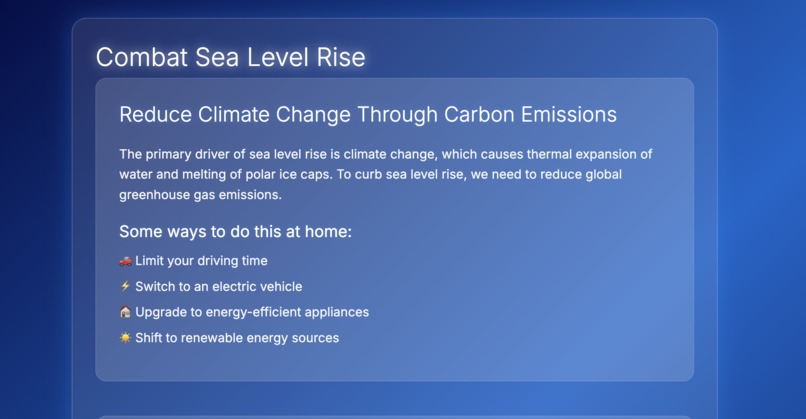
Resources for a better climate
-
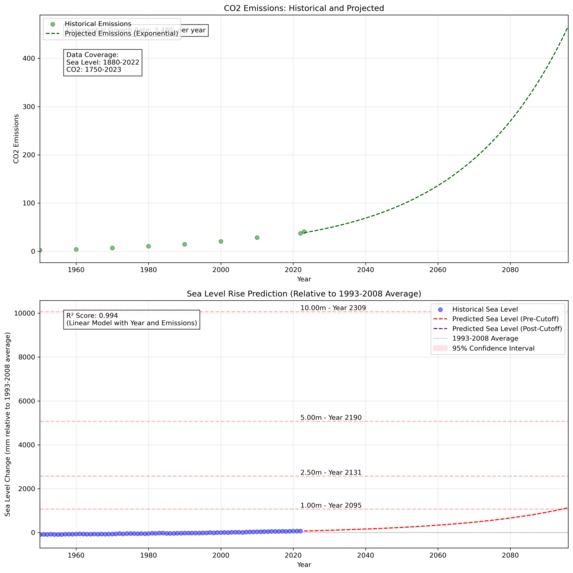
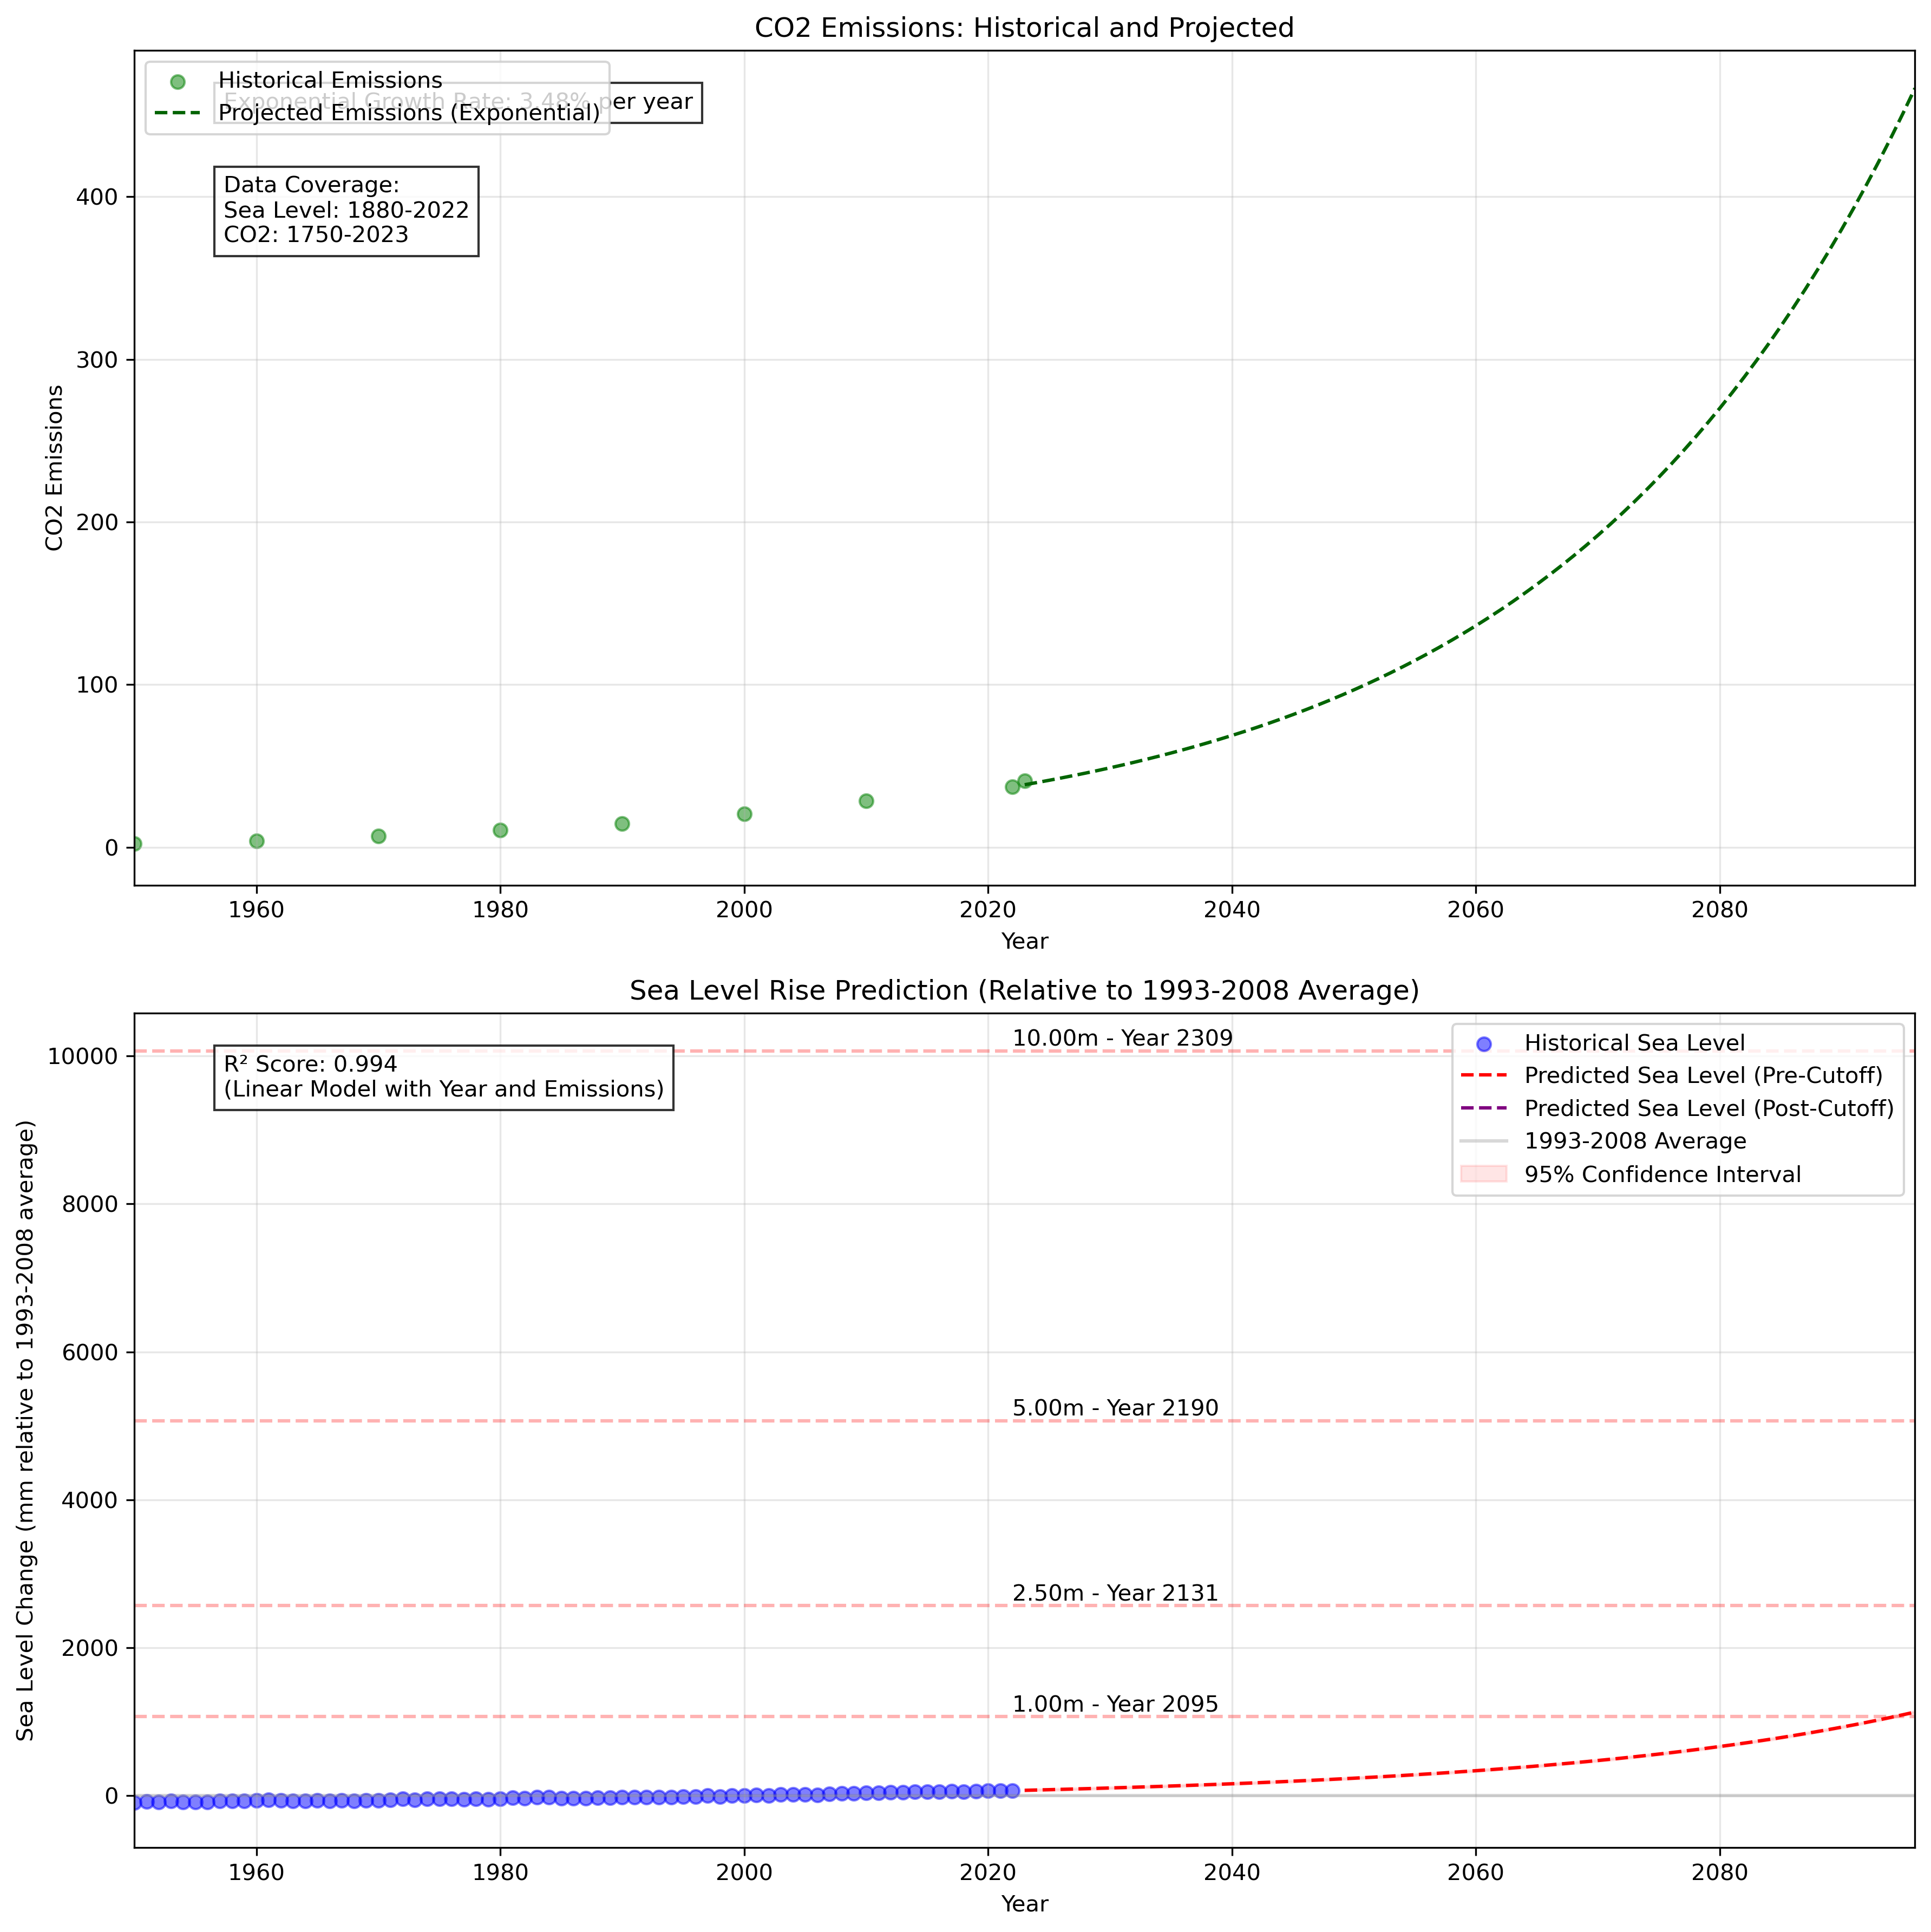
Predictive Model Graph
-

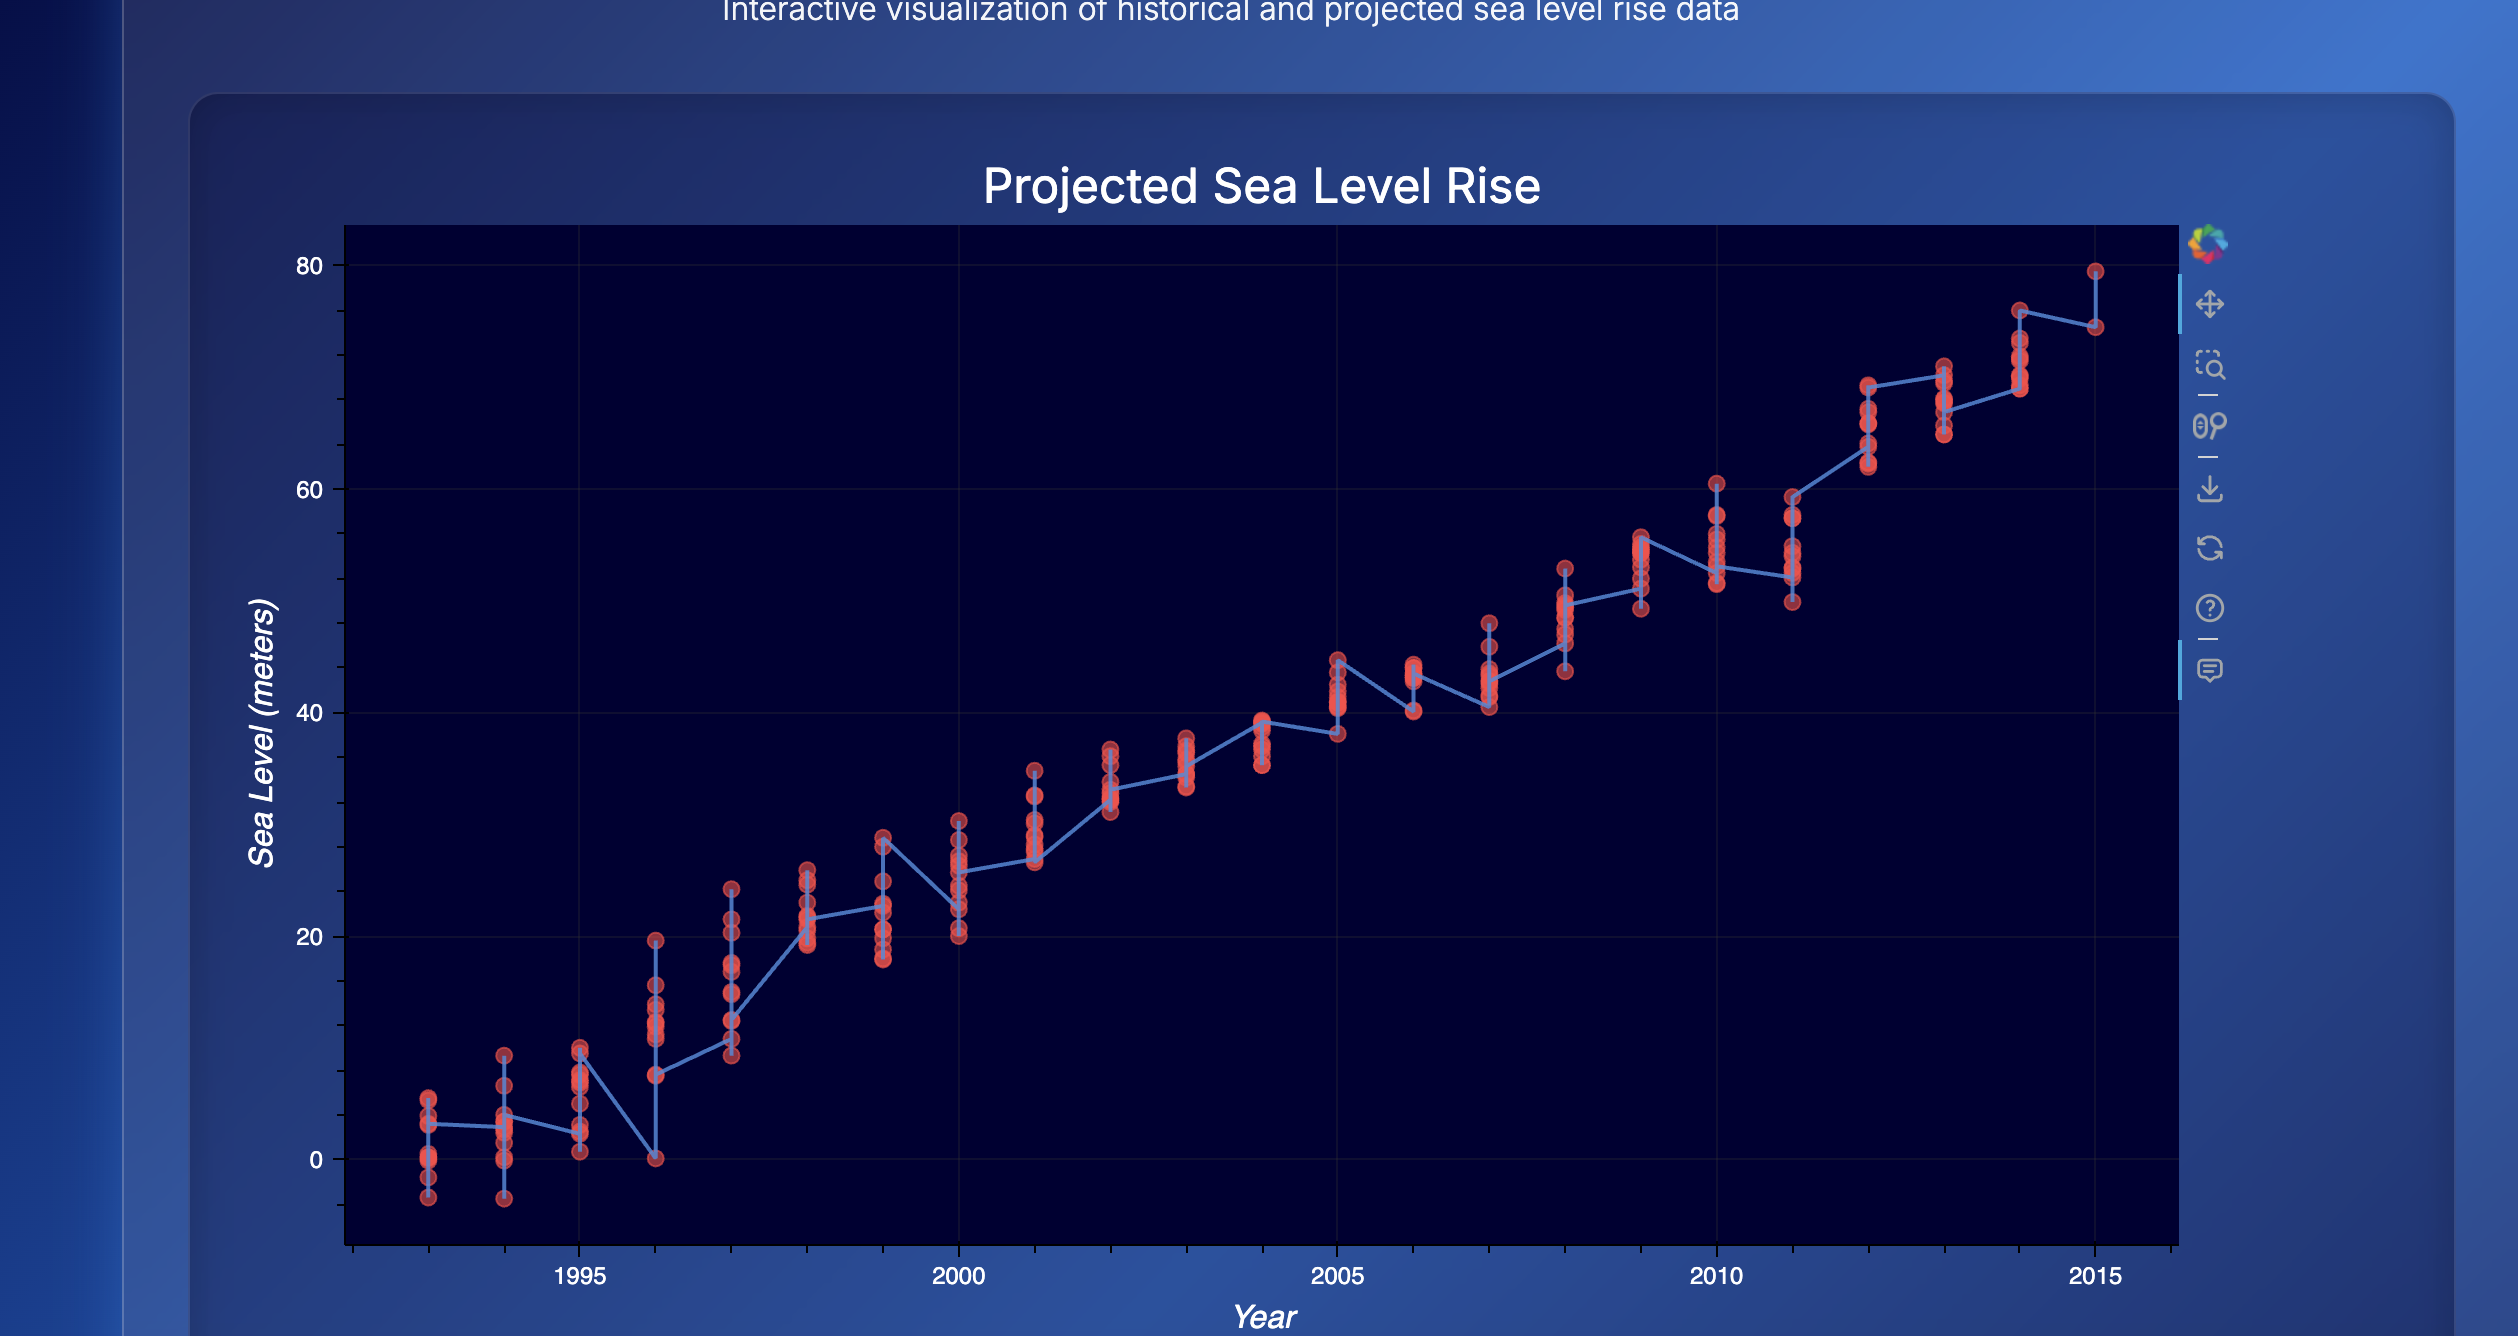
Data visualization

Inspiration
Our inspiration was based on our experience living so close to the coast here in IV. We know that people at the coast are heavily affected by climate change and wanted to get a realistic idea of what this would mean for our future.
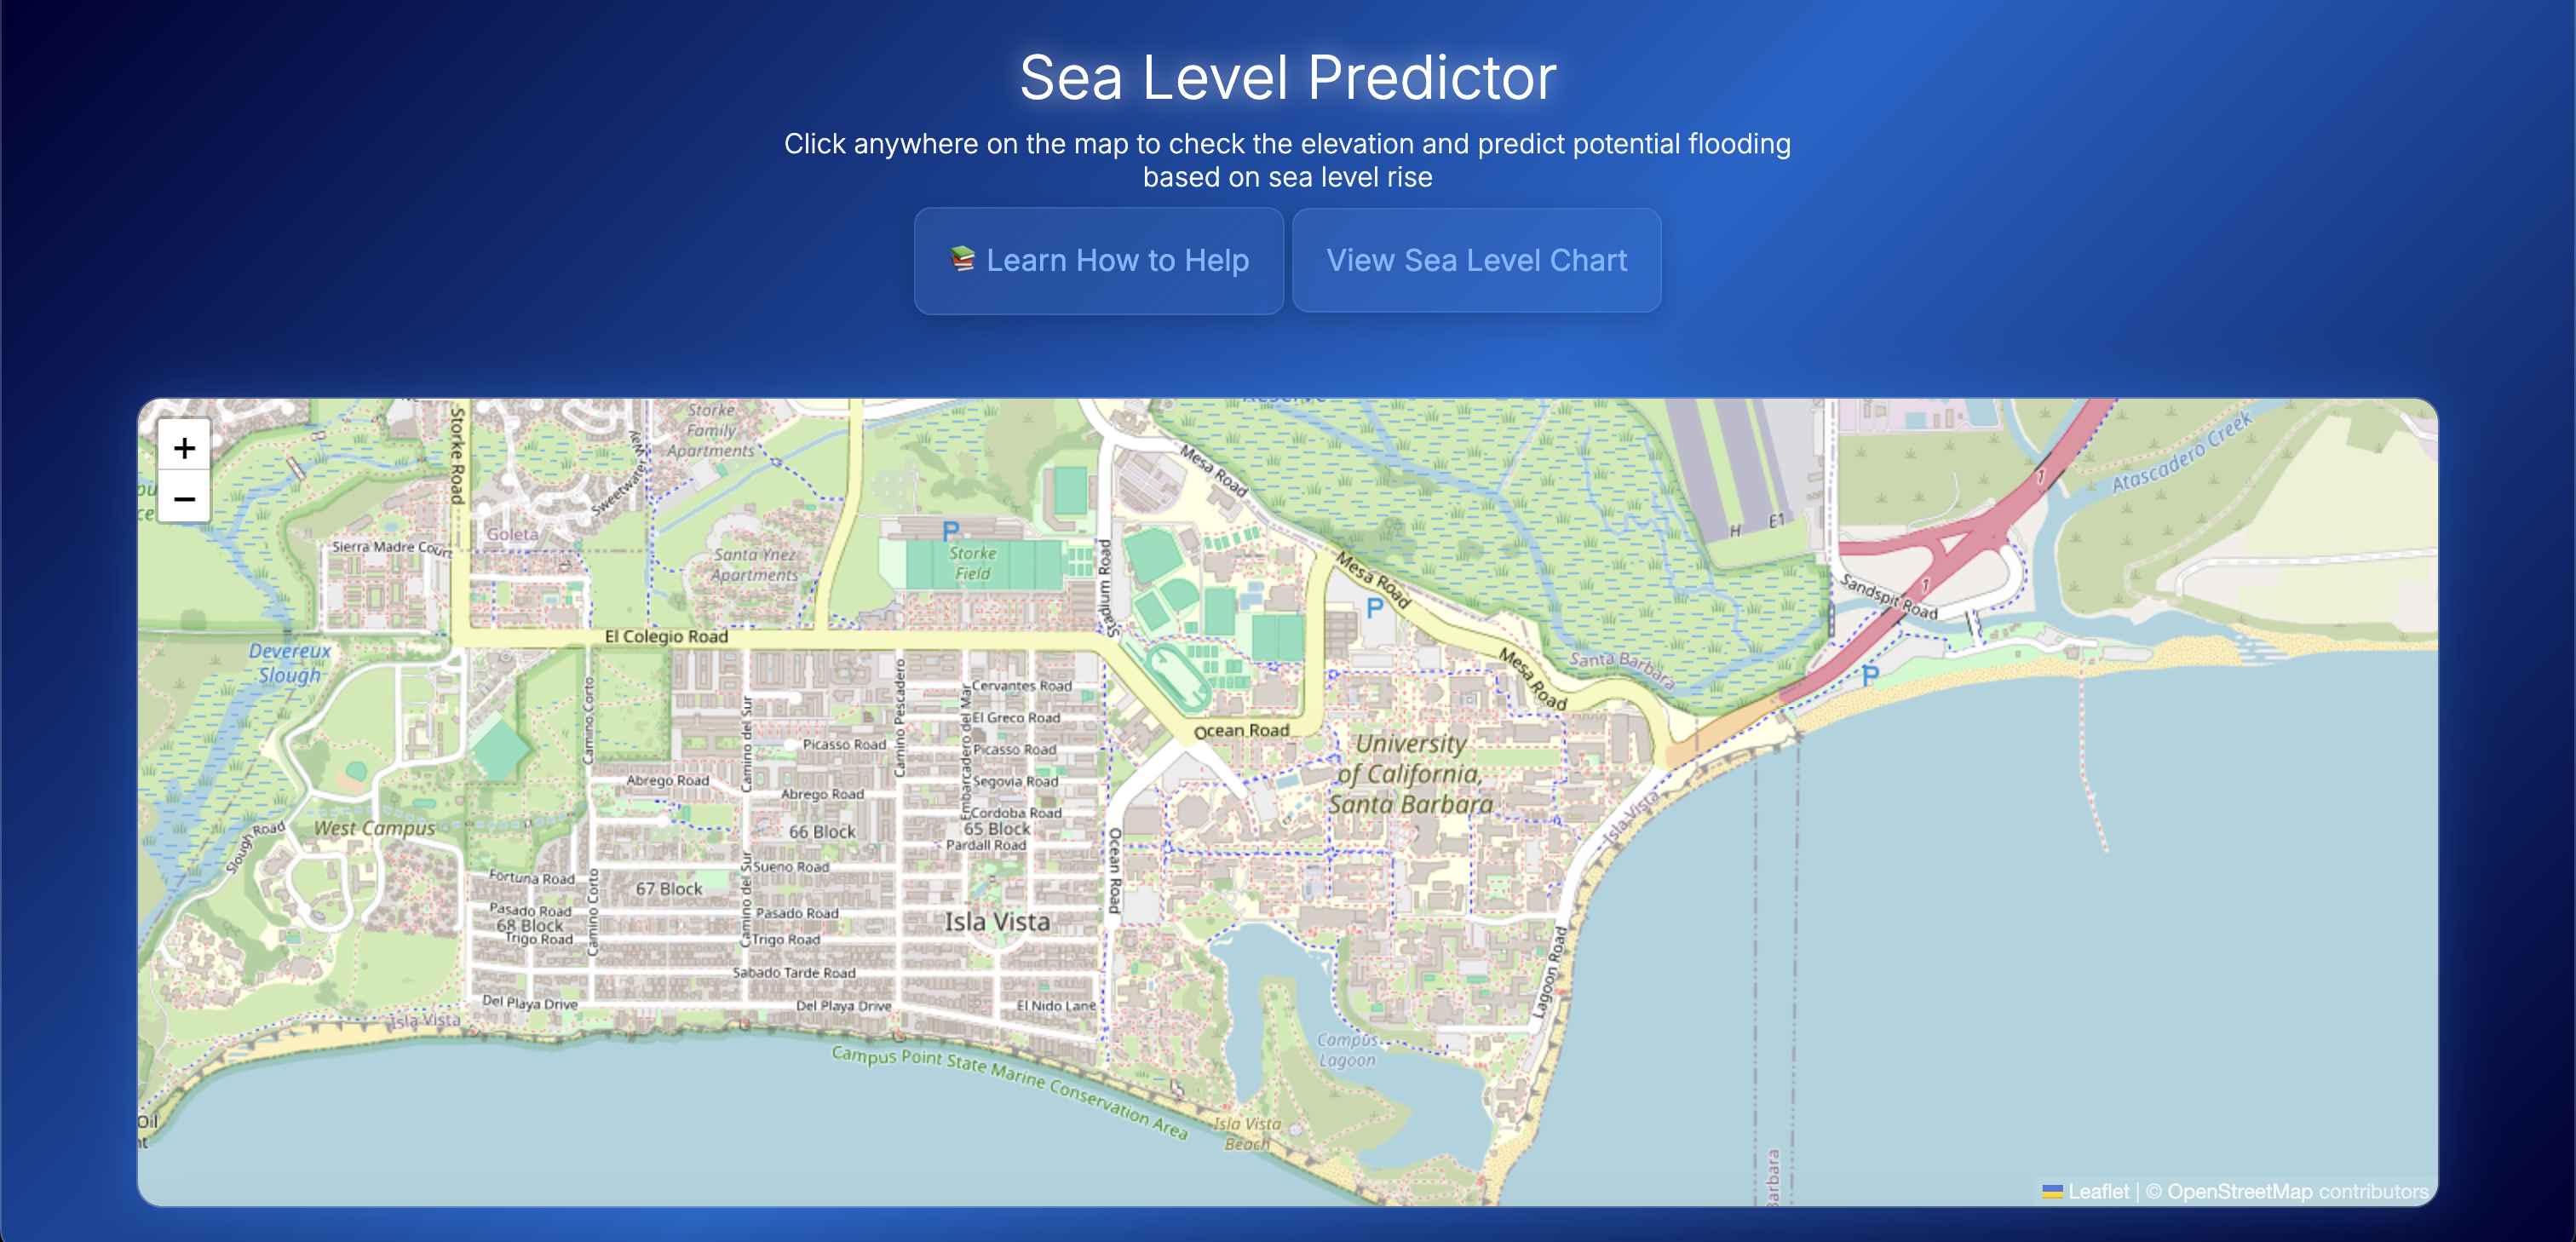
What it does
With our app you can predict when any area on the map will be underwater based on our trained sea level rise prediction model. You can also get resources that help minimize this impact and see the sea level prediction model in the graph.
How we built it
We used a linear regression model that predicts sea level rise and helps us estimate when areas will go underwater. This combined with topographical data from Google's Elevations API and our OpenStreetMap port allowed us to calculate when specific areas on the map will be underwater. We used streamlit for the front end data visualization and customized this with custom CSS and multiple pages for a great user experience. This combined with topographical data from Google's Elevations API and our coordinates from leaflet.js allowed us to calculate when specific areas on the map will be underwater. The map was modified so the user can't choose an ocean coordinate, only land points are able to be predicted. We first used Streamlit for the front end data visualization and customized this with custom CSS and multiple pages for a great user experience. A navigation bar not native to Streamlit was added for easy organization, and a predict button using JavaScript to present the data to the user much more visually appealing. Additionally, there's a chatbot ready to answer any questions about rising sea levels and it's related topics. We had some extra time at the end, so we decided to rewrite the backend in Flask to enable more customization.
Challenges we ran into
We originally wanted to build an app that helped understand how real estate prices were affected by rising sea levels. After an exploratory data analysis we decided that there was not real correlation and that it would be better to build a tool and inform the public when they might expect areas to be affected by flooding and sea level rise. Also, every language we wanted to use had to be wrapped in Python as that was the native language for Streamlit. There were many restrictions in Streamlit, including issues with API keys, different libraries not compatible, and design implementations had to all be hard-coded out. While there is much data for sea level rising, we combined this with data for CO2 emissions and its accelerated impacts with rising sea level which led to many problems when integrating.
Accomplishments that we're proud of
We successfully pivoted multiple times. Our very first idea wanted to explore NFL concussions and how they affected a players retirement and when they might expect their next concussion. This would help inform people about the importance of head protection (guardian caps) in sports. After finding out that there are no large public datasets, we decided that we would have to move on a later built a great different project. The chatbot was an accomplishment for the team because no one's ever created this before, and we modified it to only talk about sea level and environmental related topics. This was our first ever datathon, and we spent a lot of time exploring and refining our ideas. We worked swiftly once we had set on an idea and were able to build a successful project.
What we learned
We built understanding in how to find high quality datasets through conducting exploratory data analysis. We worked with many technologies that we were not familiar with prior to the start of the datathon. We learned how to use SingleStore to aggregate data and clean it by removing dataset specific outliers. We grasped understanding in the different types of linear regression models like ridge and lasso regression. We learned how to use the Google Maps API to retrieve elevation data from location. We gained valuable hands-on experience in data science techniques, tools, and real-world applications while an important environmental issue.
What's next for Sea Level Predictor
For the future, we want to implement more features that allow users to interact and understand how emissions and climate change may directly affect them. We want users to see how parameters like carbon-dioxide and methane emissions can affect sea level rise. Showing how a decrease in amount of gas-powered cars and coal power plants can lead to a decrease in the rate of sea level change would be optimal to inform users on how they can make changes and lobby elected officials to enact greener initiatives.
Built With
- css
- flask
- groq
- html
- leaflet.js
- machine-learning
- numpy
- openstreetmap
- pandas
- python
- scikit
- scikit-learn
- singlestore
- streamlit


Log in or sign up for Devpost to join the conversation.