-
-
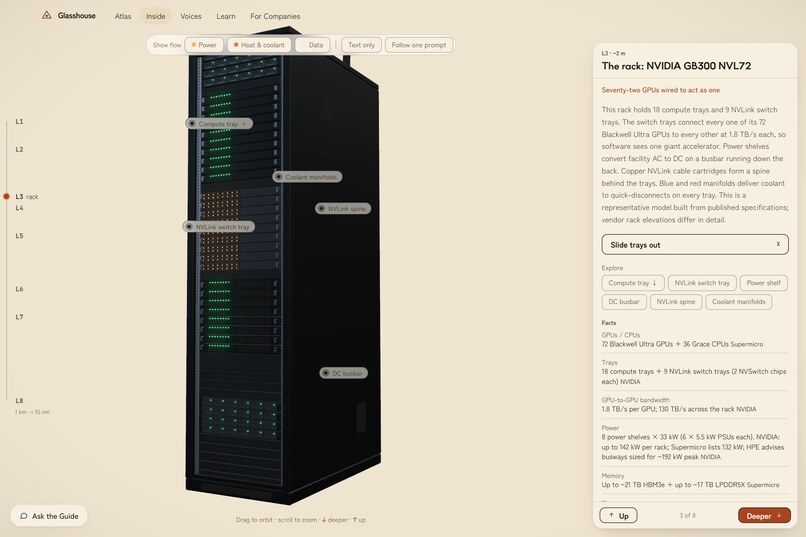
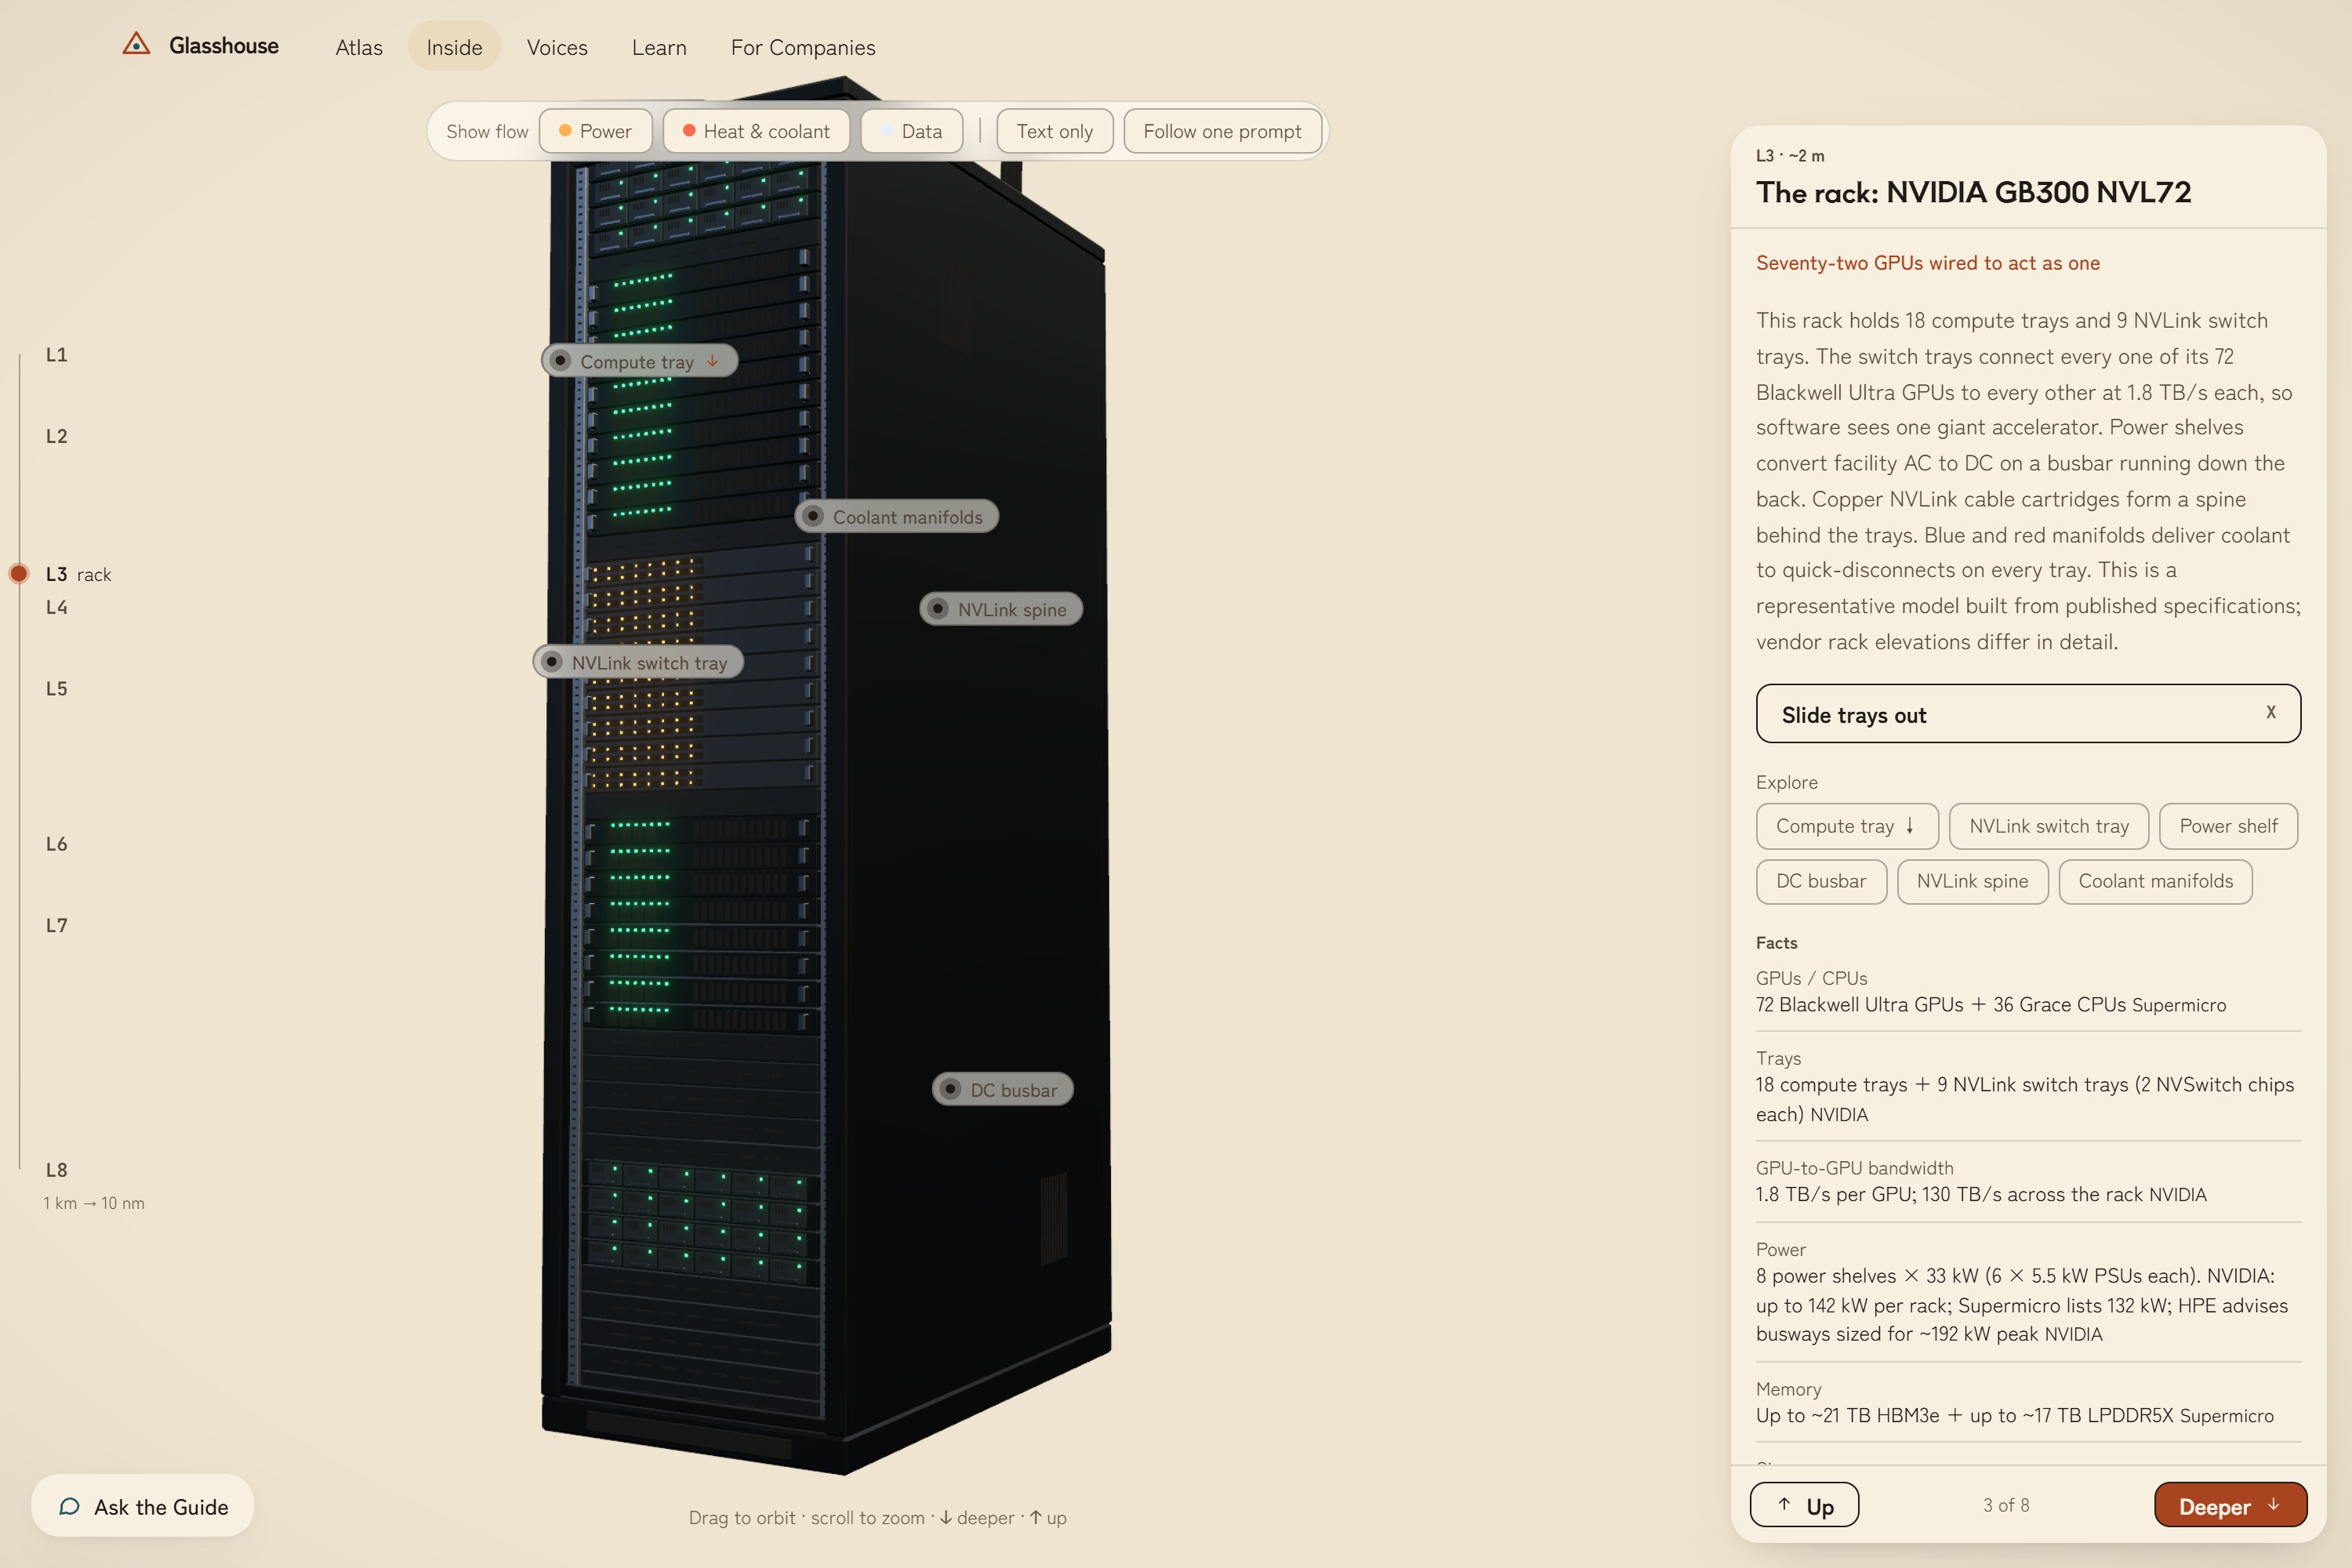
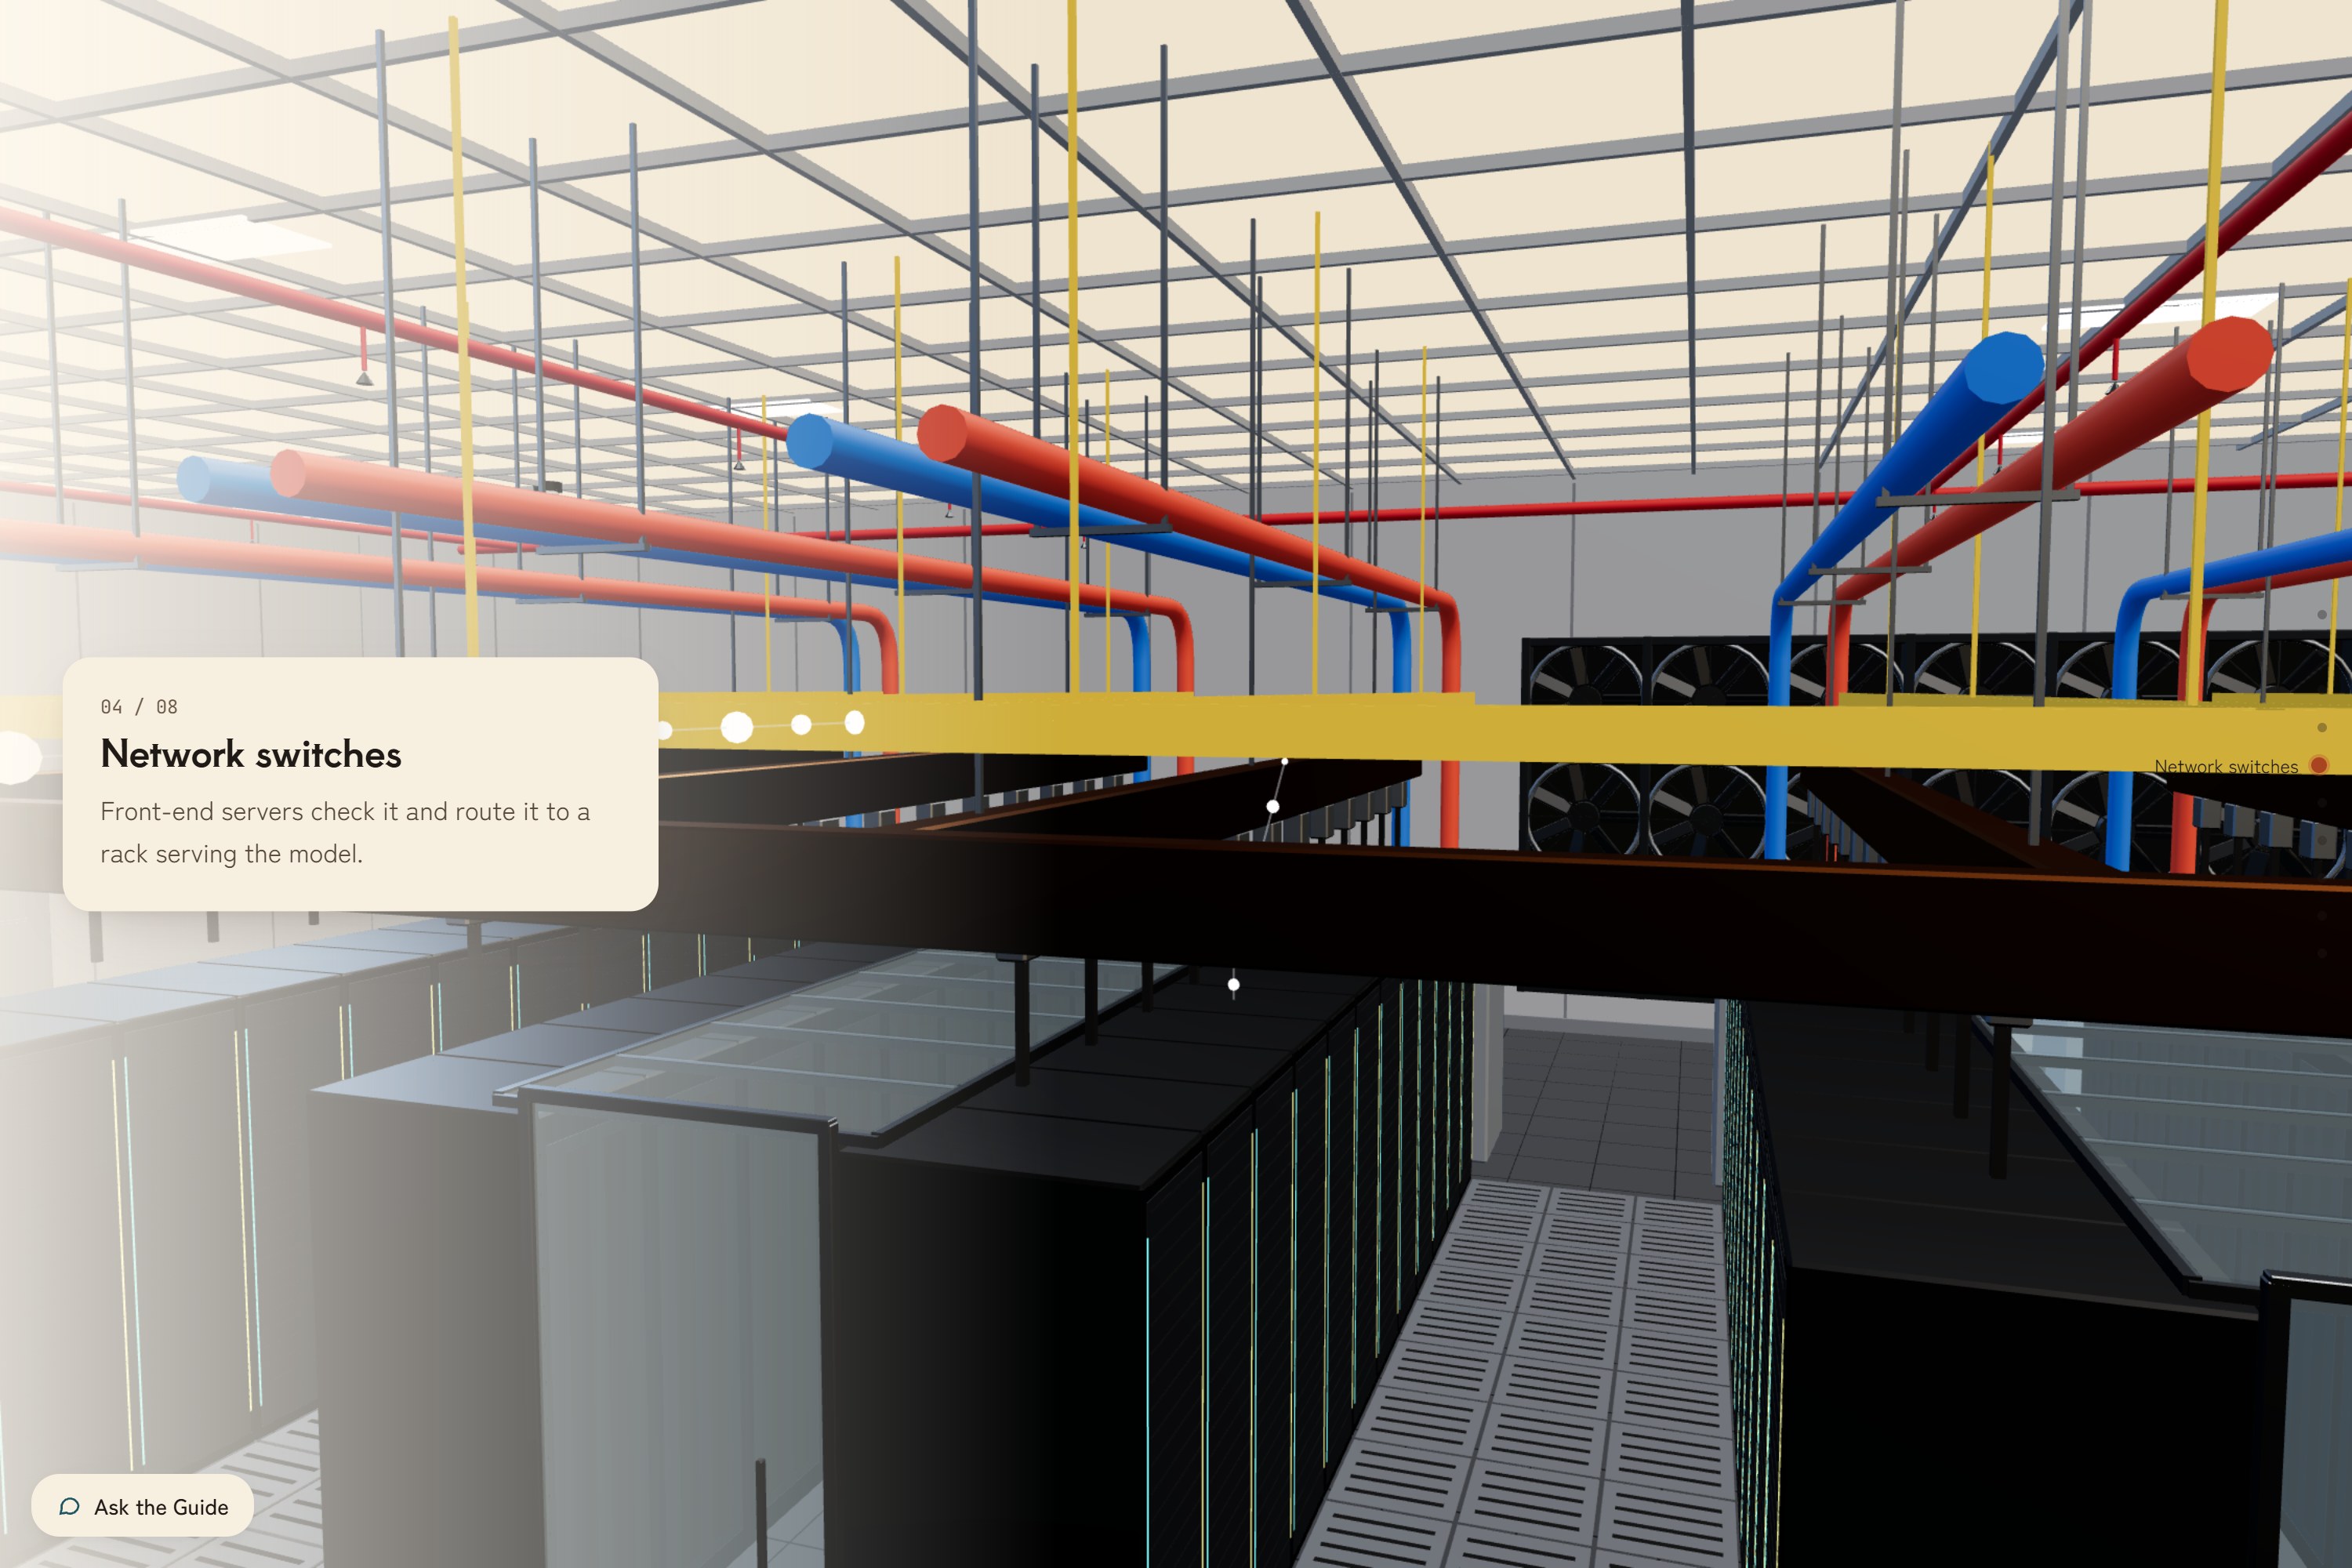
3d view server rack page
-
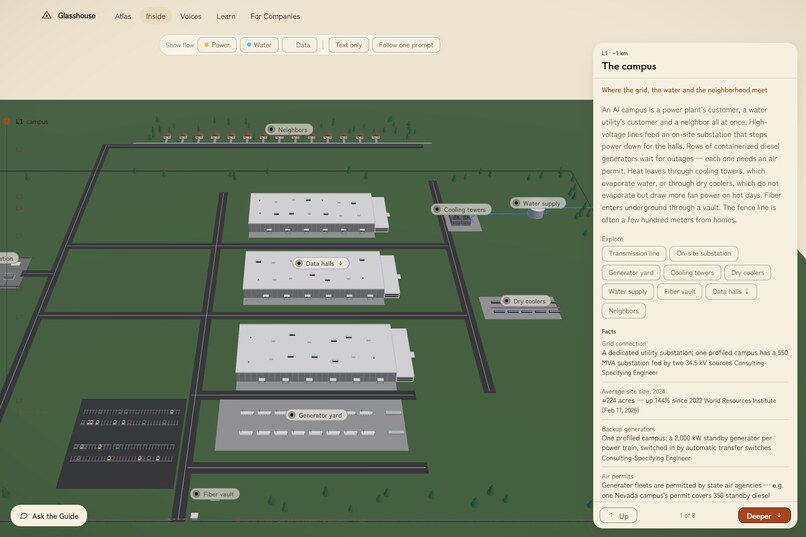
3d view campus page
-
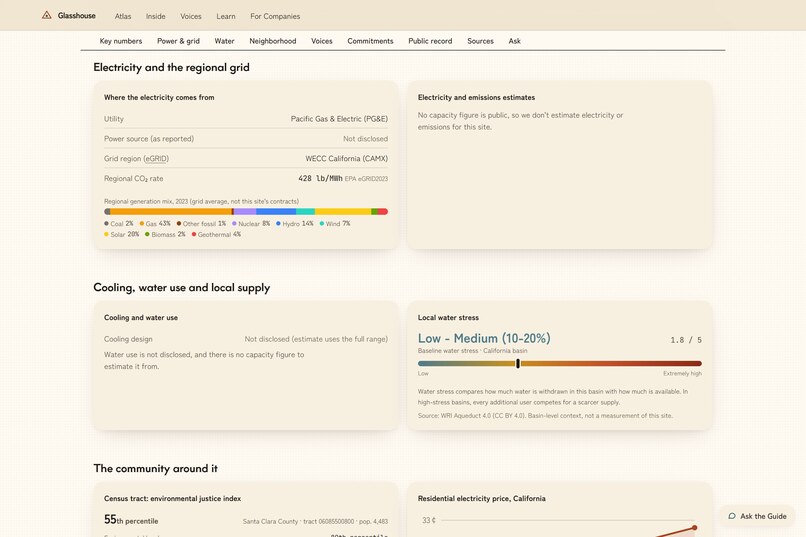
information about that data center
-
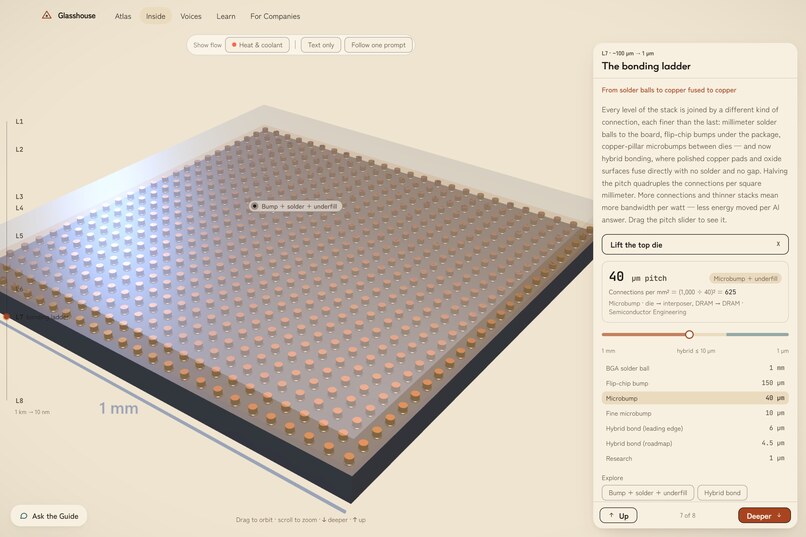
3d view interconnect page
-
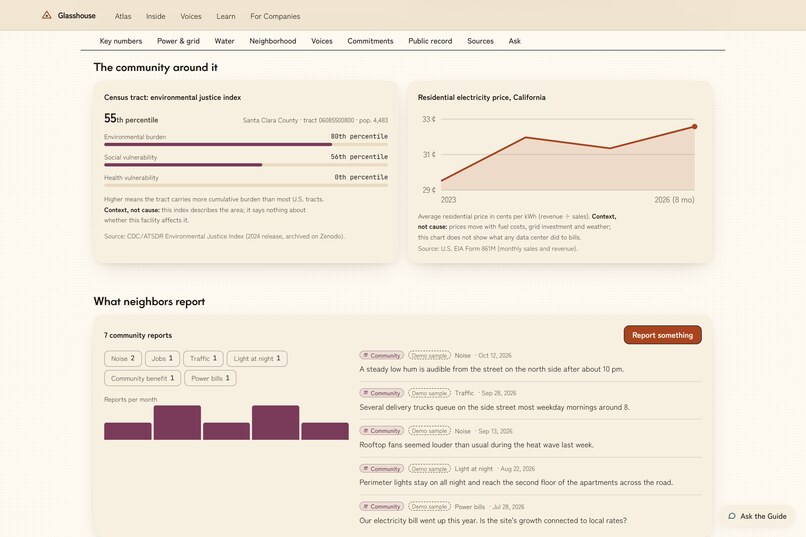
information about that data center 2
-
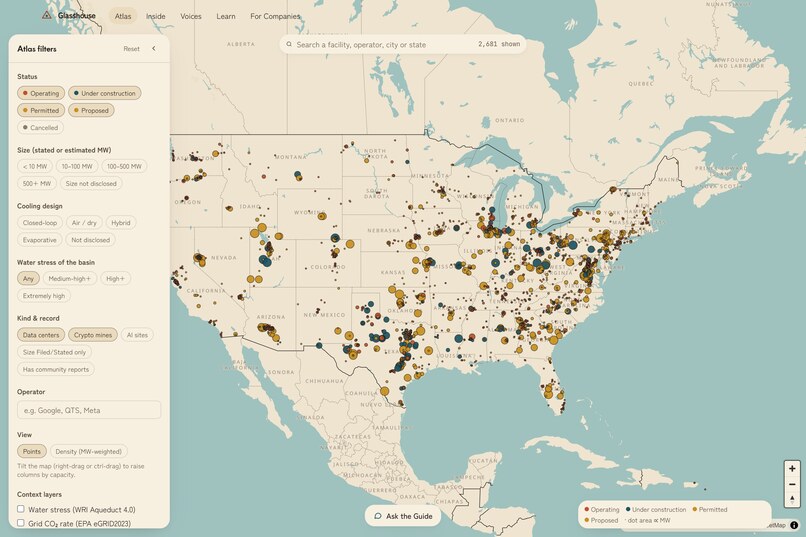
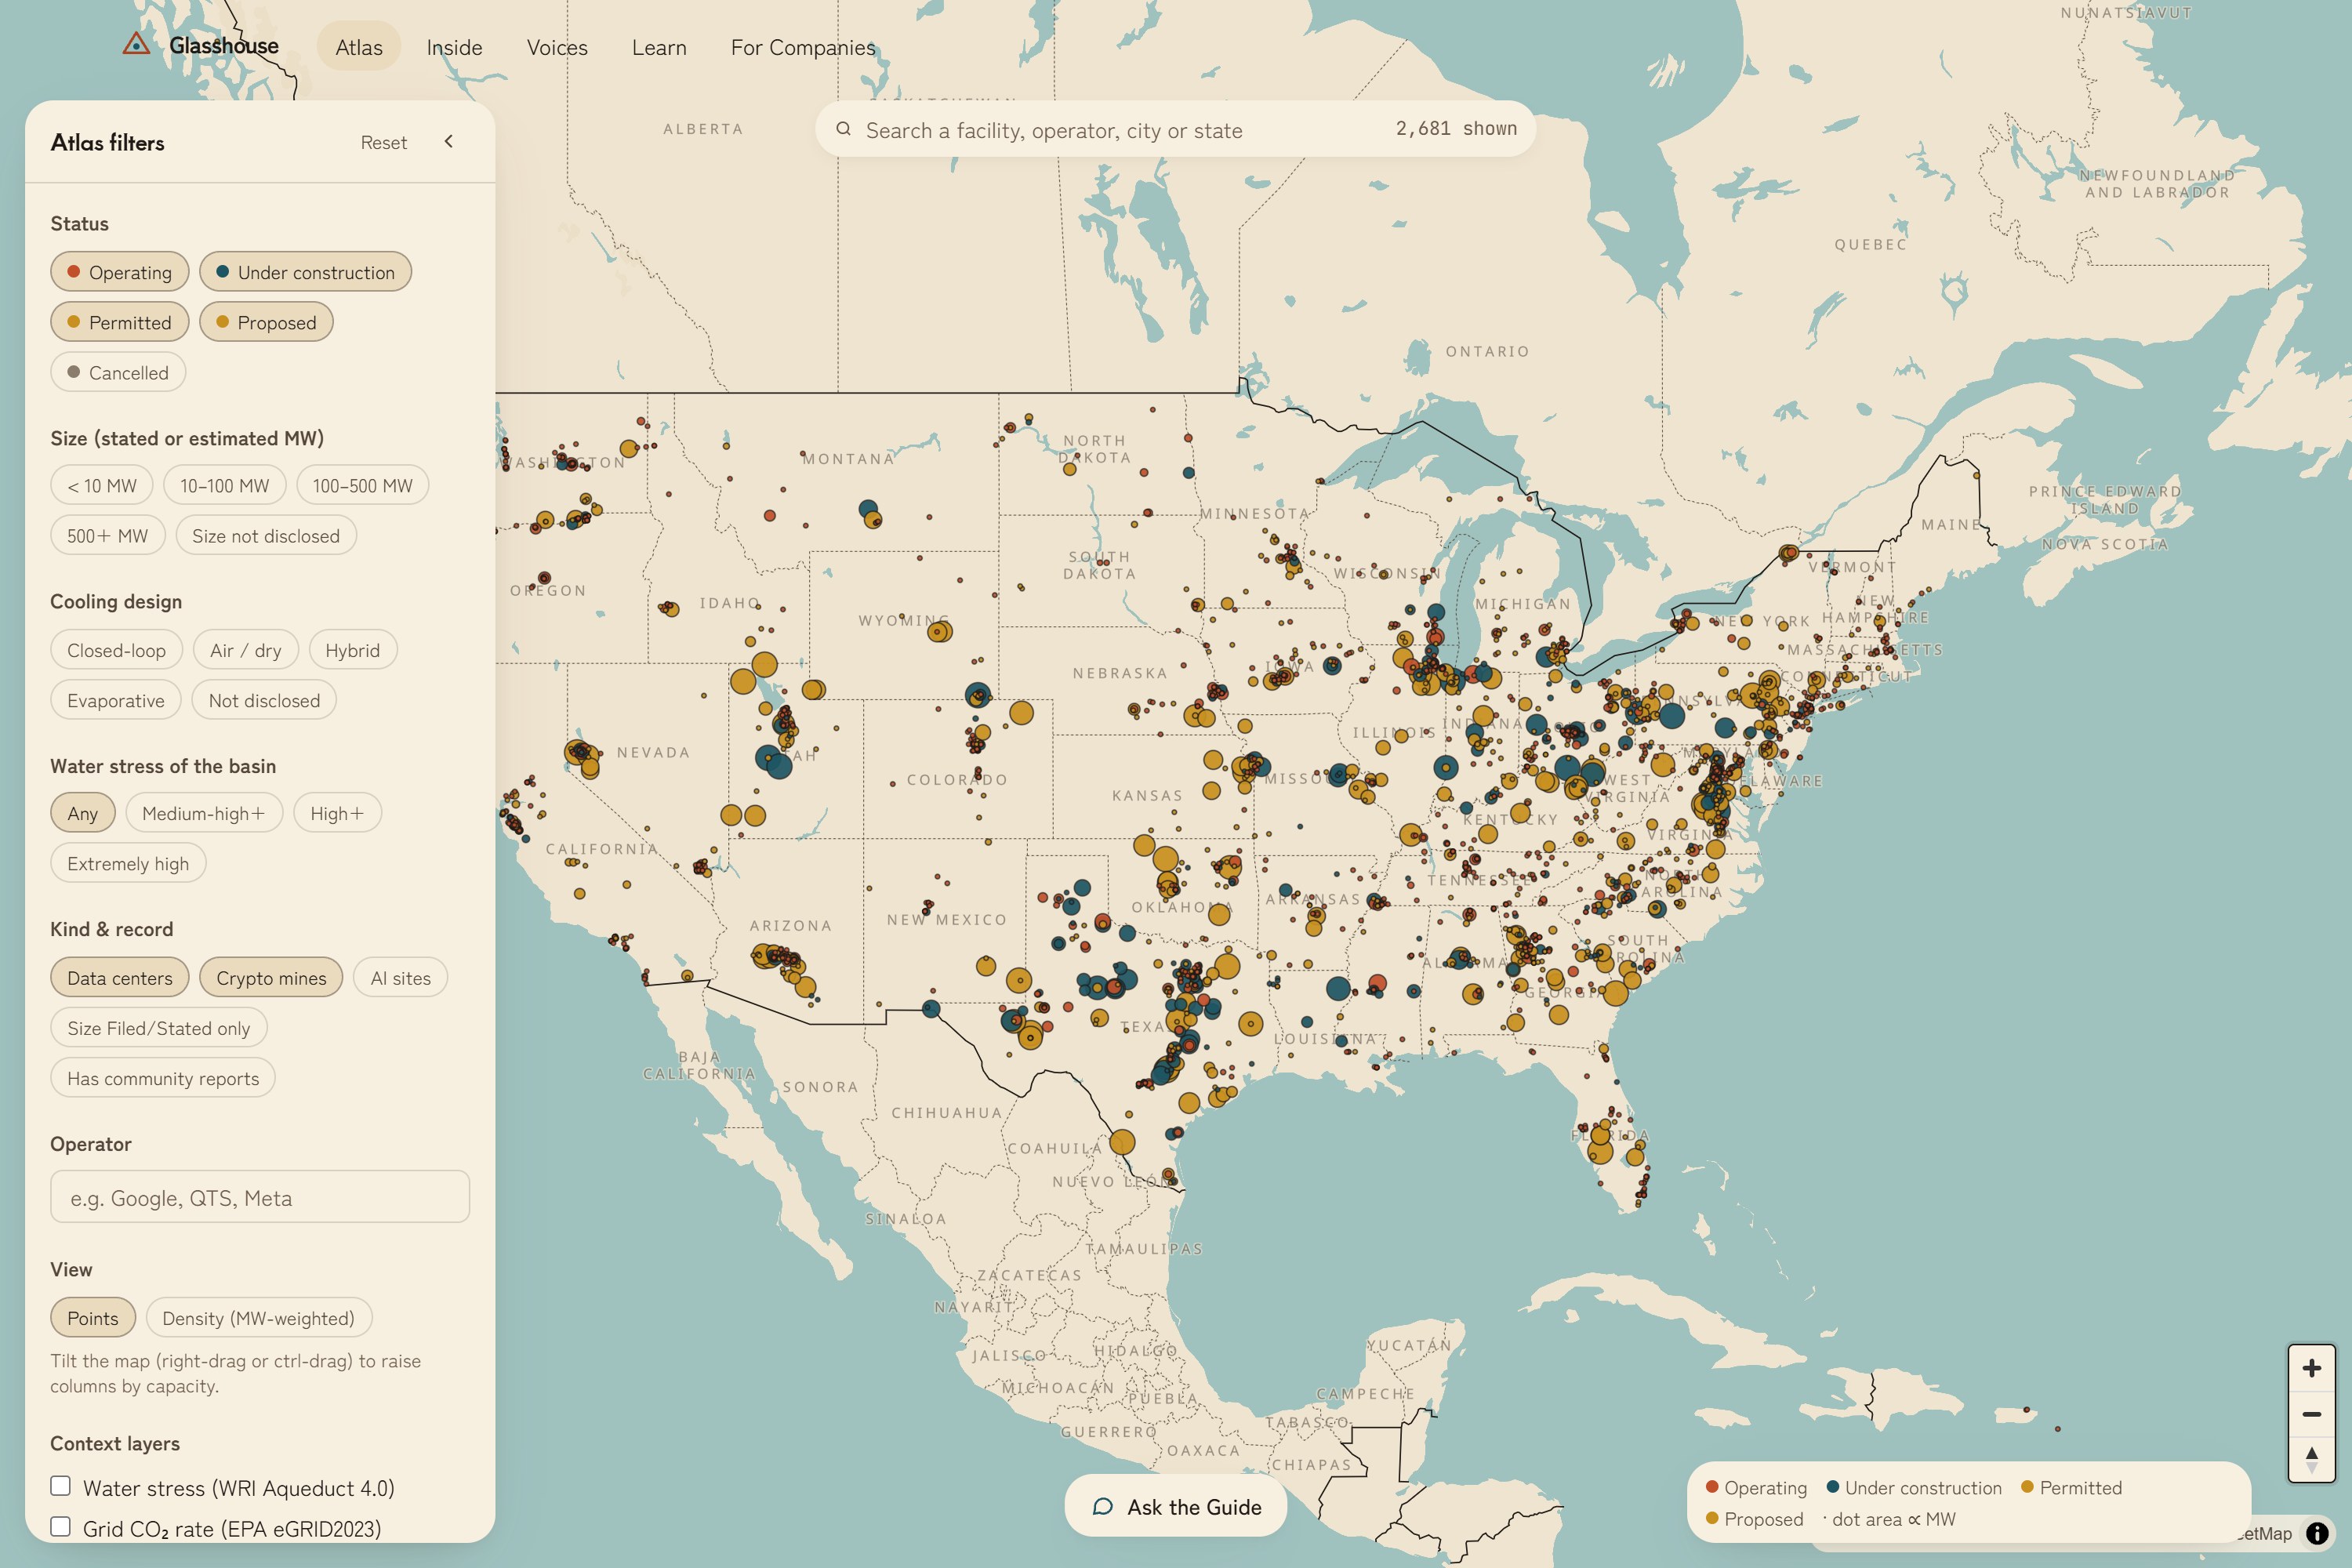
atlas map
-
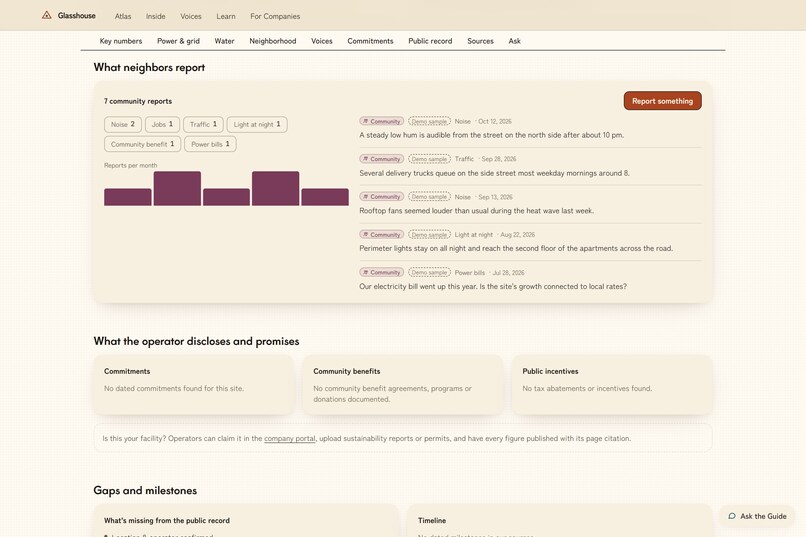
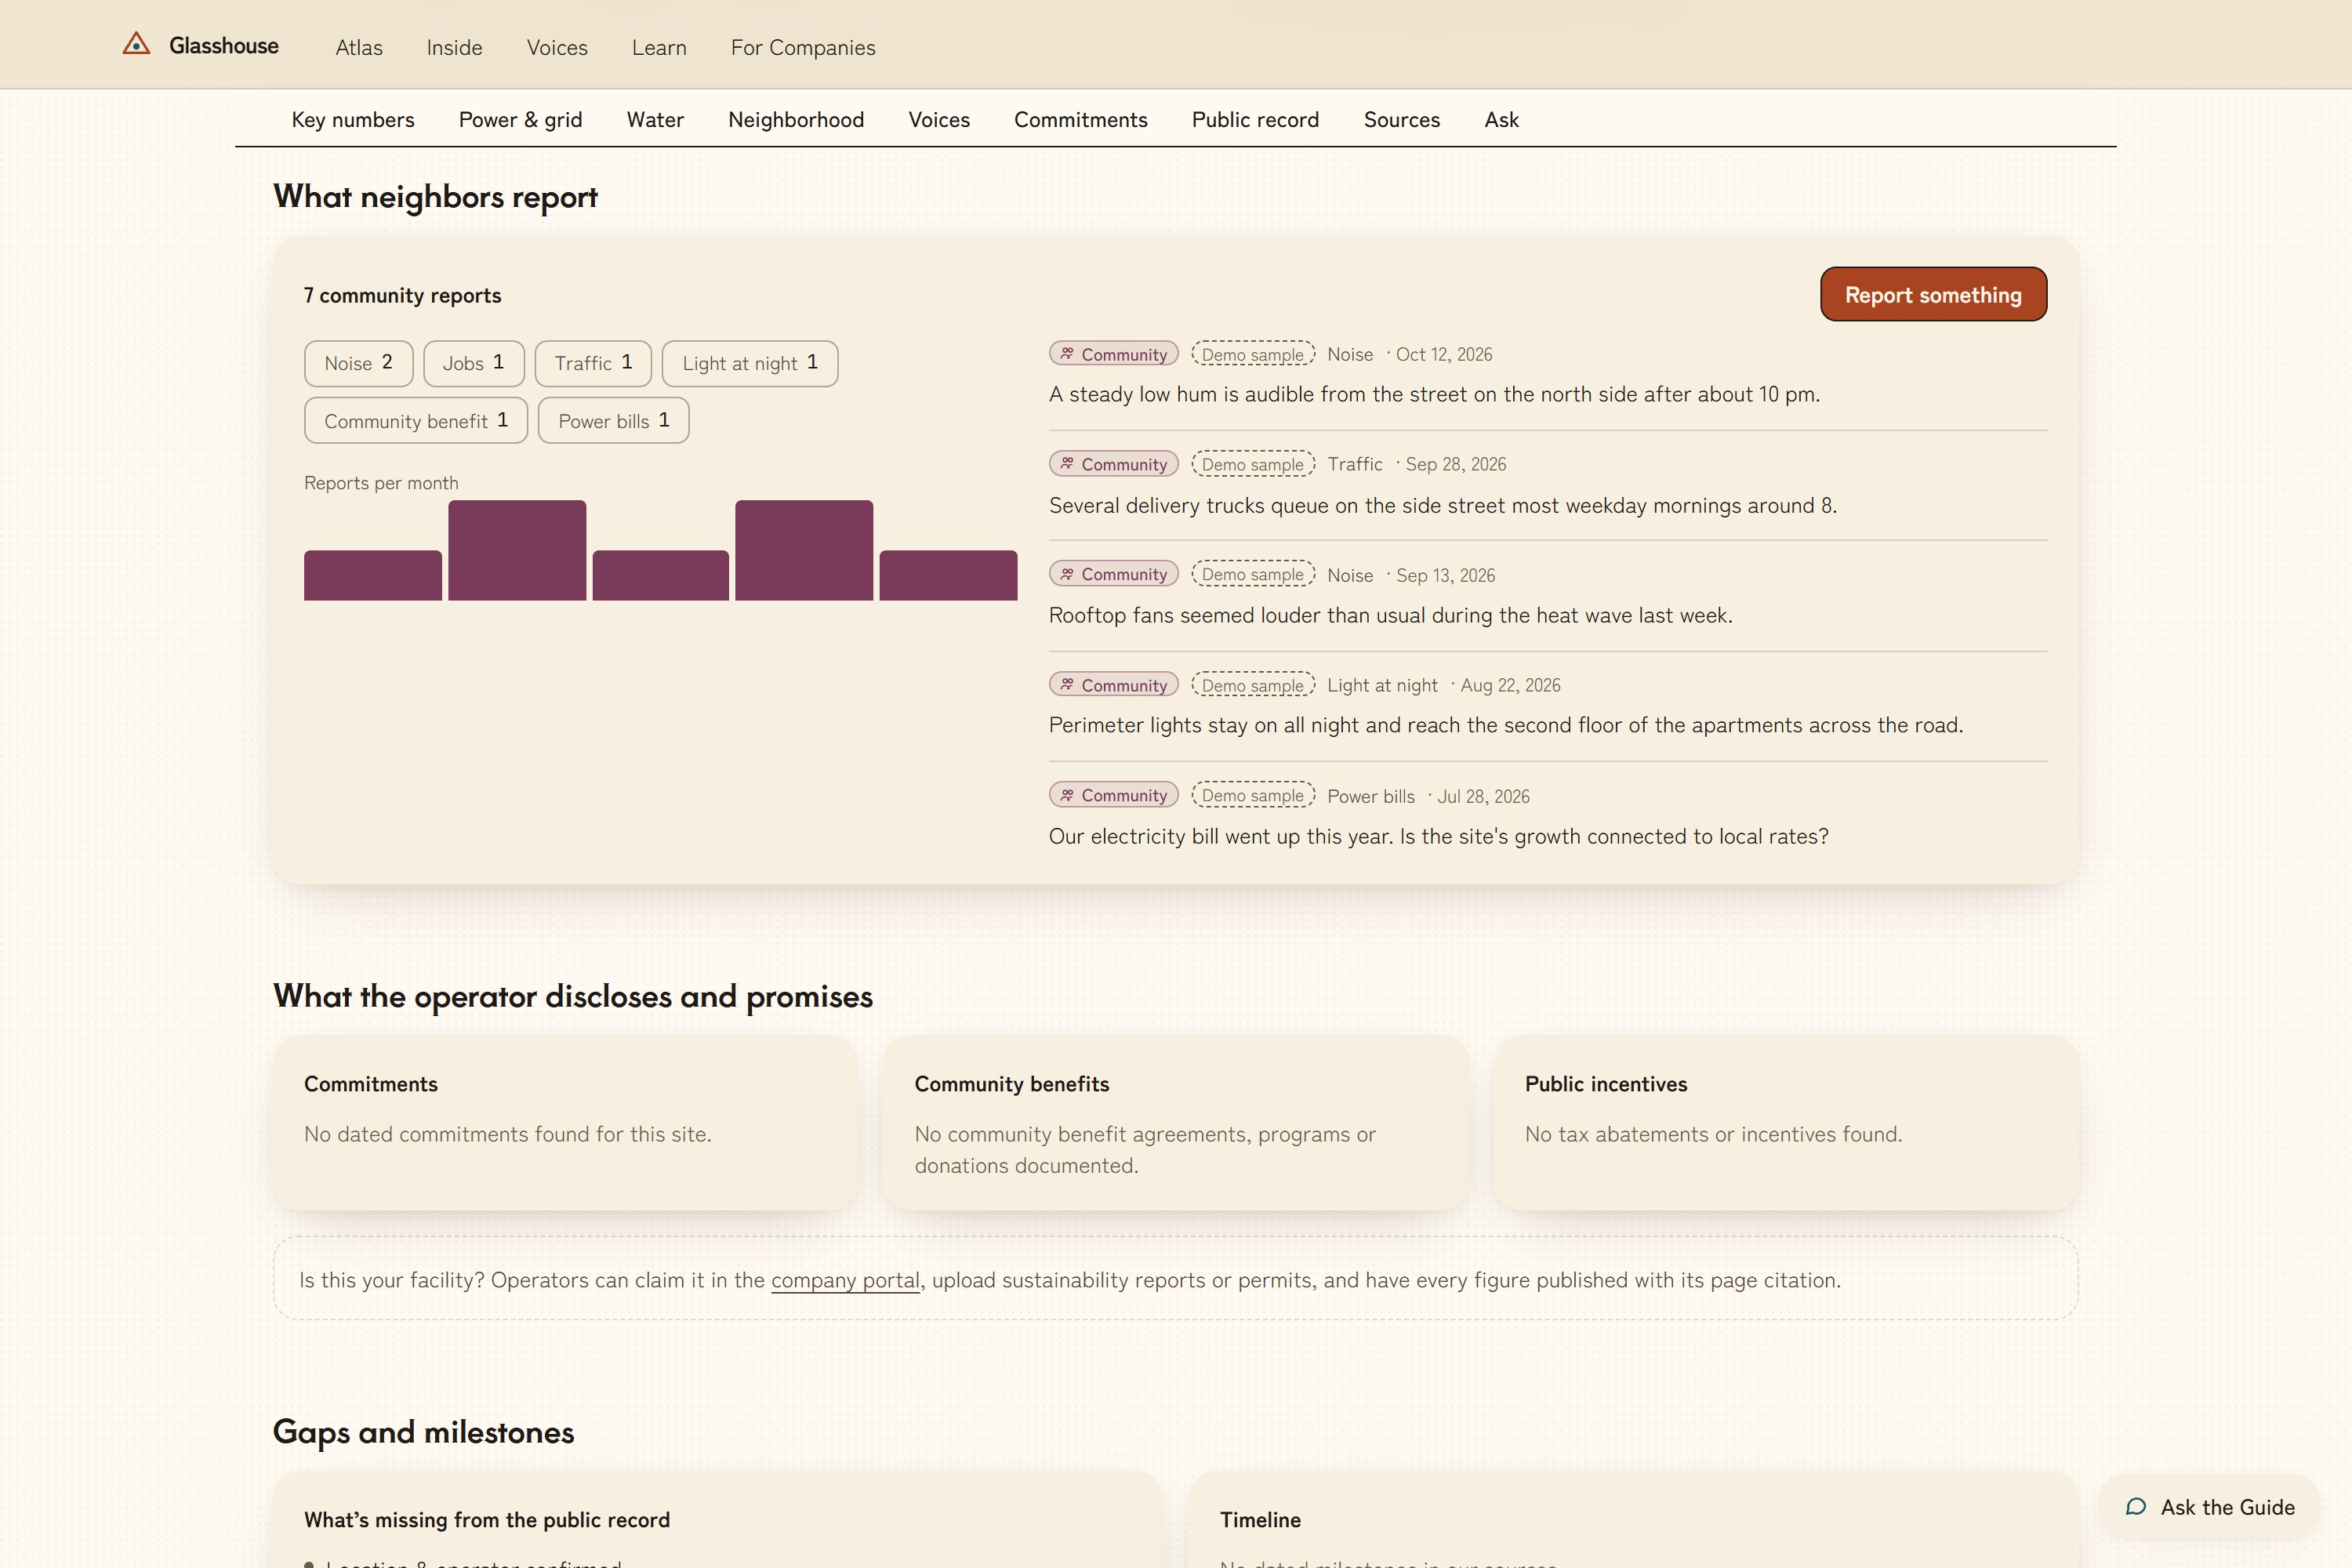
information about that data center 3
-
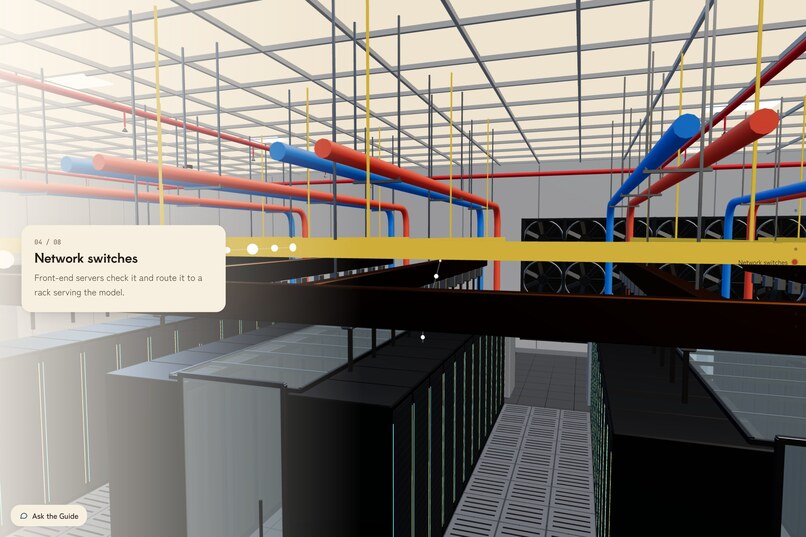
3d view server room center
-
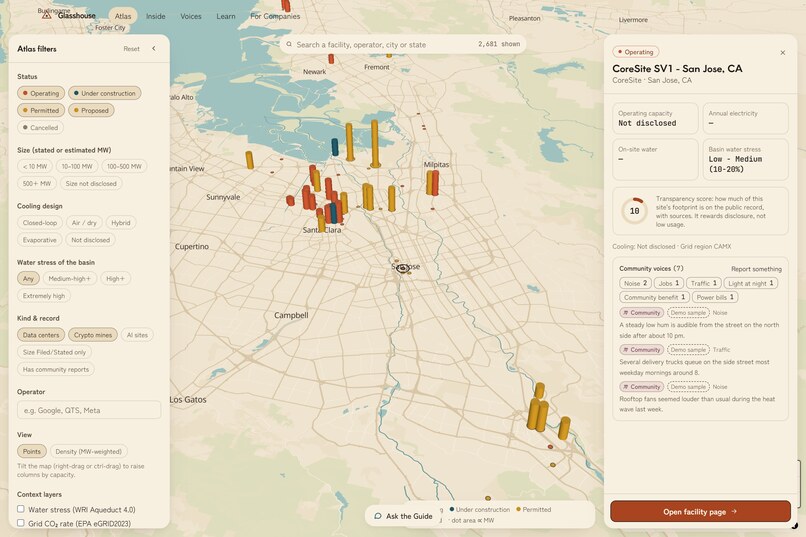
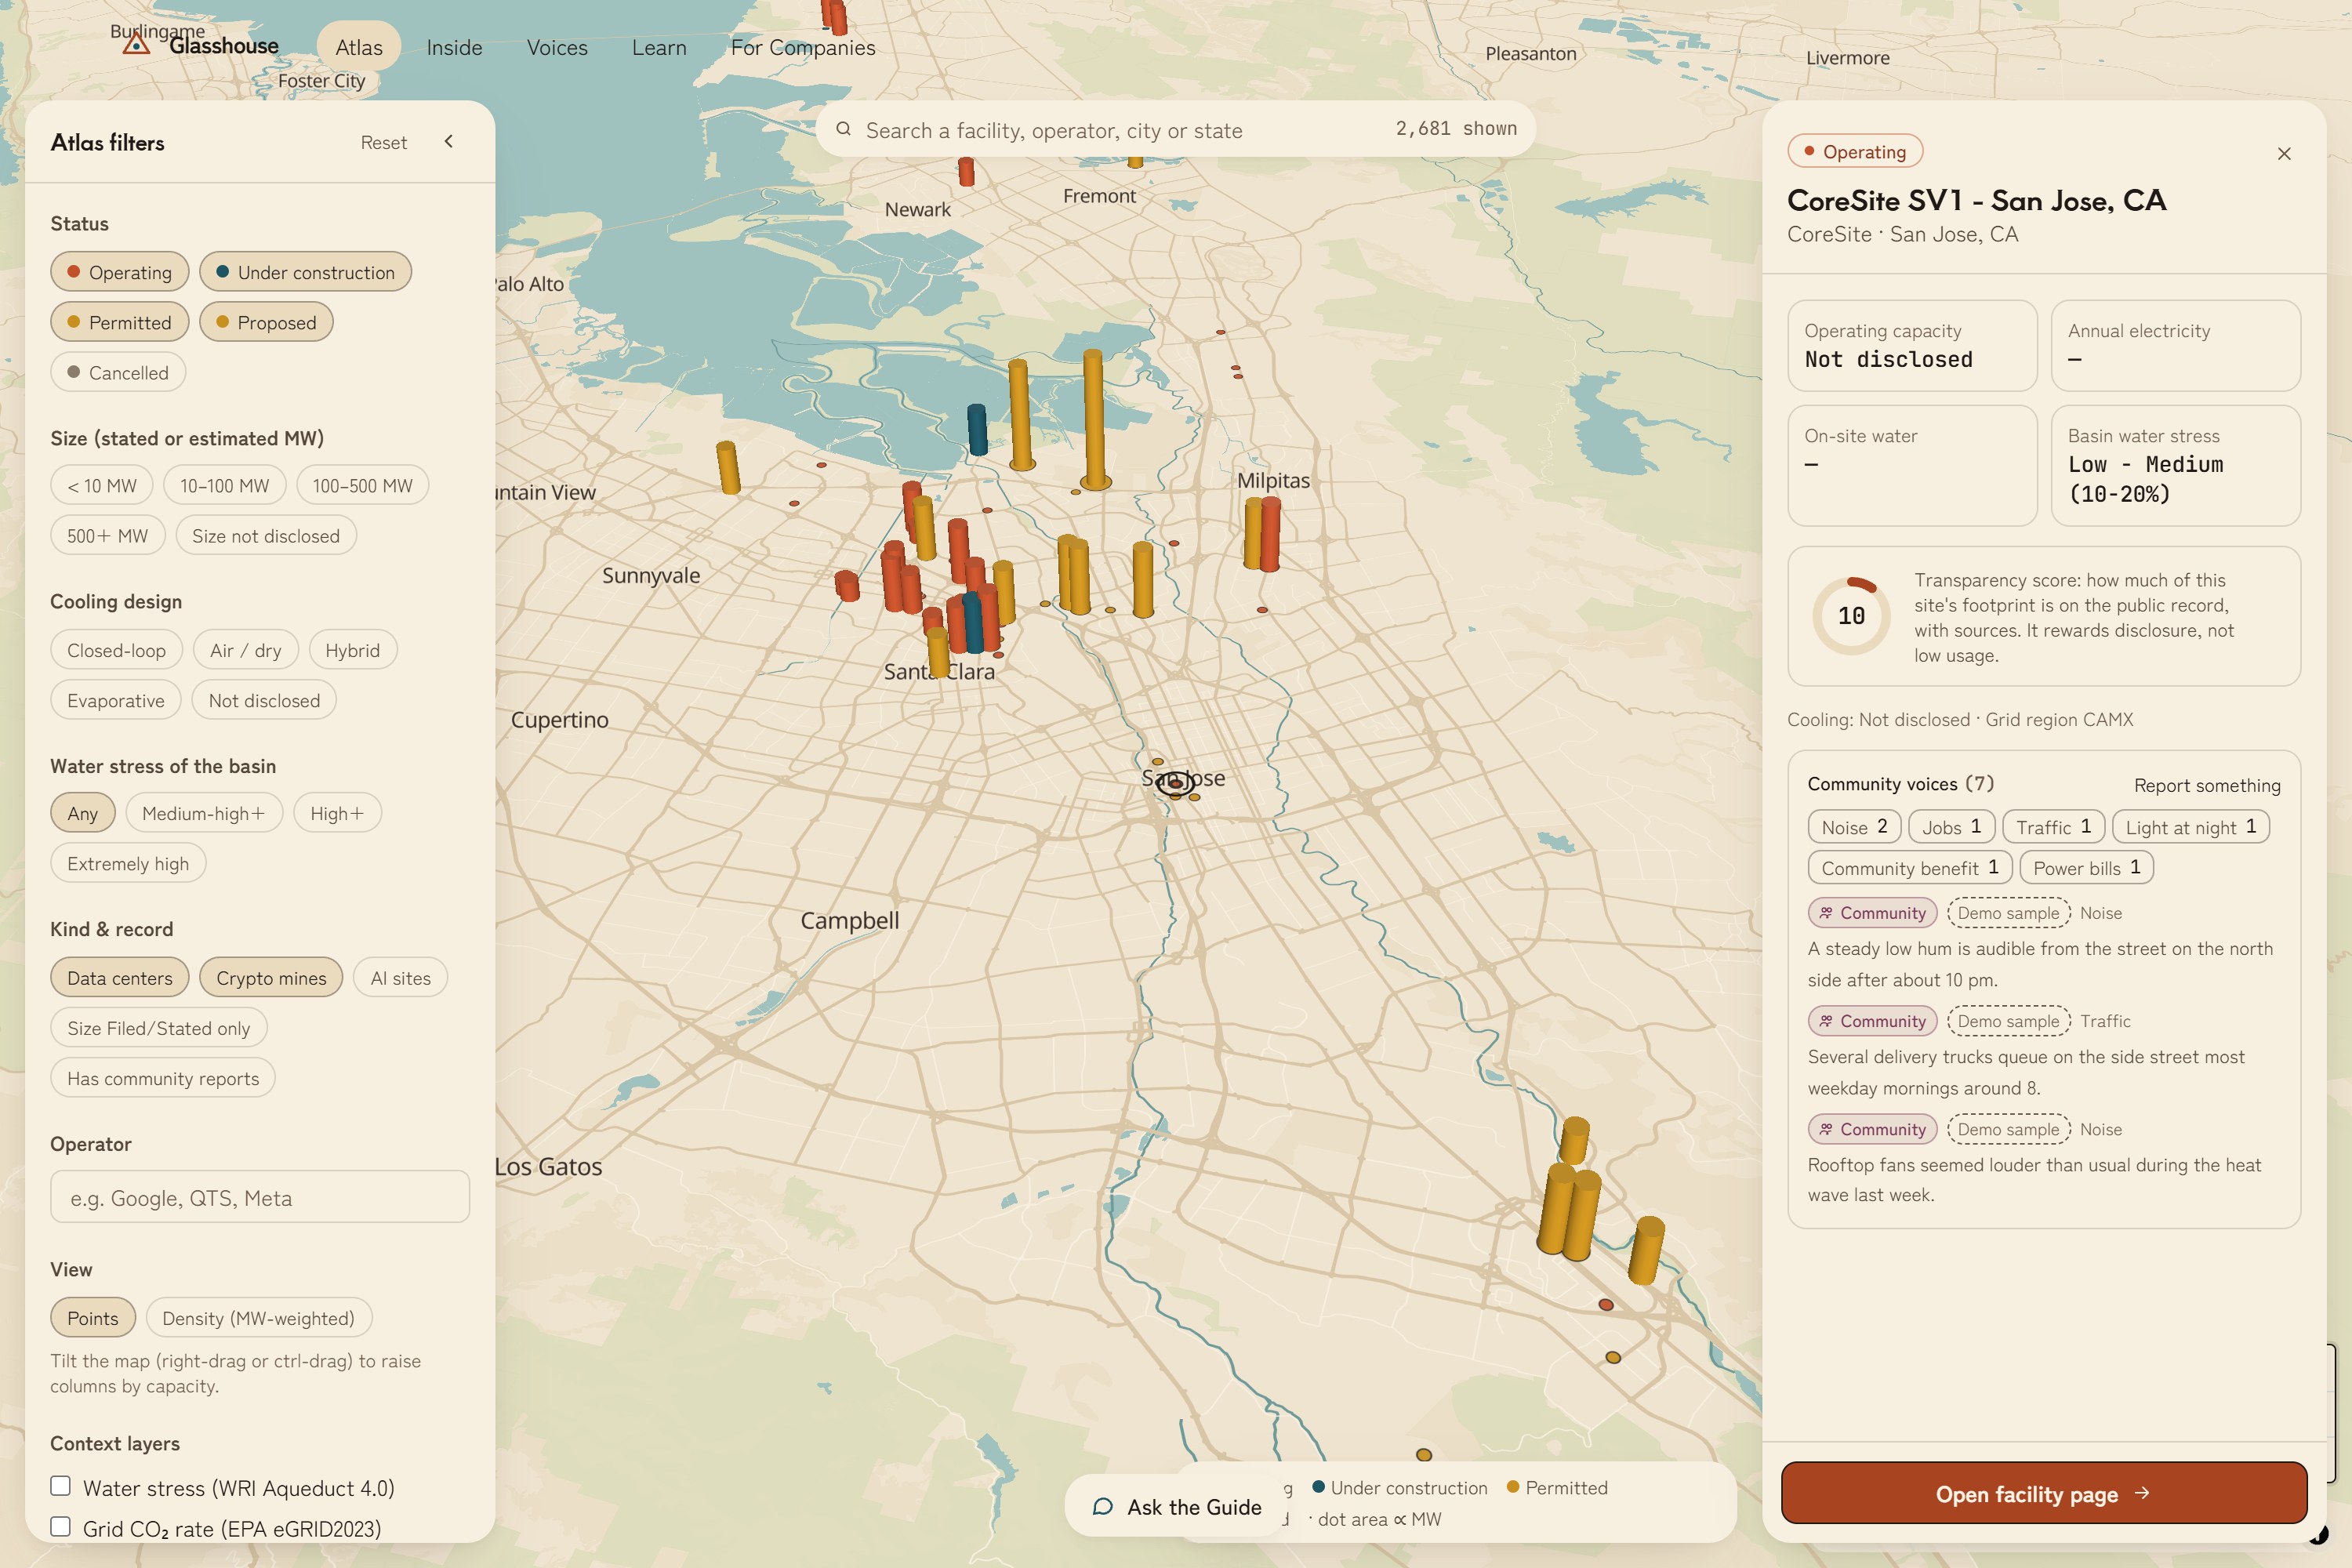
atlas map on a city region
-
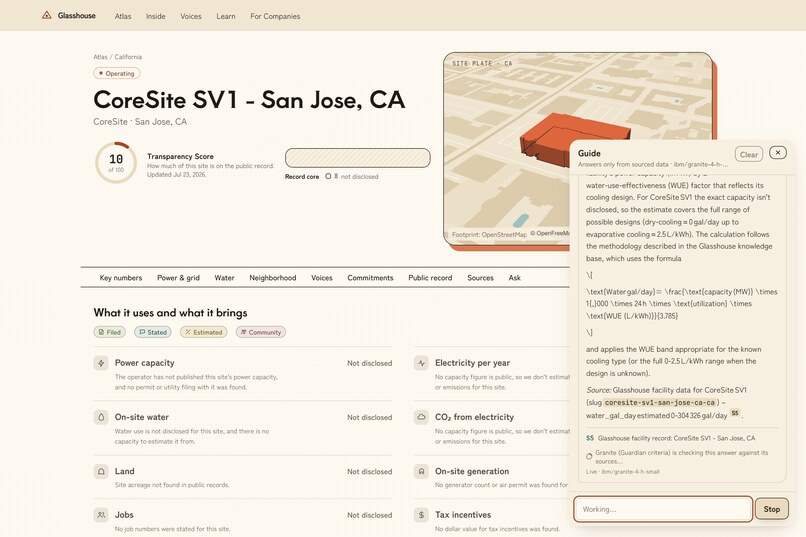
using the ai assistant on the data center page
-
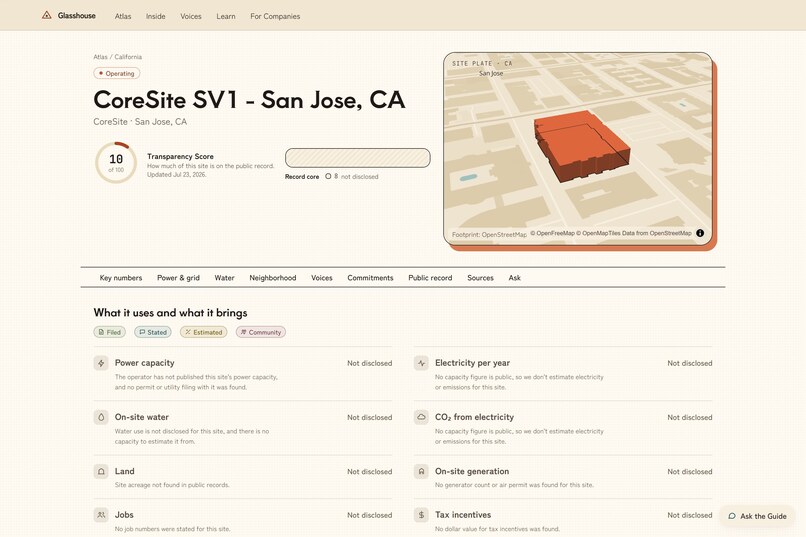
an ai data center in san jose
-
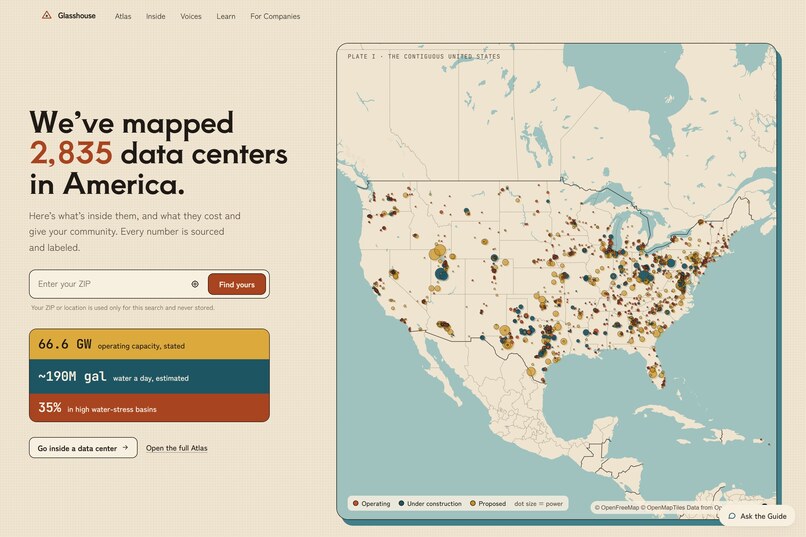
landing page
-
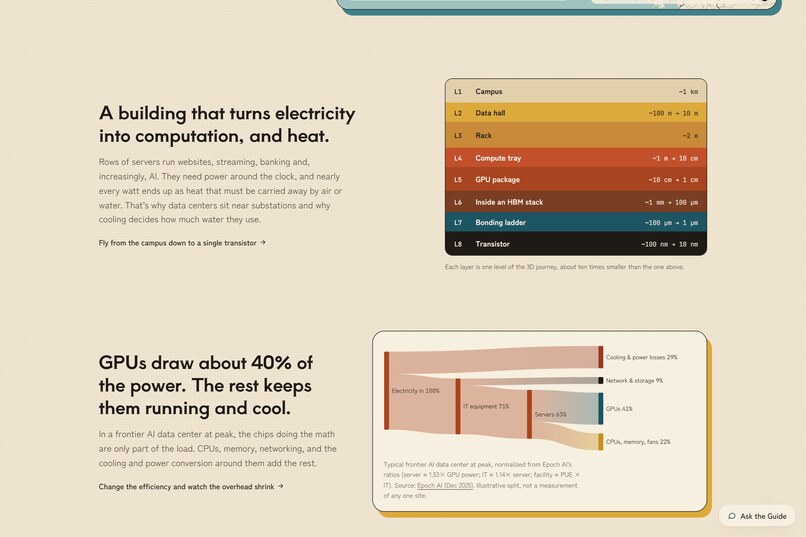
down on landing page
-
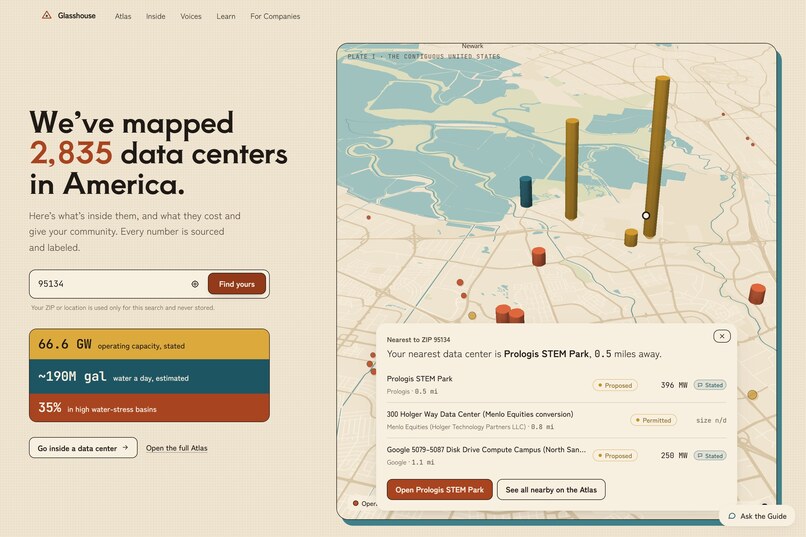
selecting location
-
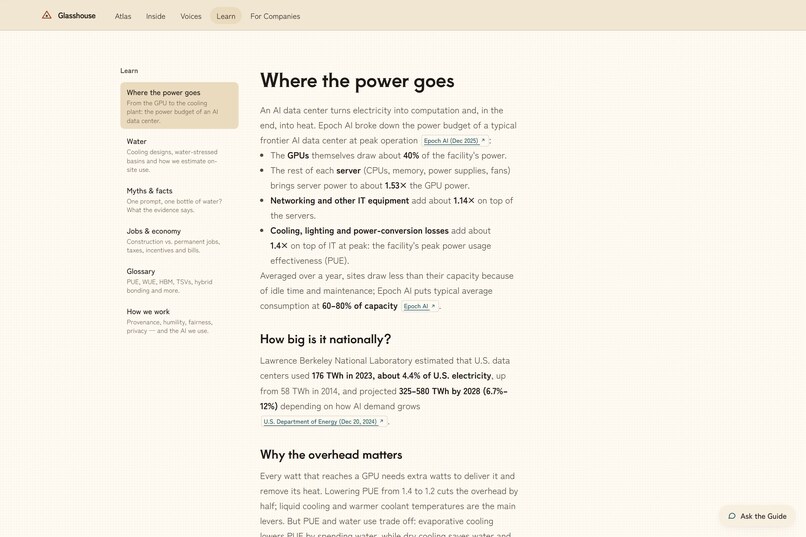
learn page
Inspiration
Data centers are one of the most argued-about things being built in America right now, and most of the argument happens without facts. Online you mostly hear about water and power bills. Nobody wants one next door. Some of that backlash is fair, but a lot of it comes from not knowing. Most people don't know what an AI data center does, how much it really uses, or whether it gives anything back.
The information that does exist is scattered across city permits, utility filings, grid queues, tax abatements and press releases. No single place is complete, sourced, readable by a normal person, and open to both residents and the companies themselves. Operators have the opposite problem: they have no neutral place to show what they disclose, or to see how to improve. Glasshouse is that place.
What it does
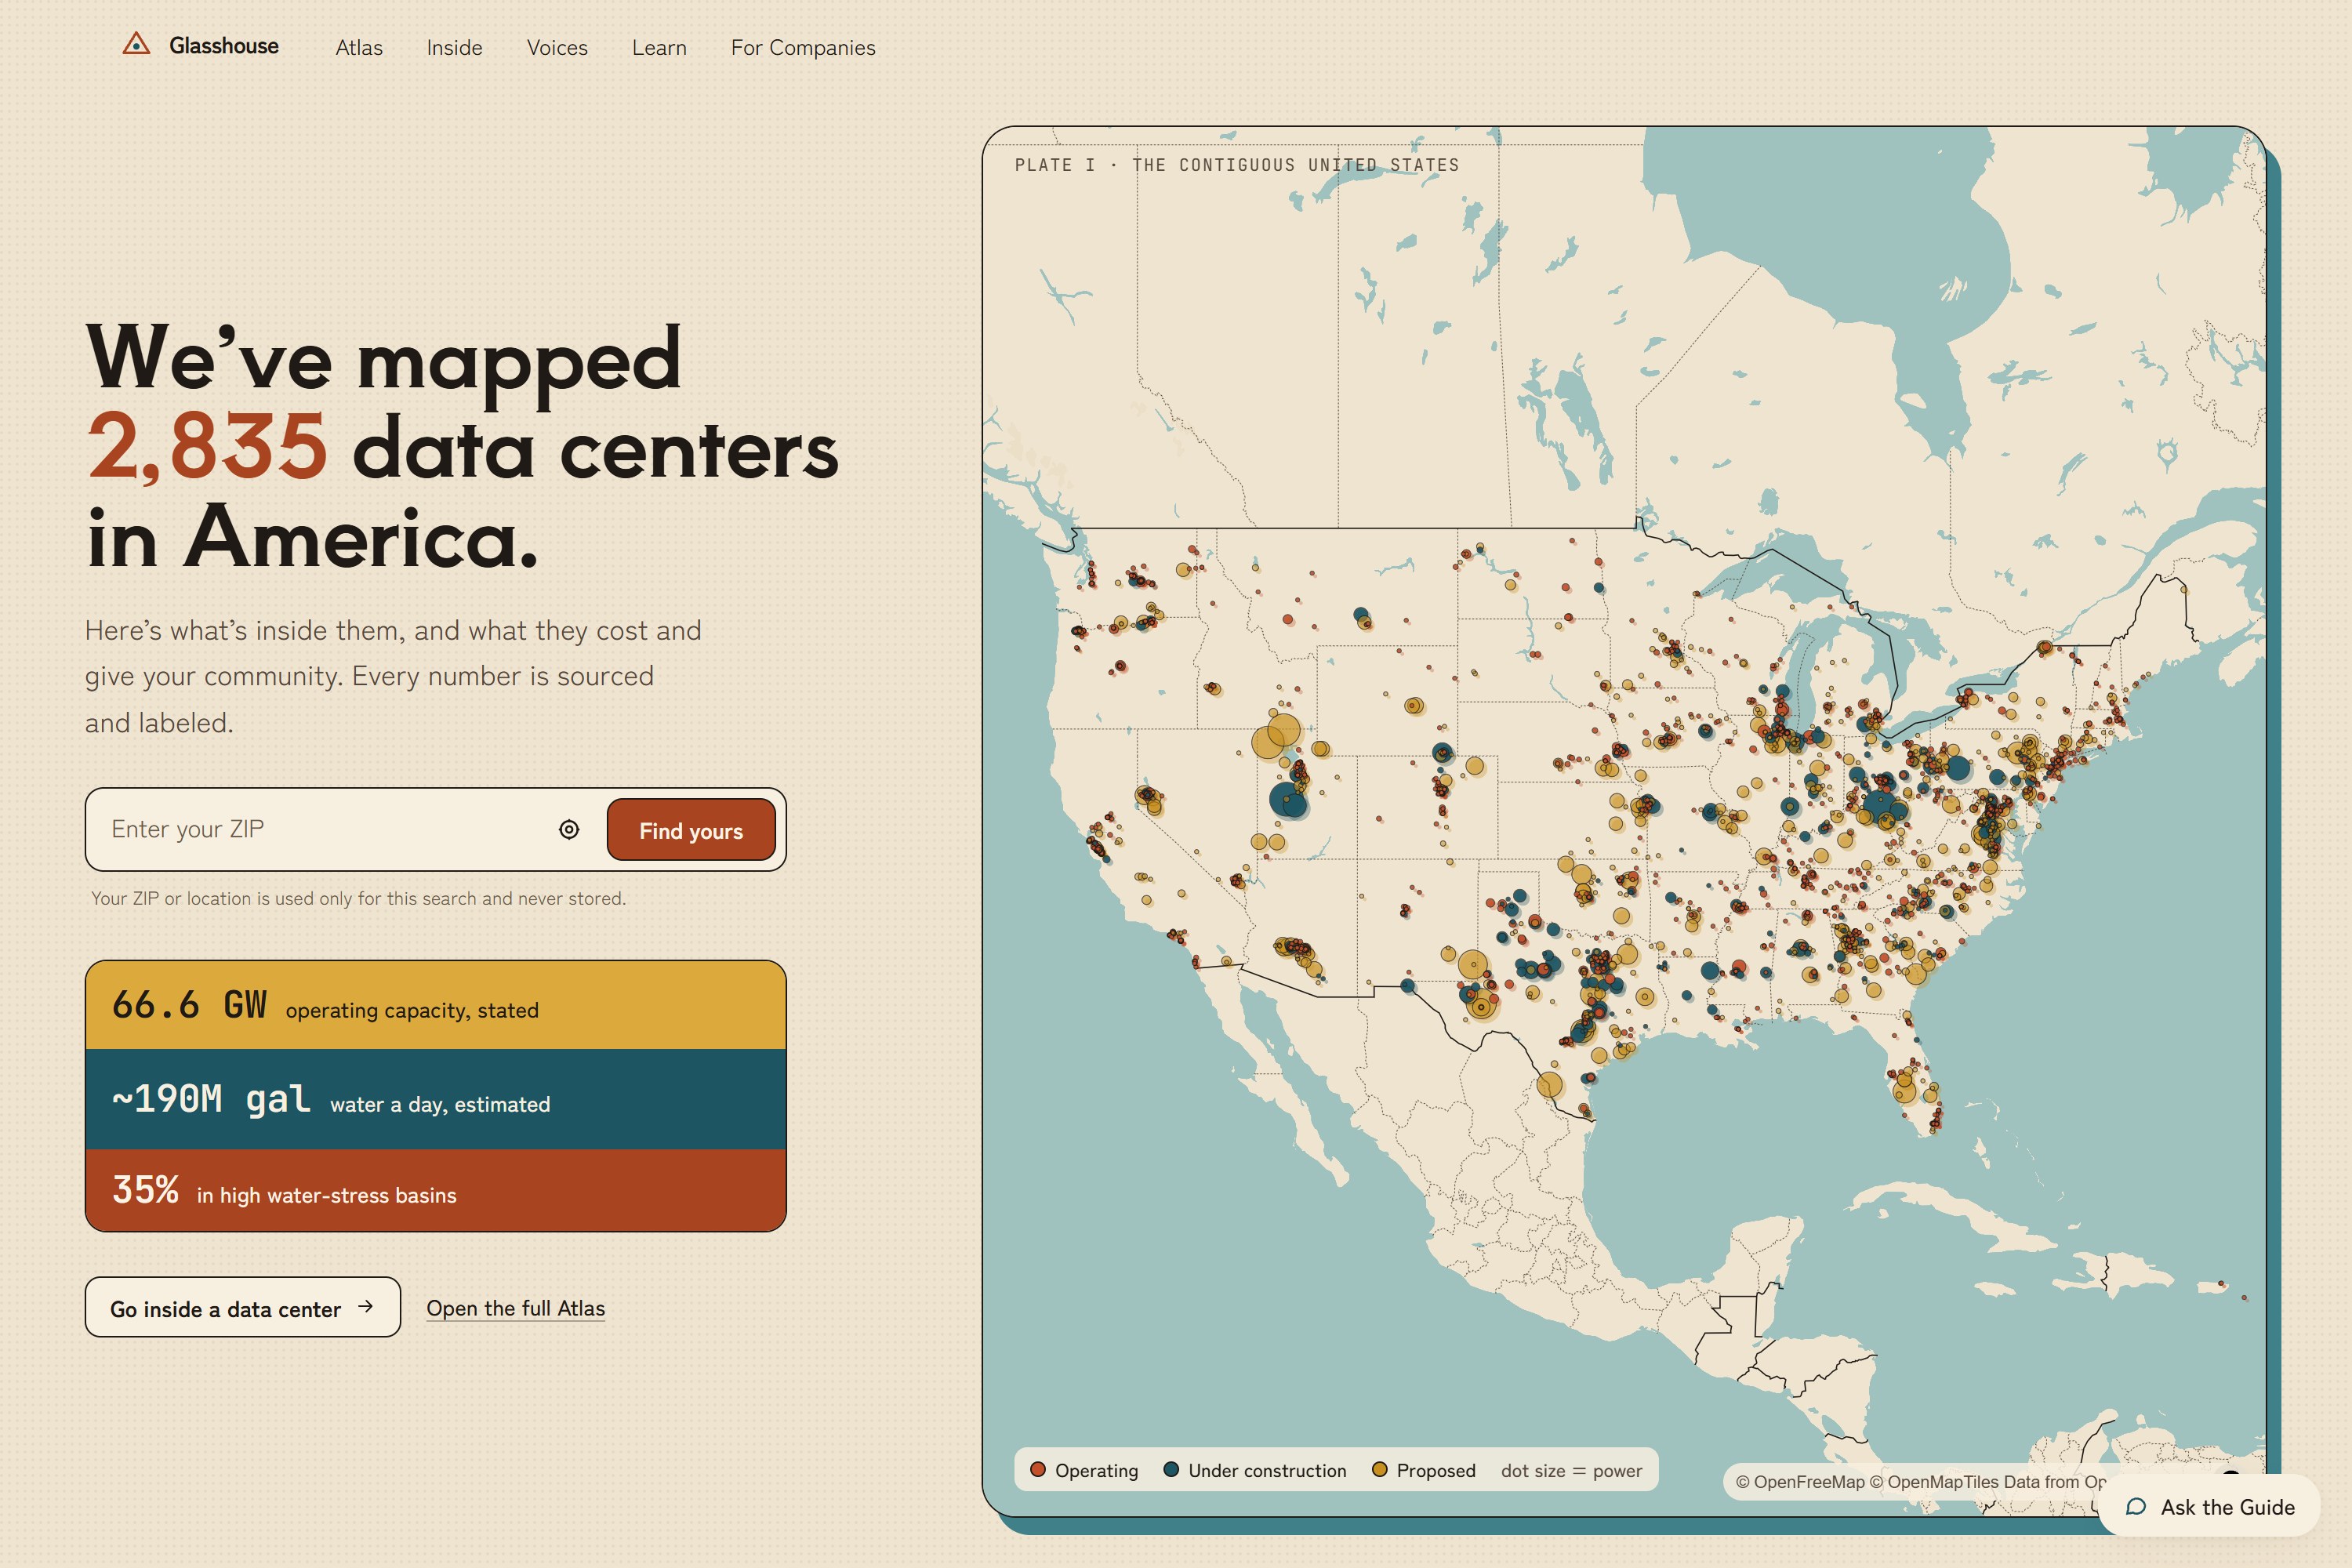
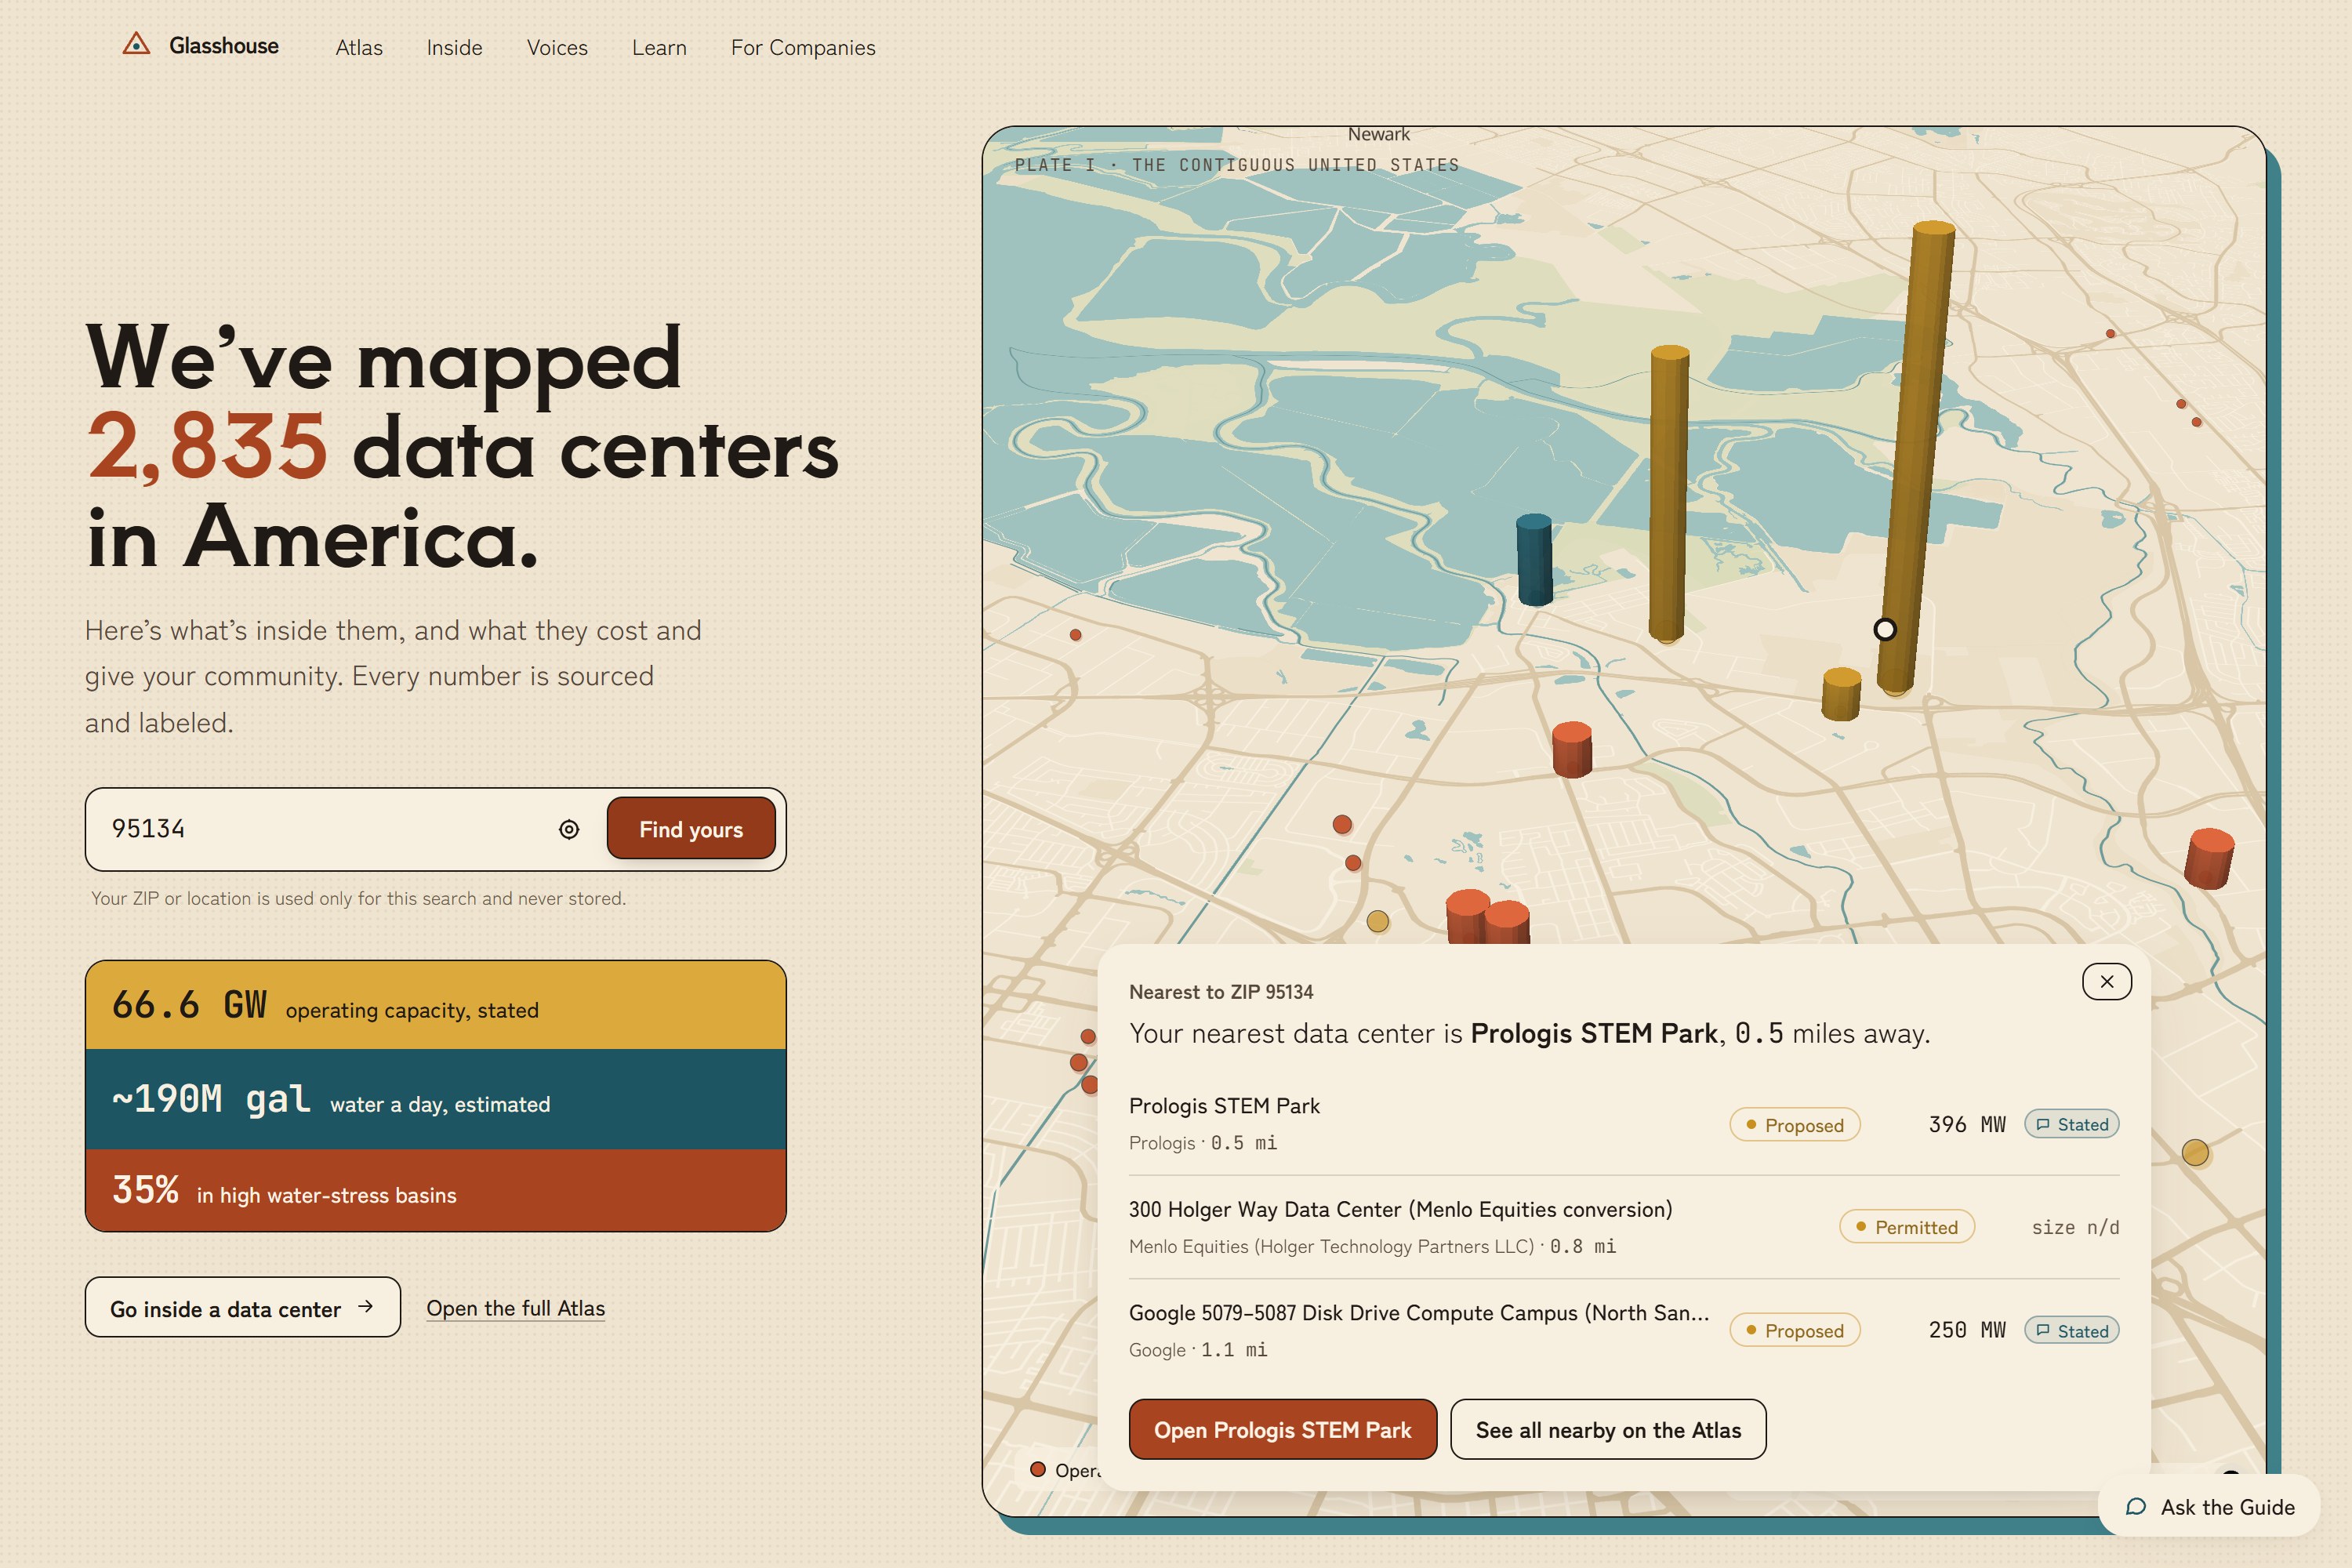
Glasshouse is a free, public web service covering 2,835 data centers across the contiguous U.S.
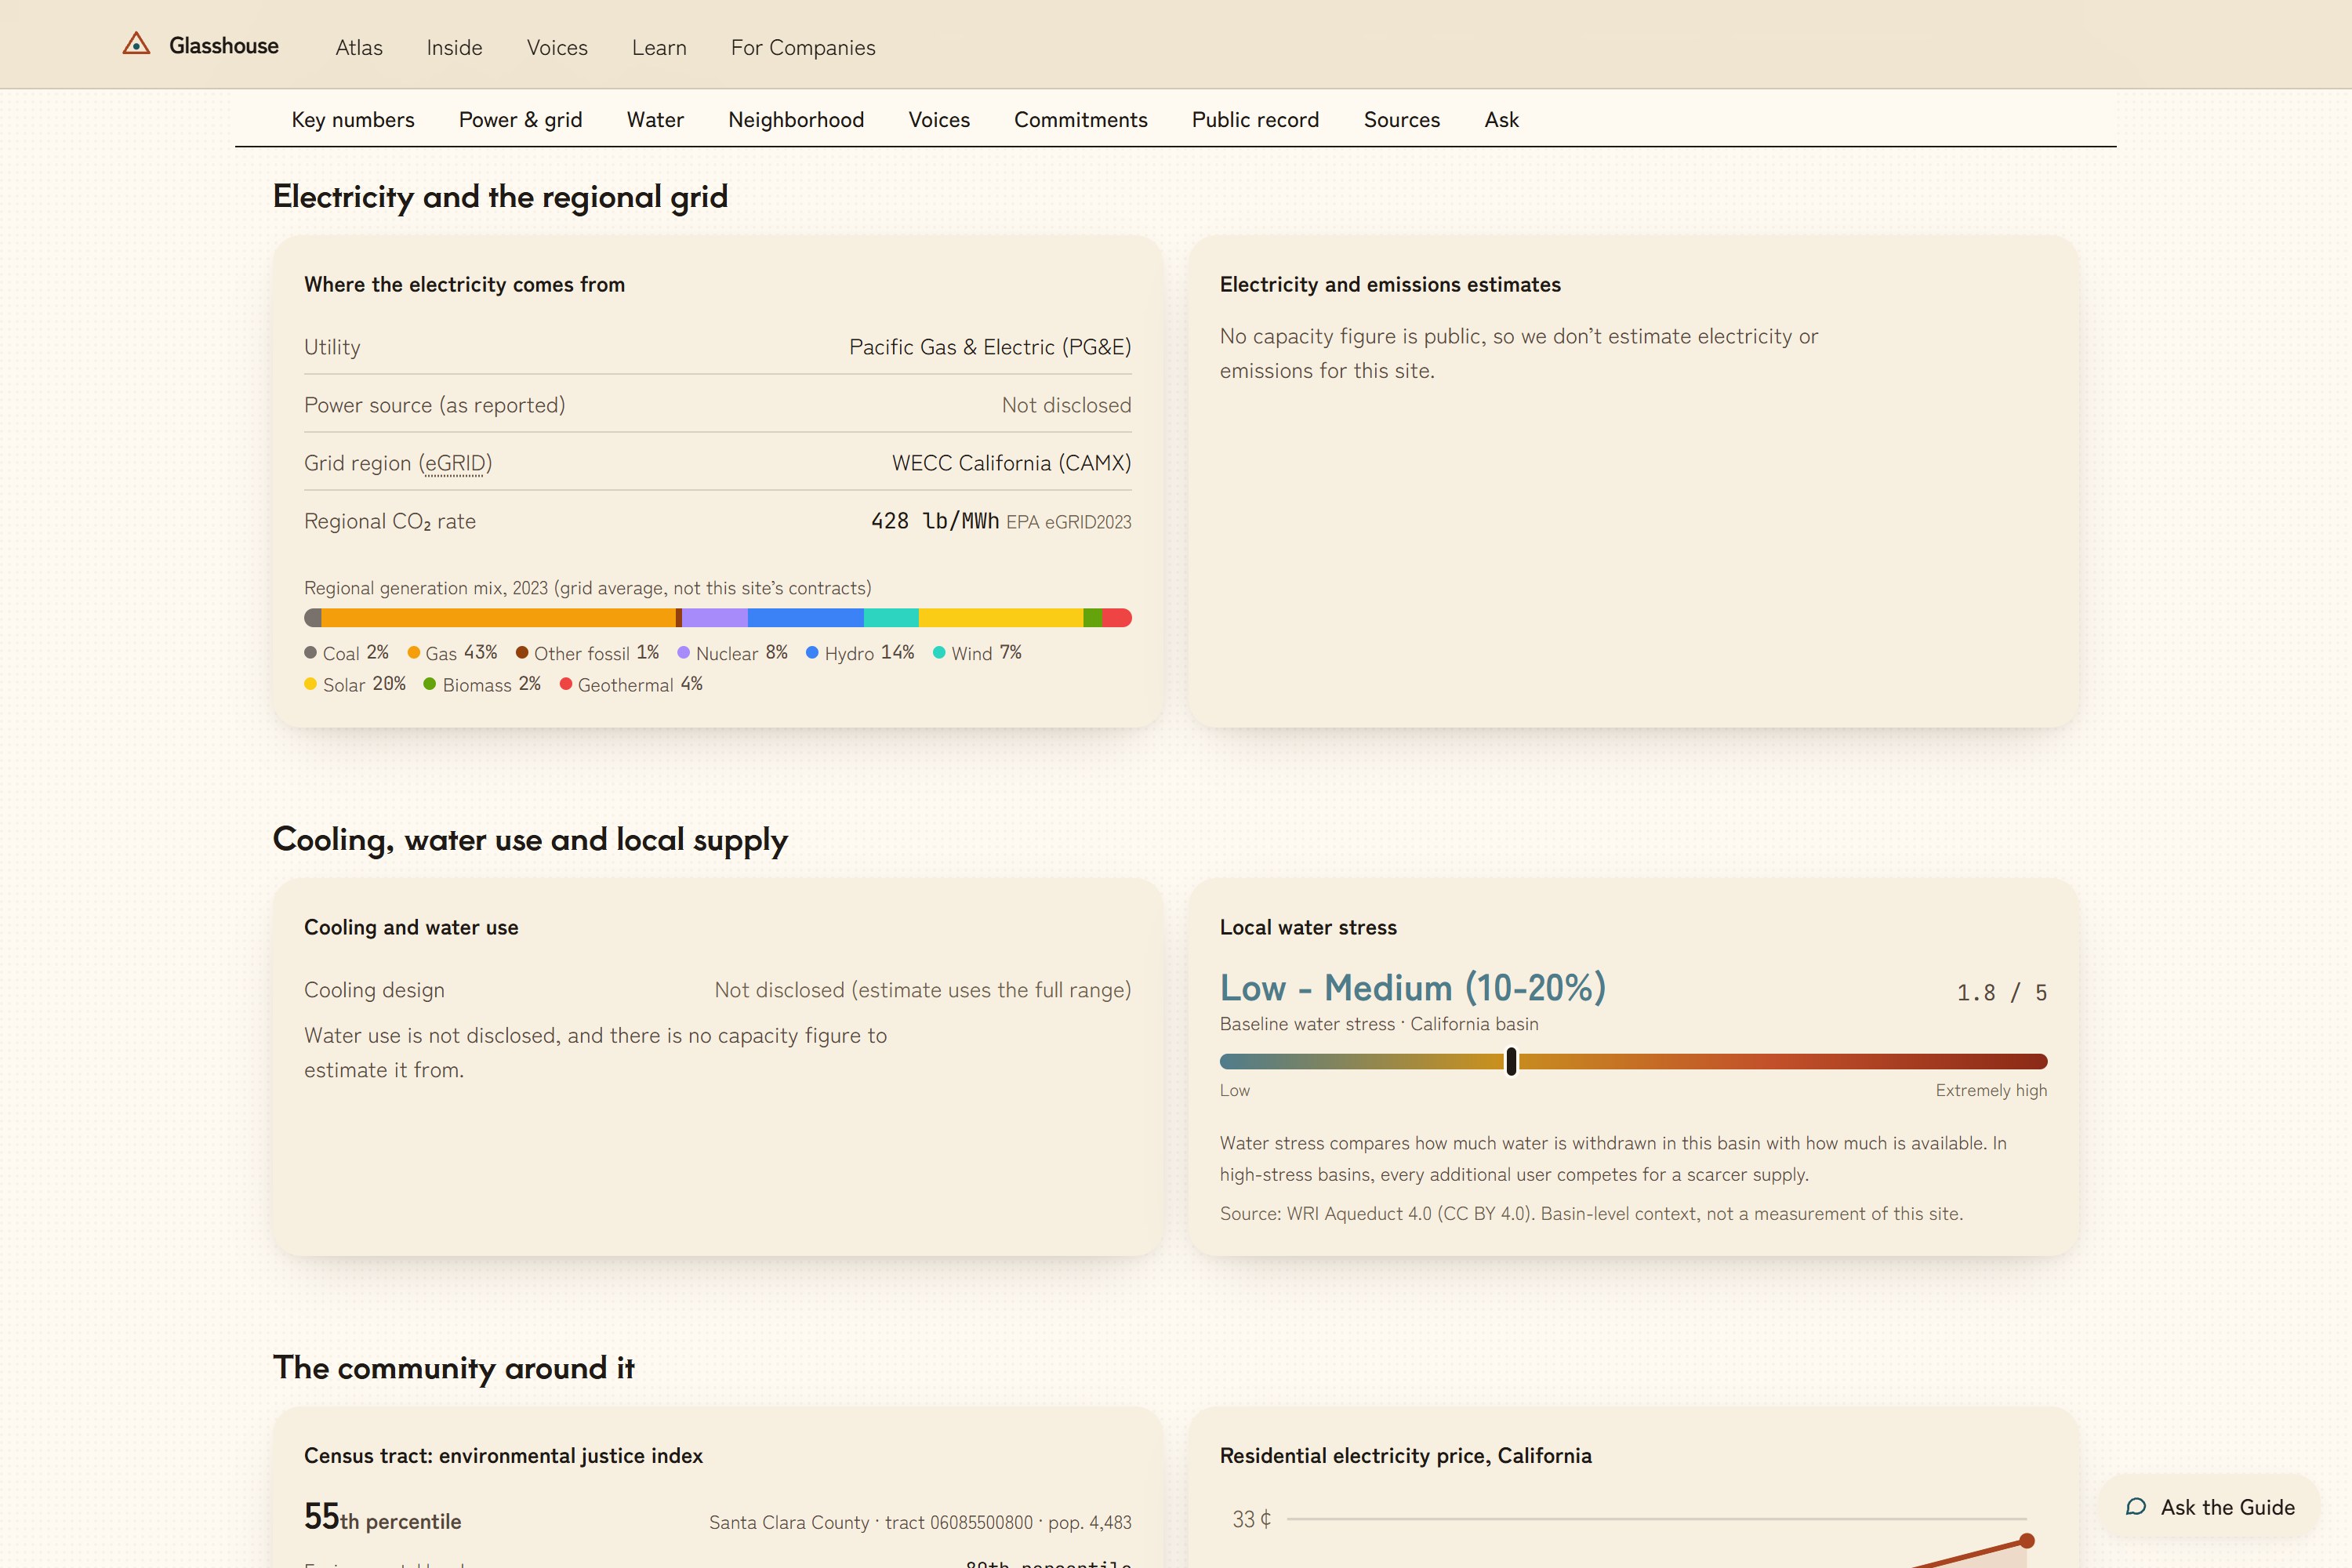
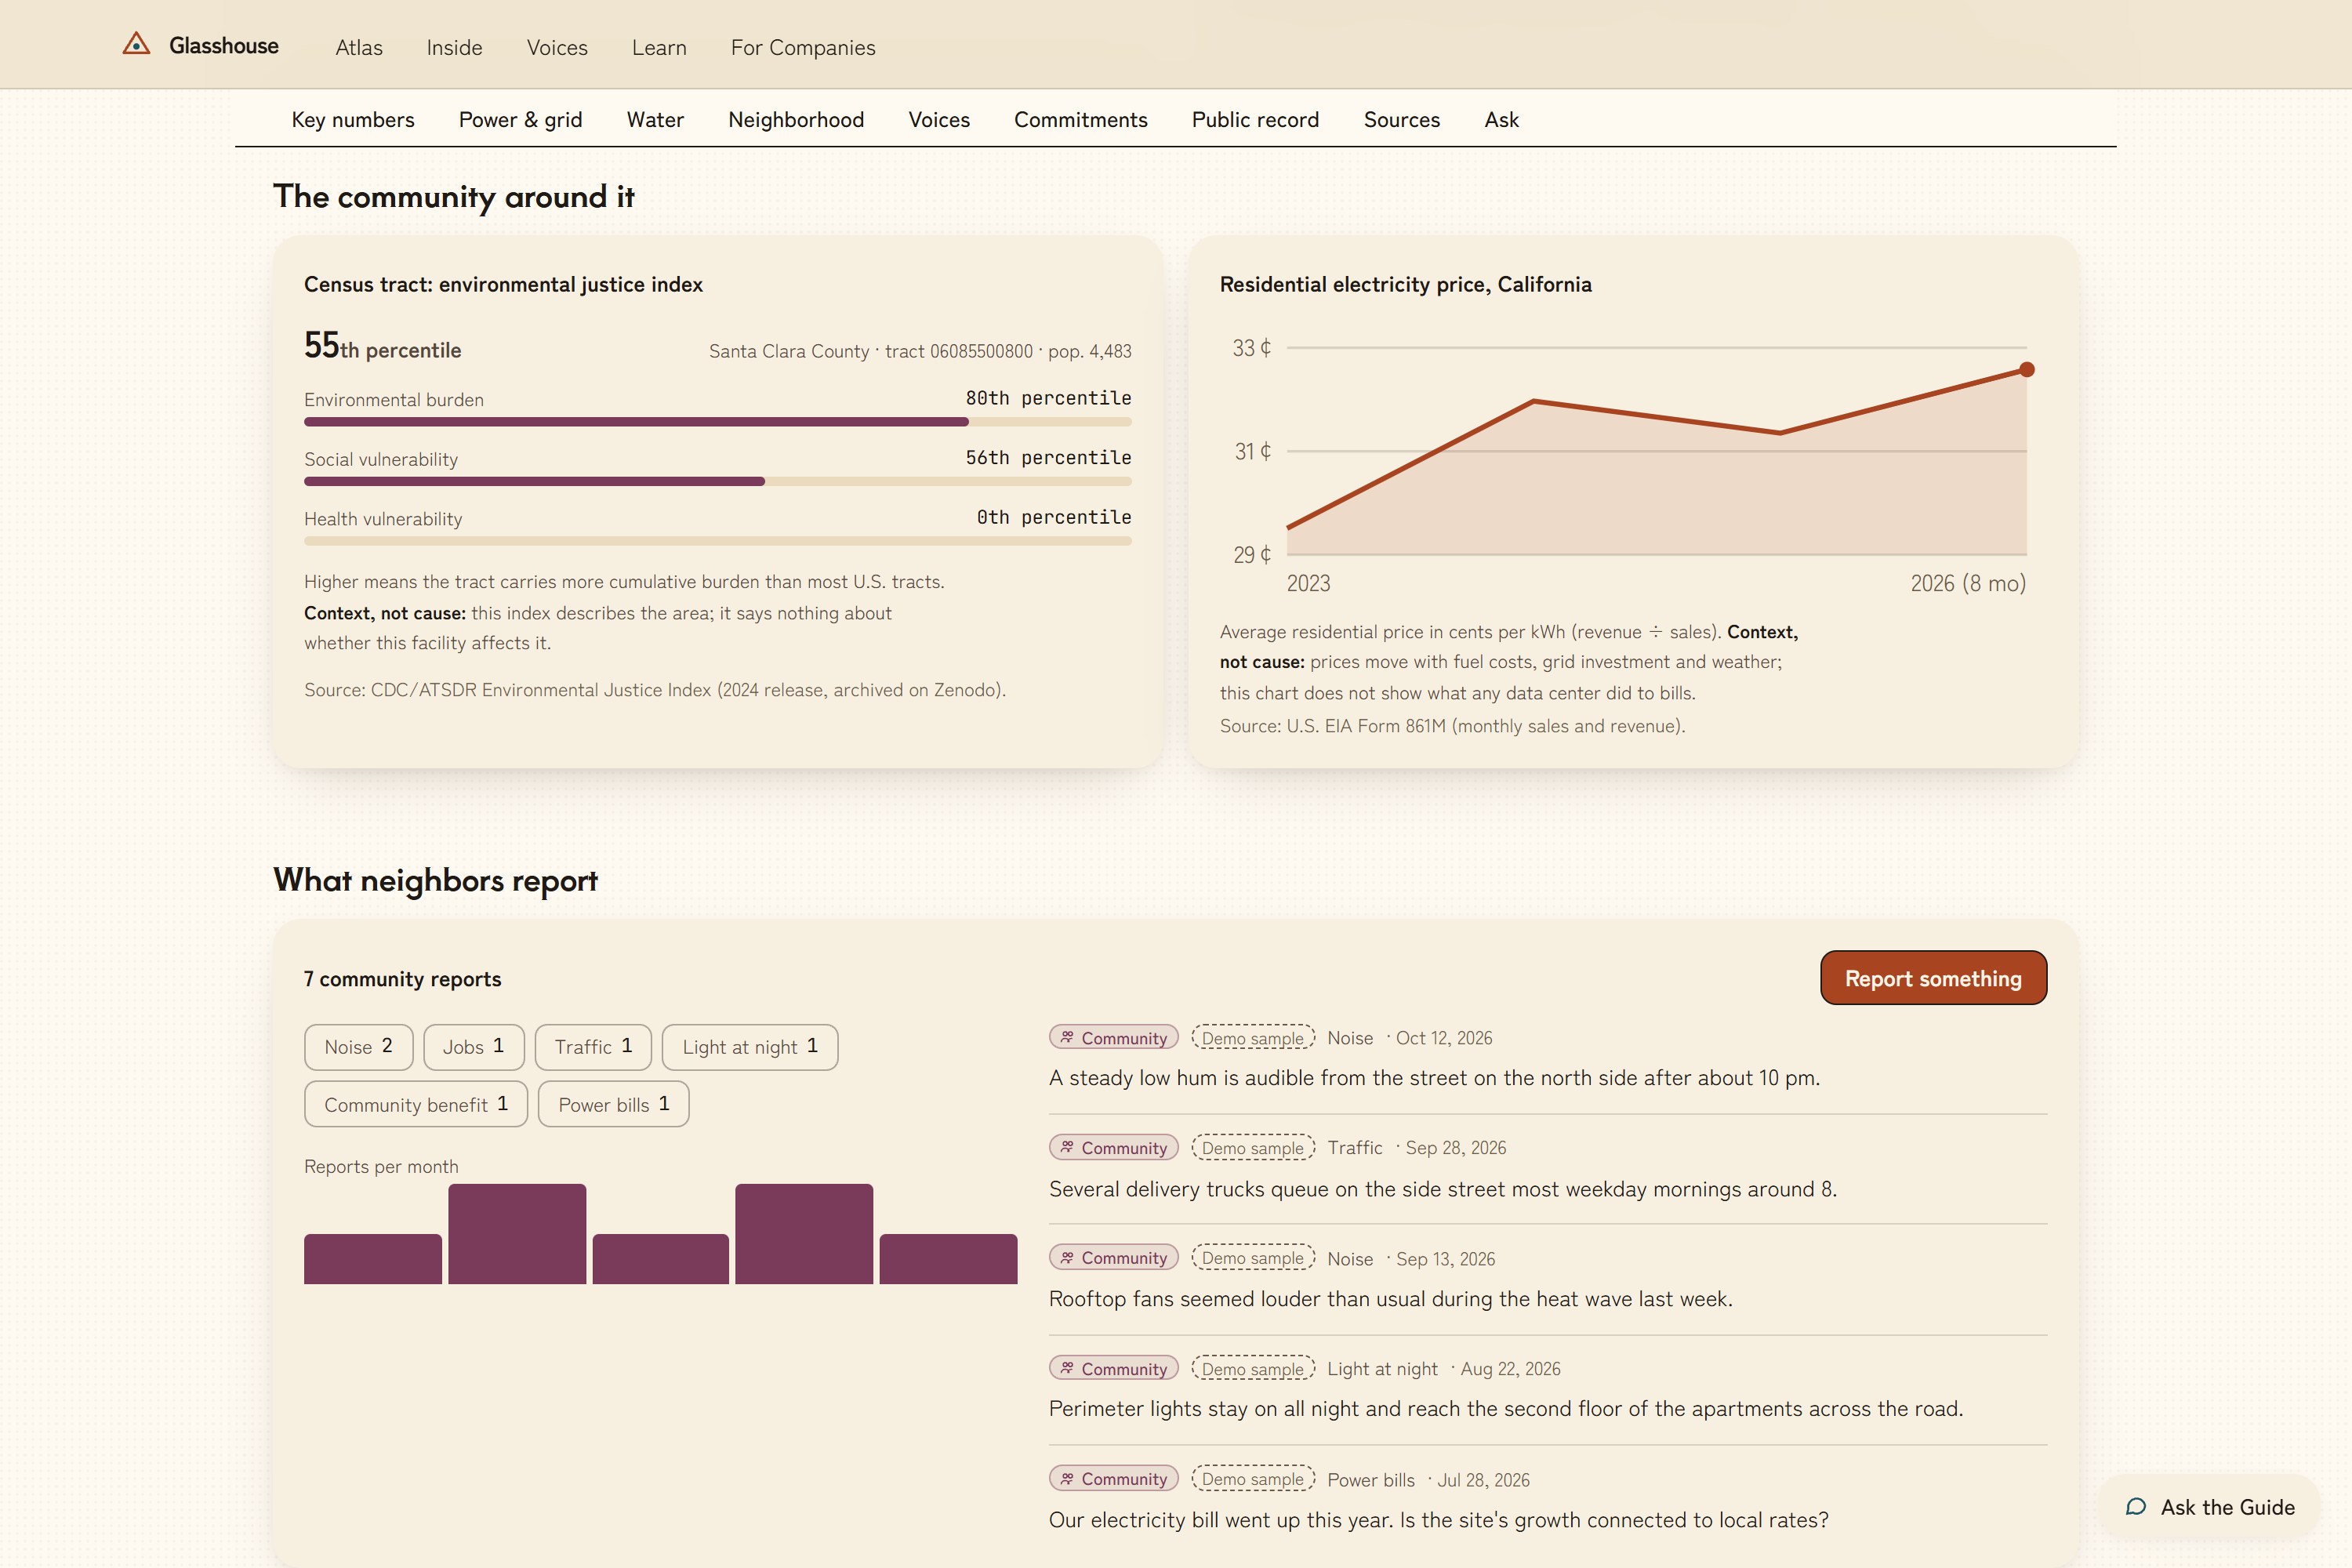
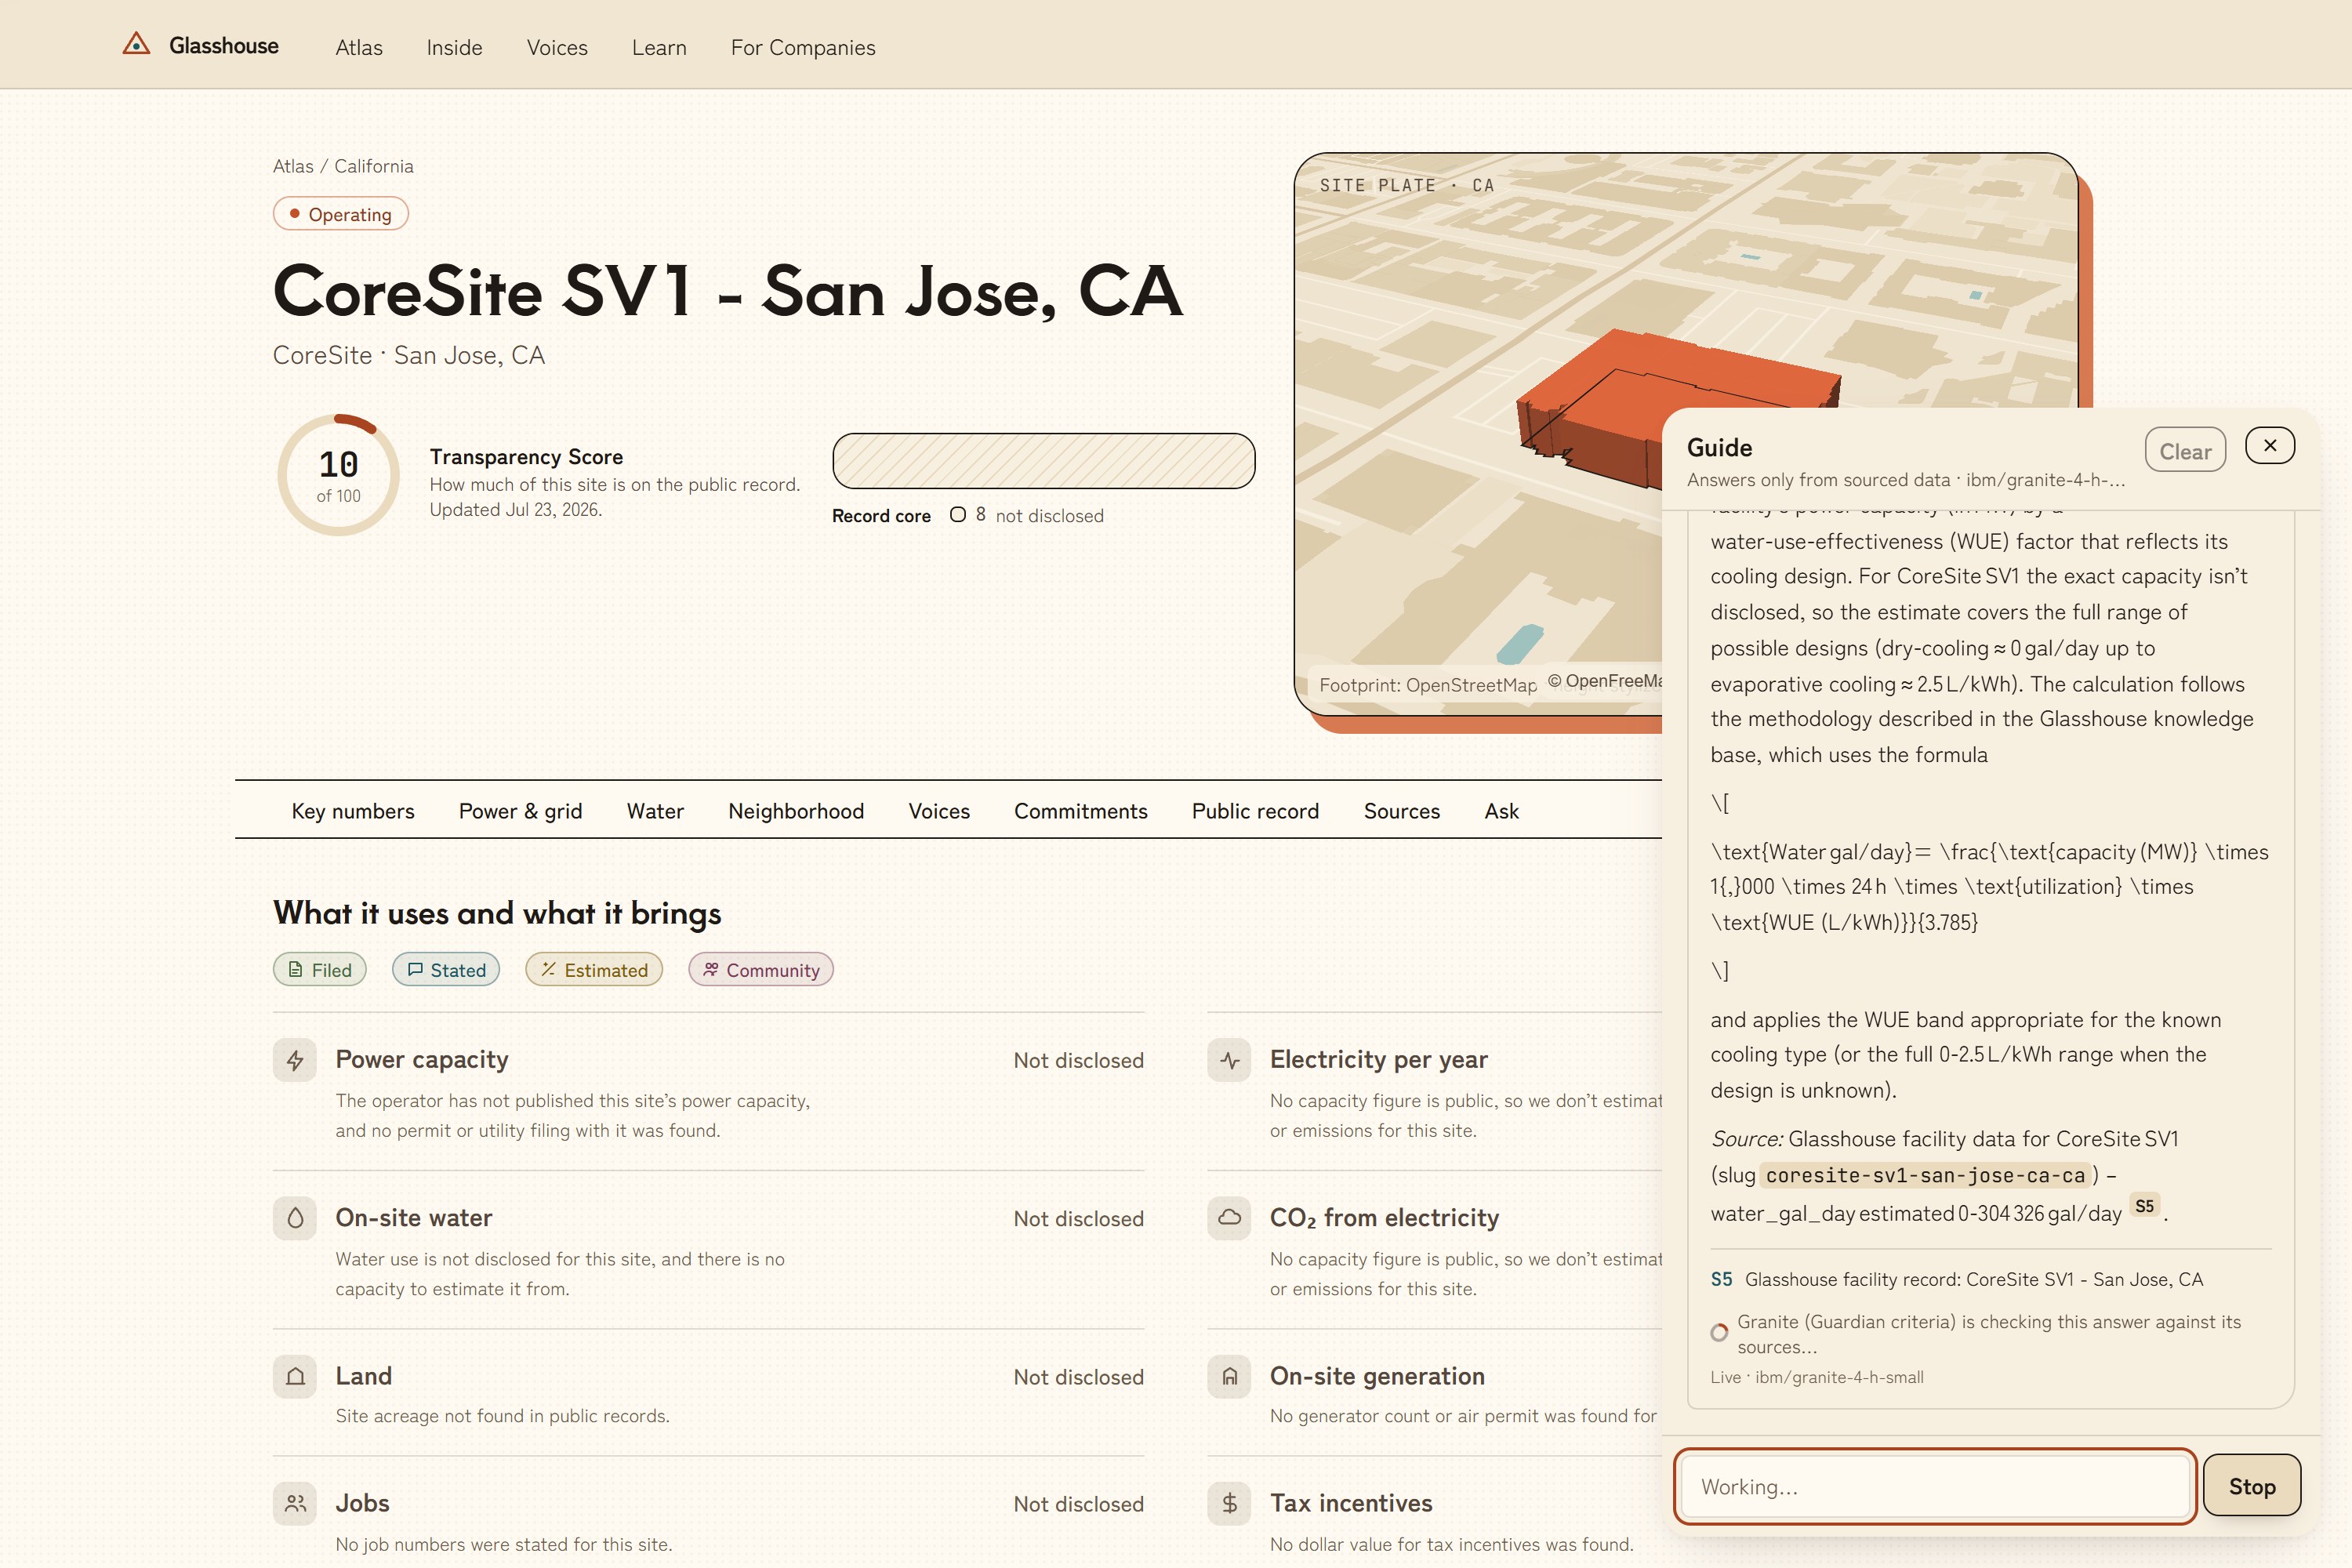
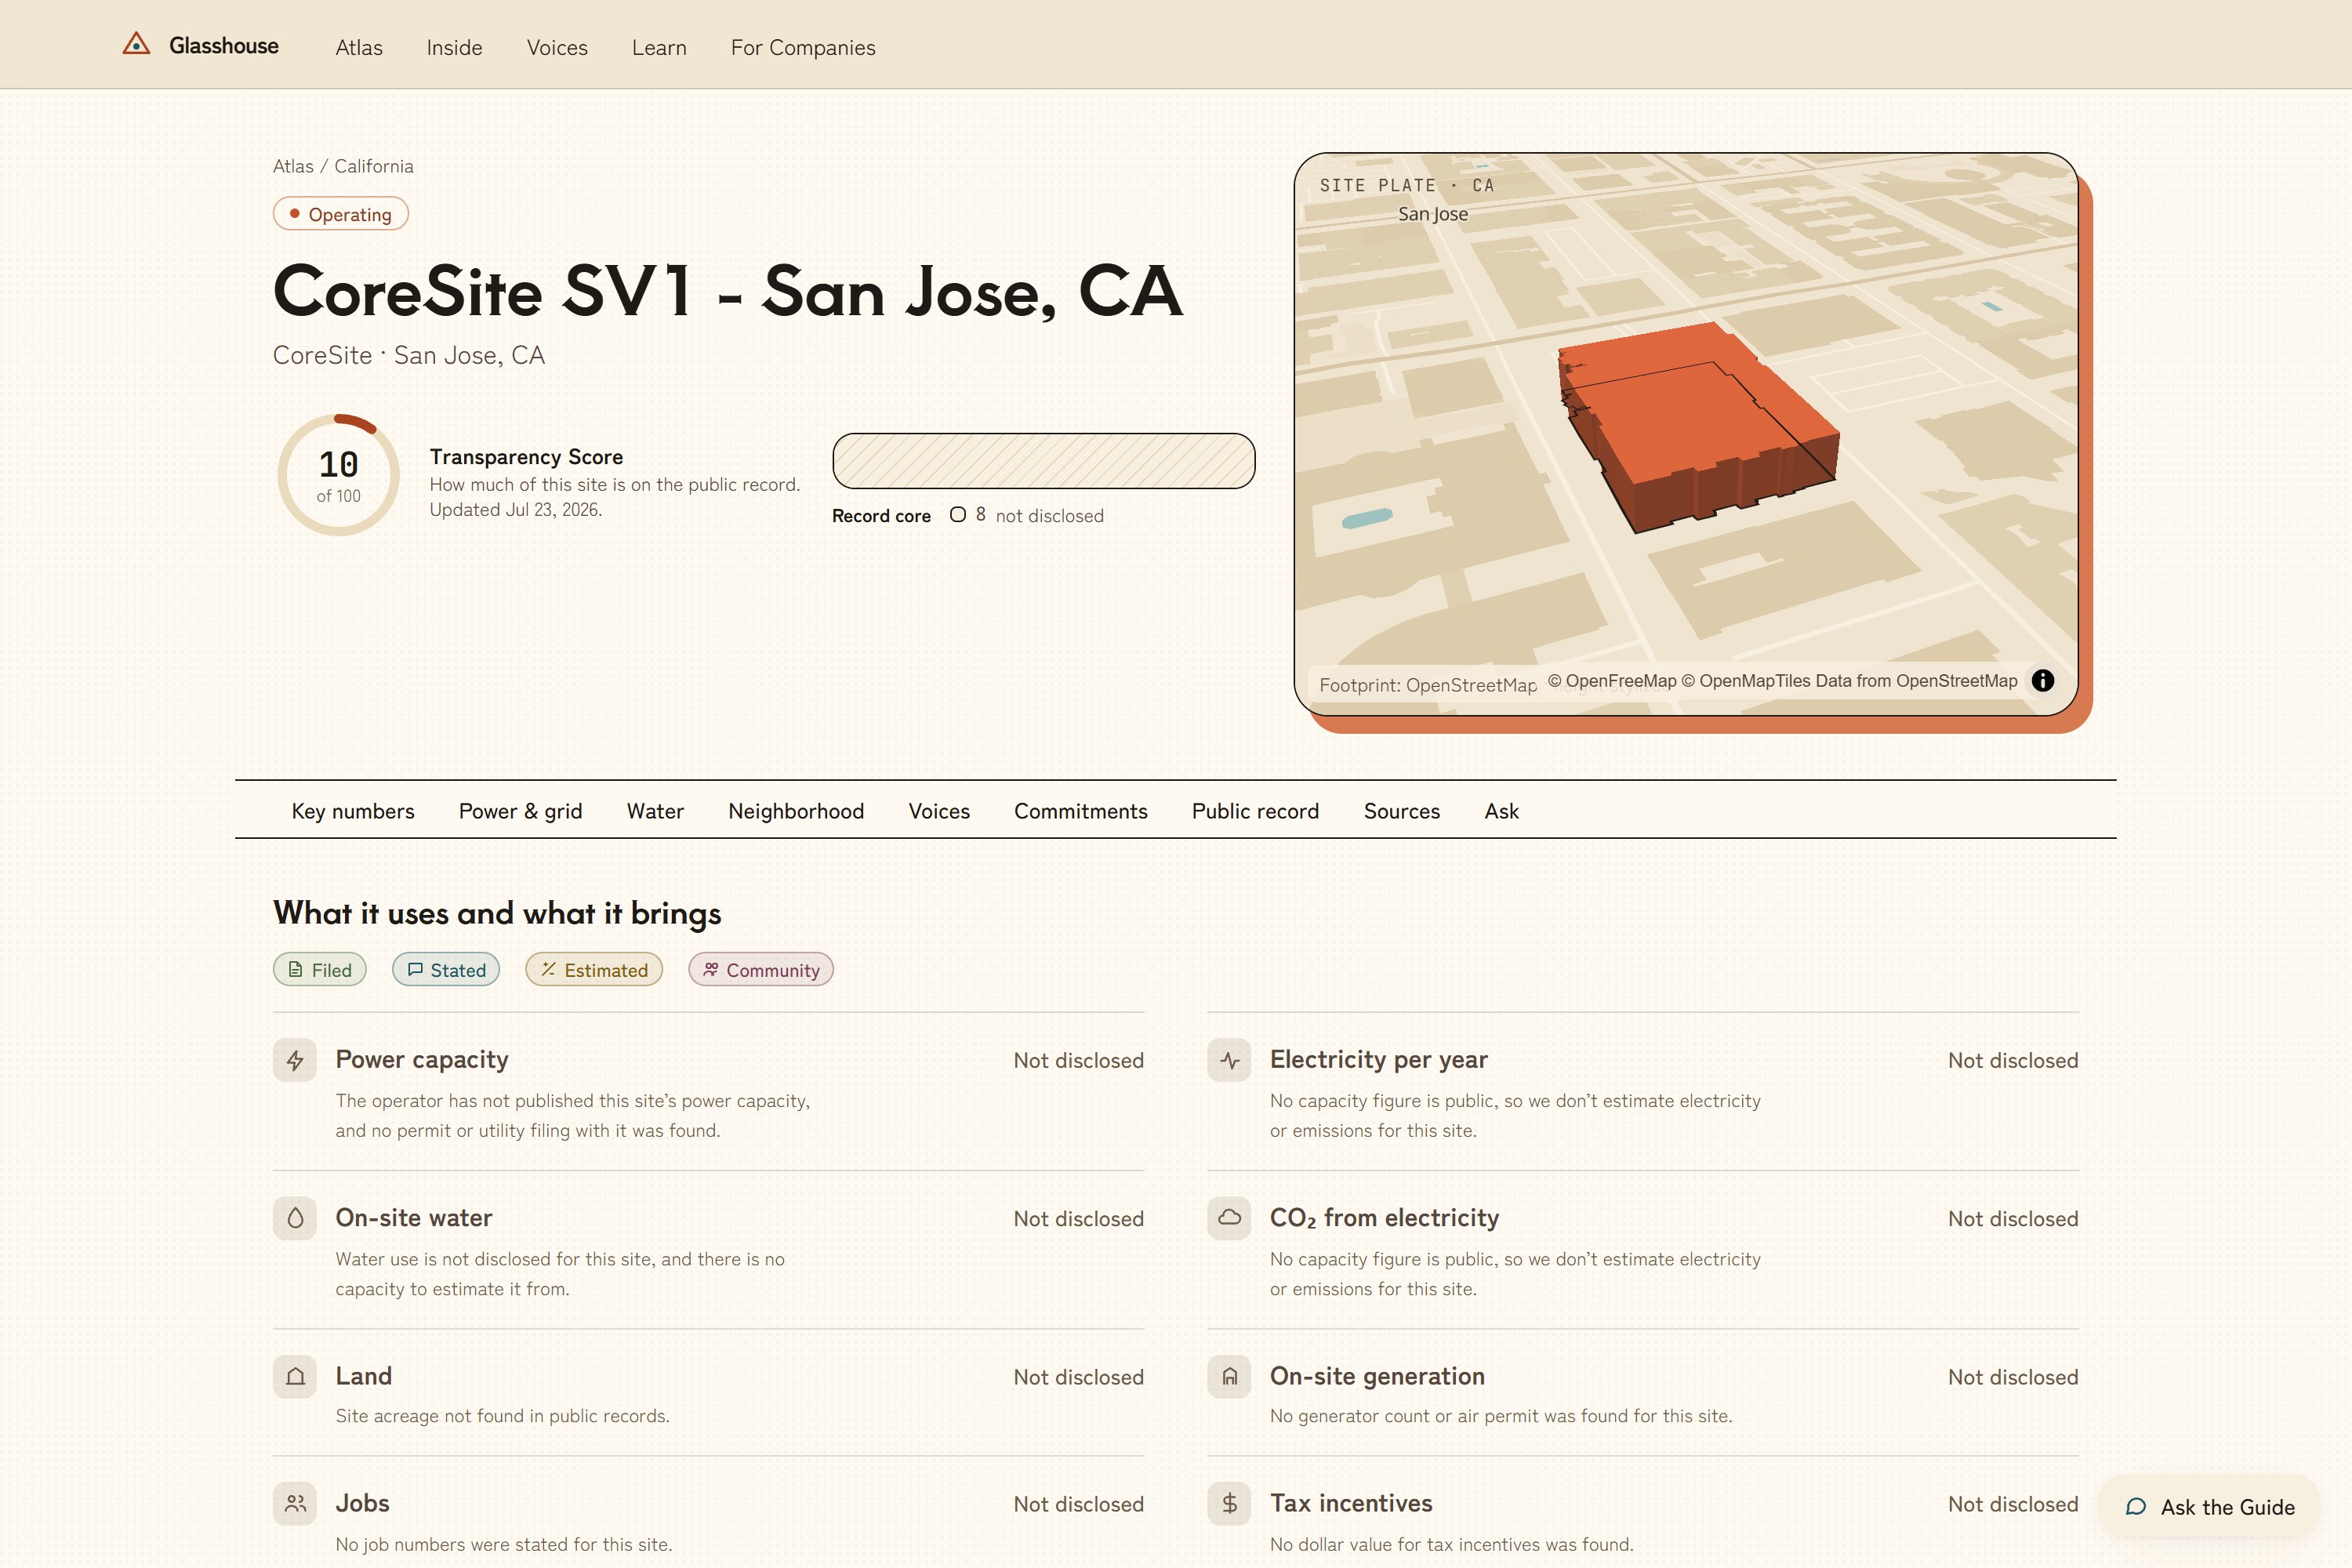
- Atlas (map + facility pages). Search by ZIP and the map flies to your town. Each facility page shows power capacity, yearly electricity, on-site water, CO₂ from the grid, land, on-site generators, jobs and tax incentives. It also shows regional grid mix, basin water stress, neighborhood context and community reports.
- Every number carries a label. Filed means a permit, filing or government record. Stated means the operator or credible press said it. Estimated means we modeled it, and the formula is shown, always as a range. Community means resident-reported, moderated and unverified. If nothing is public, the page says Not disclosed instead of guessing.
- Transparency Score (0–100). It rewards what is on the public record, not low usage. A big site that discloses everything scores higher than a small one that hides. Estimates and community reports never count as disclosure.
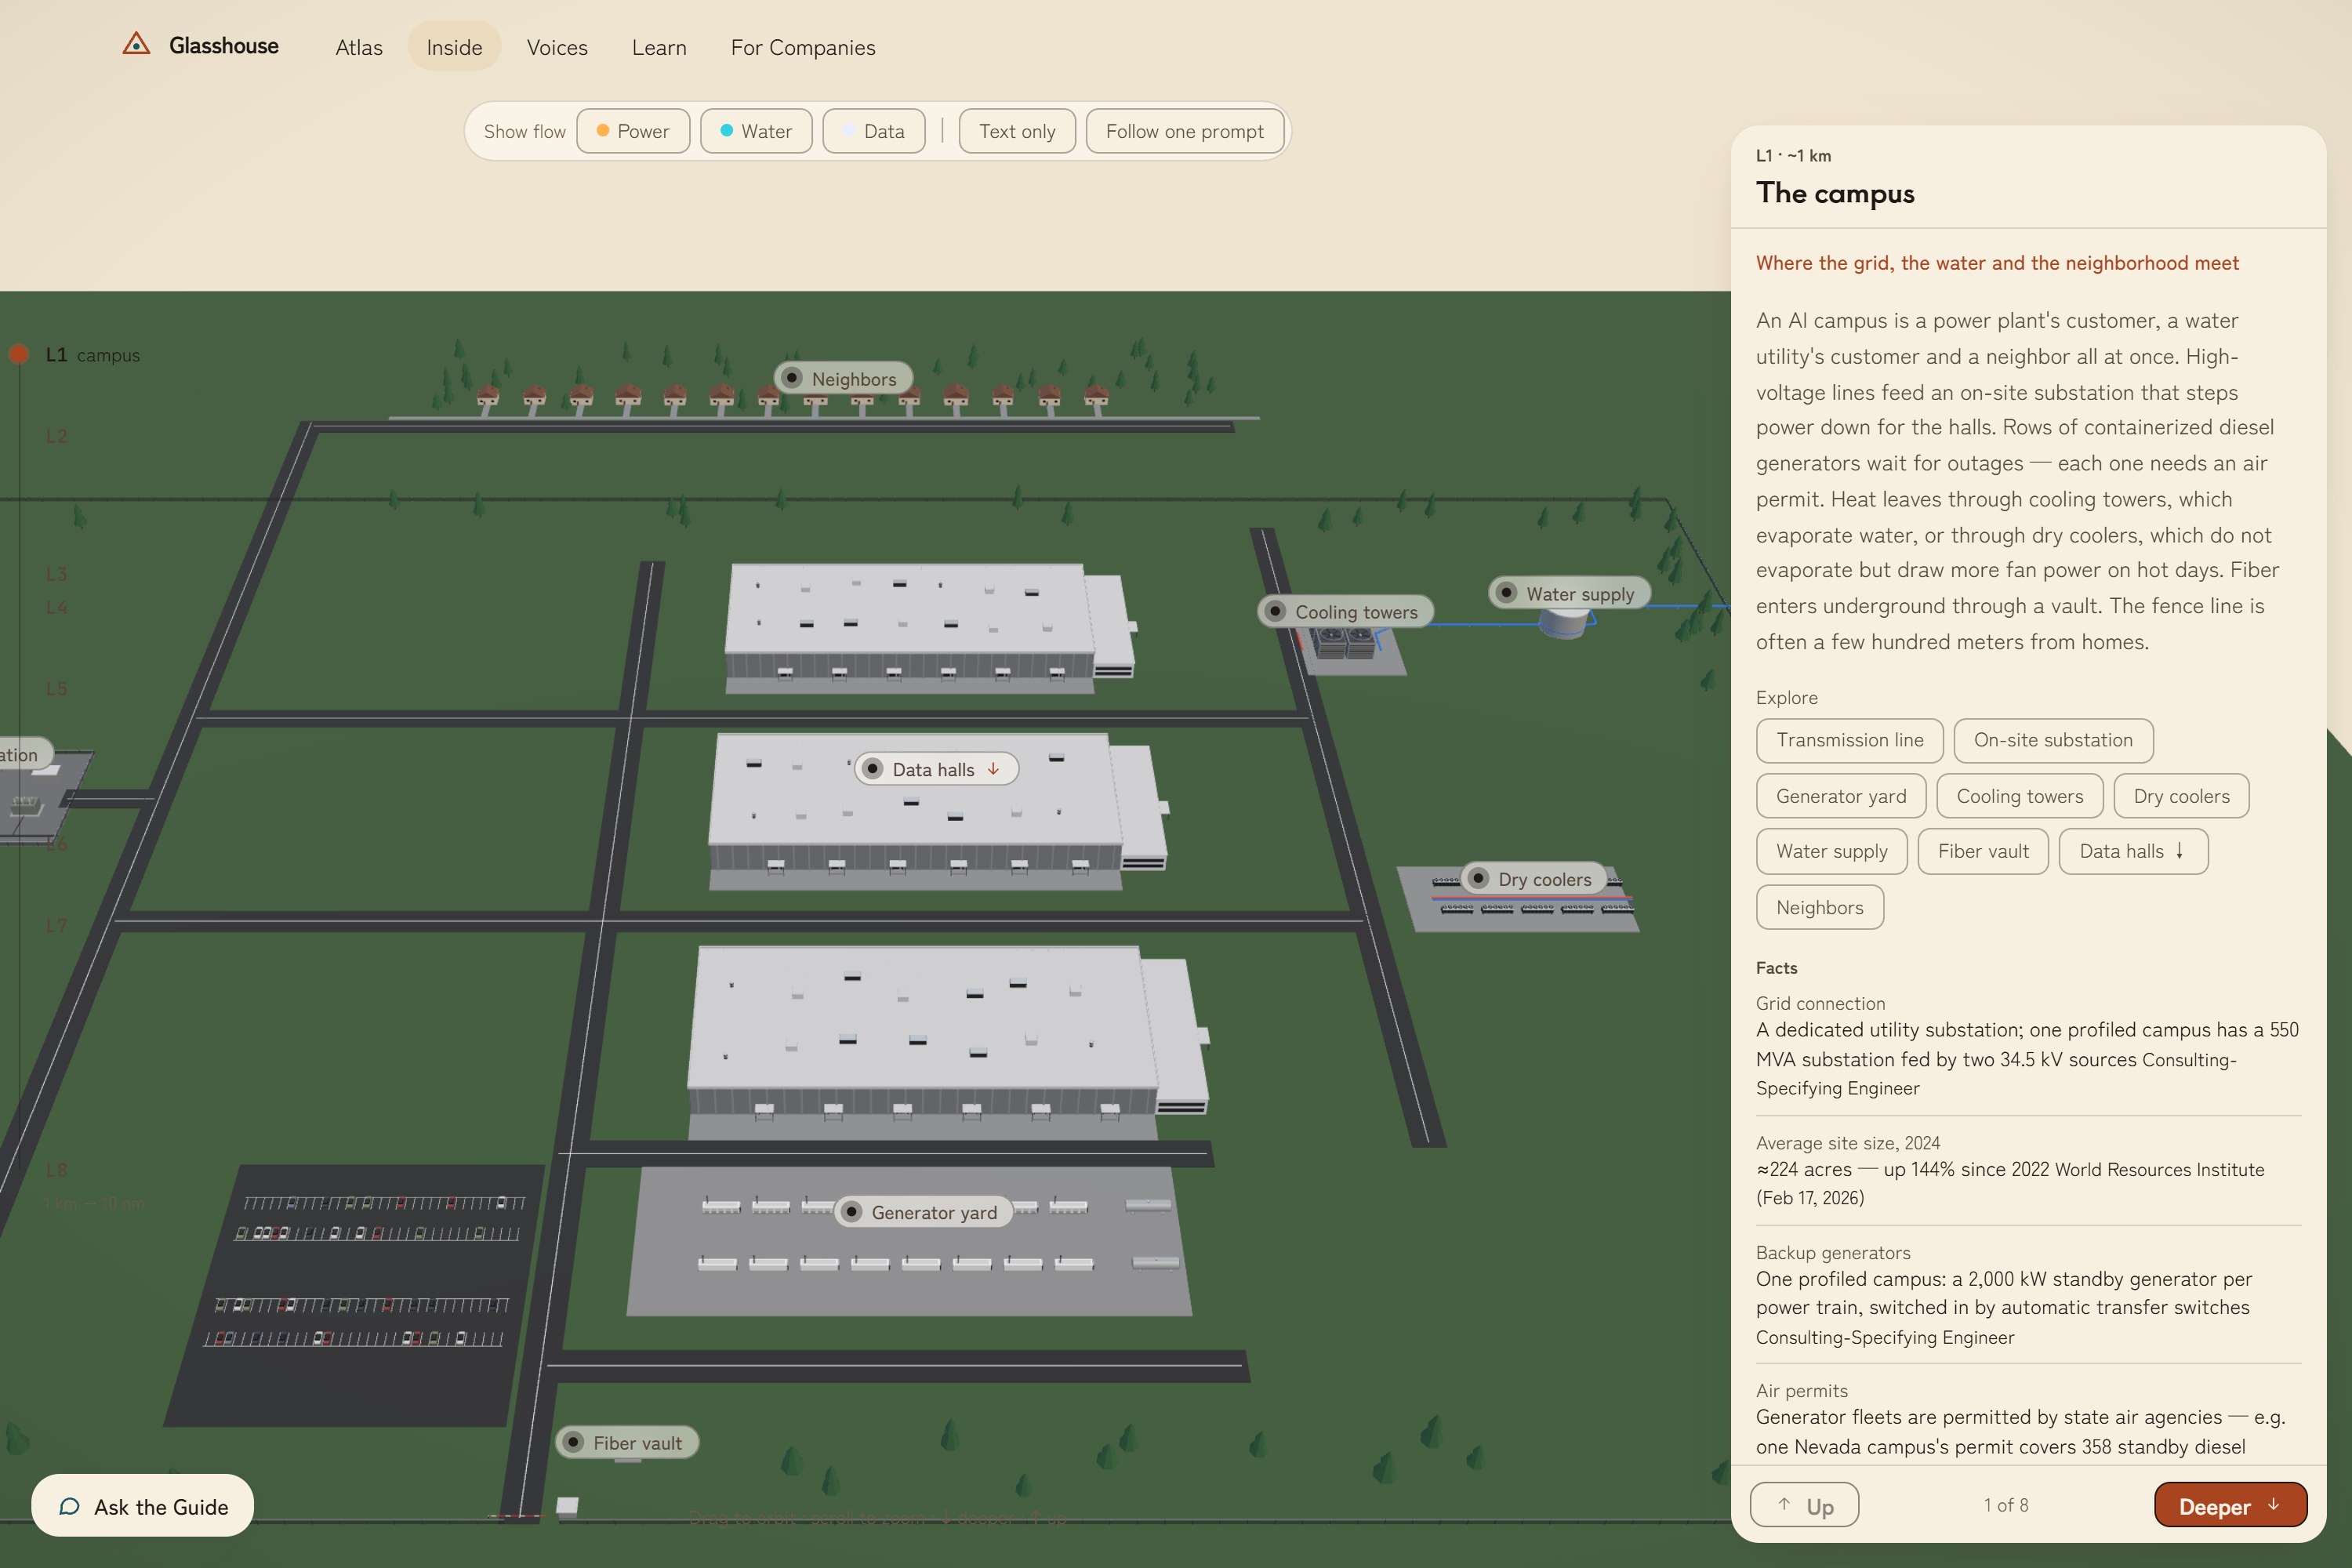
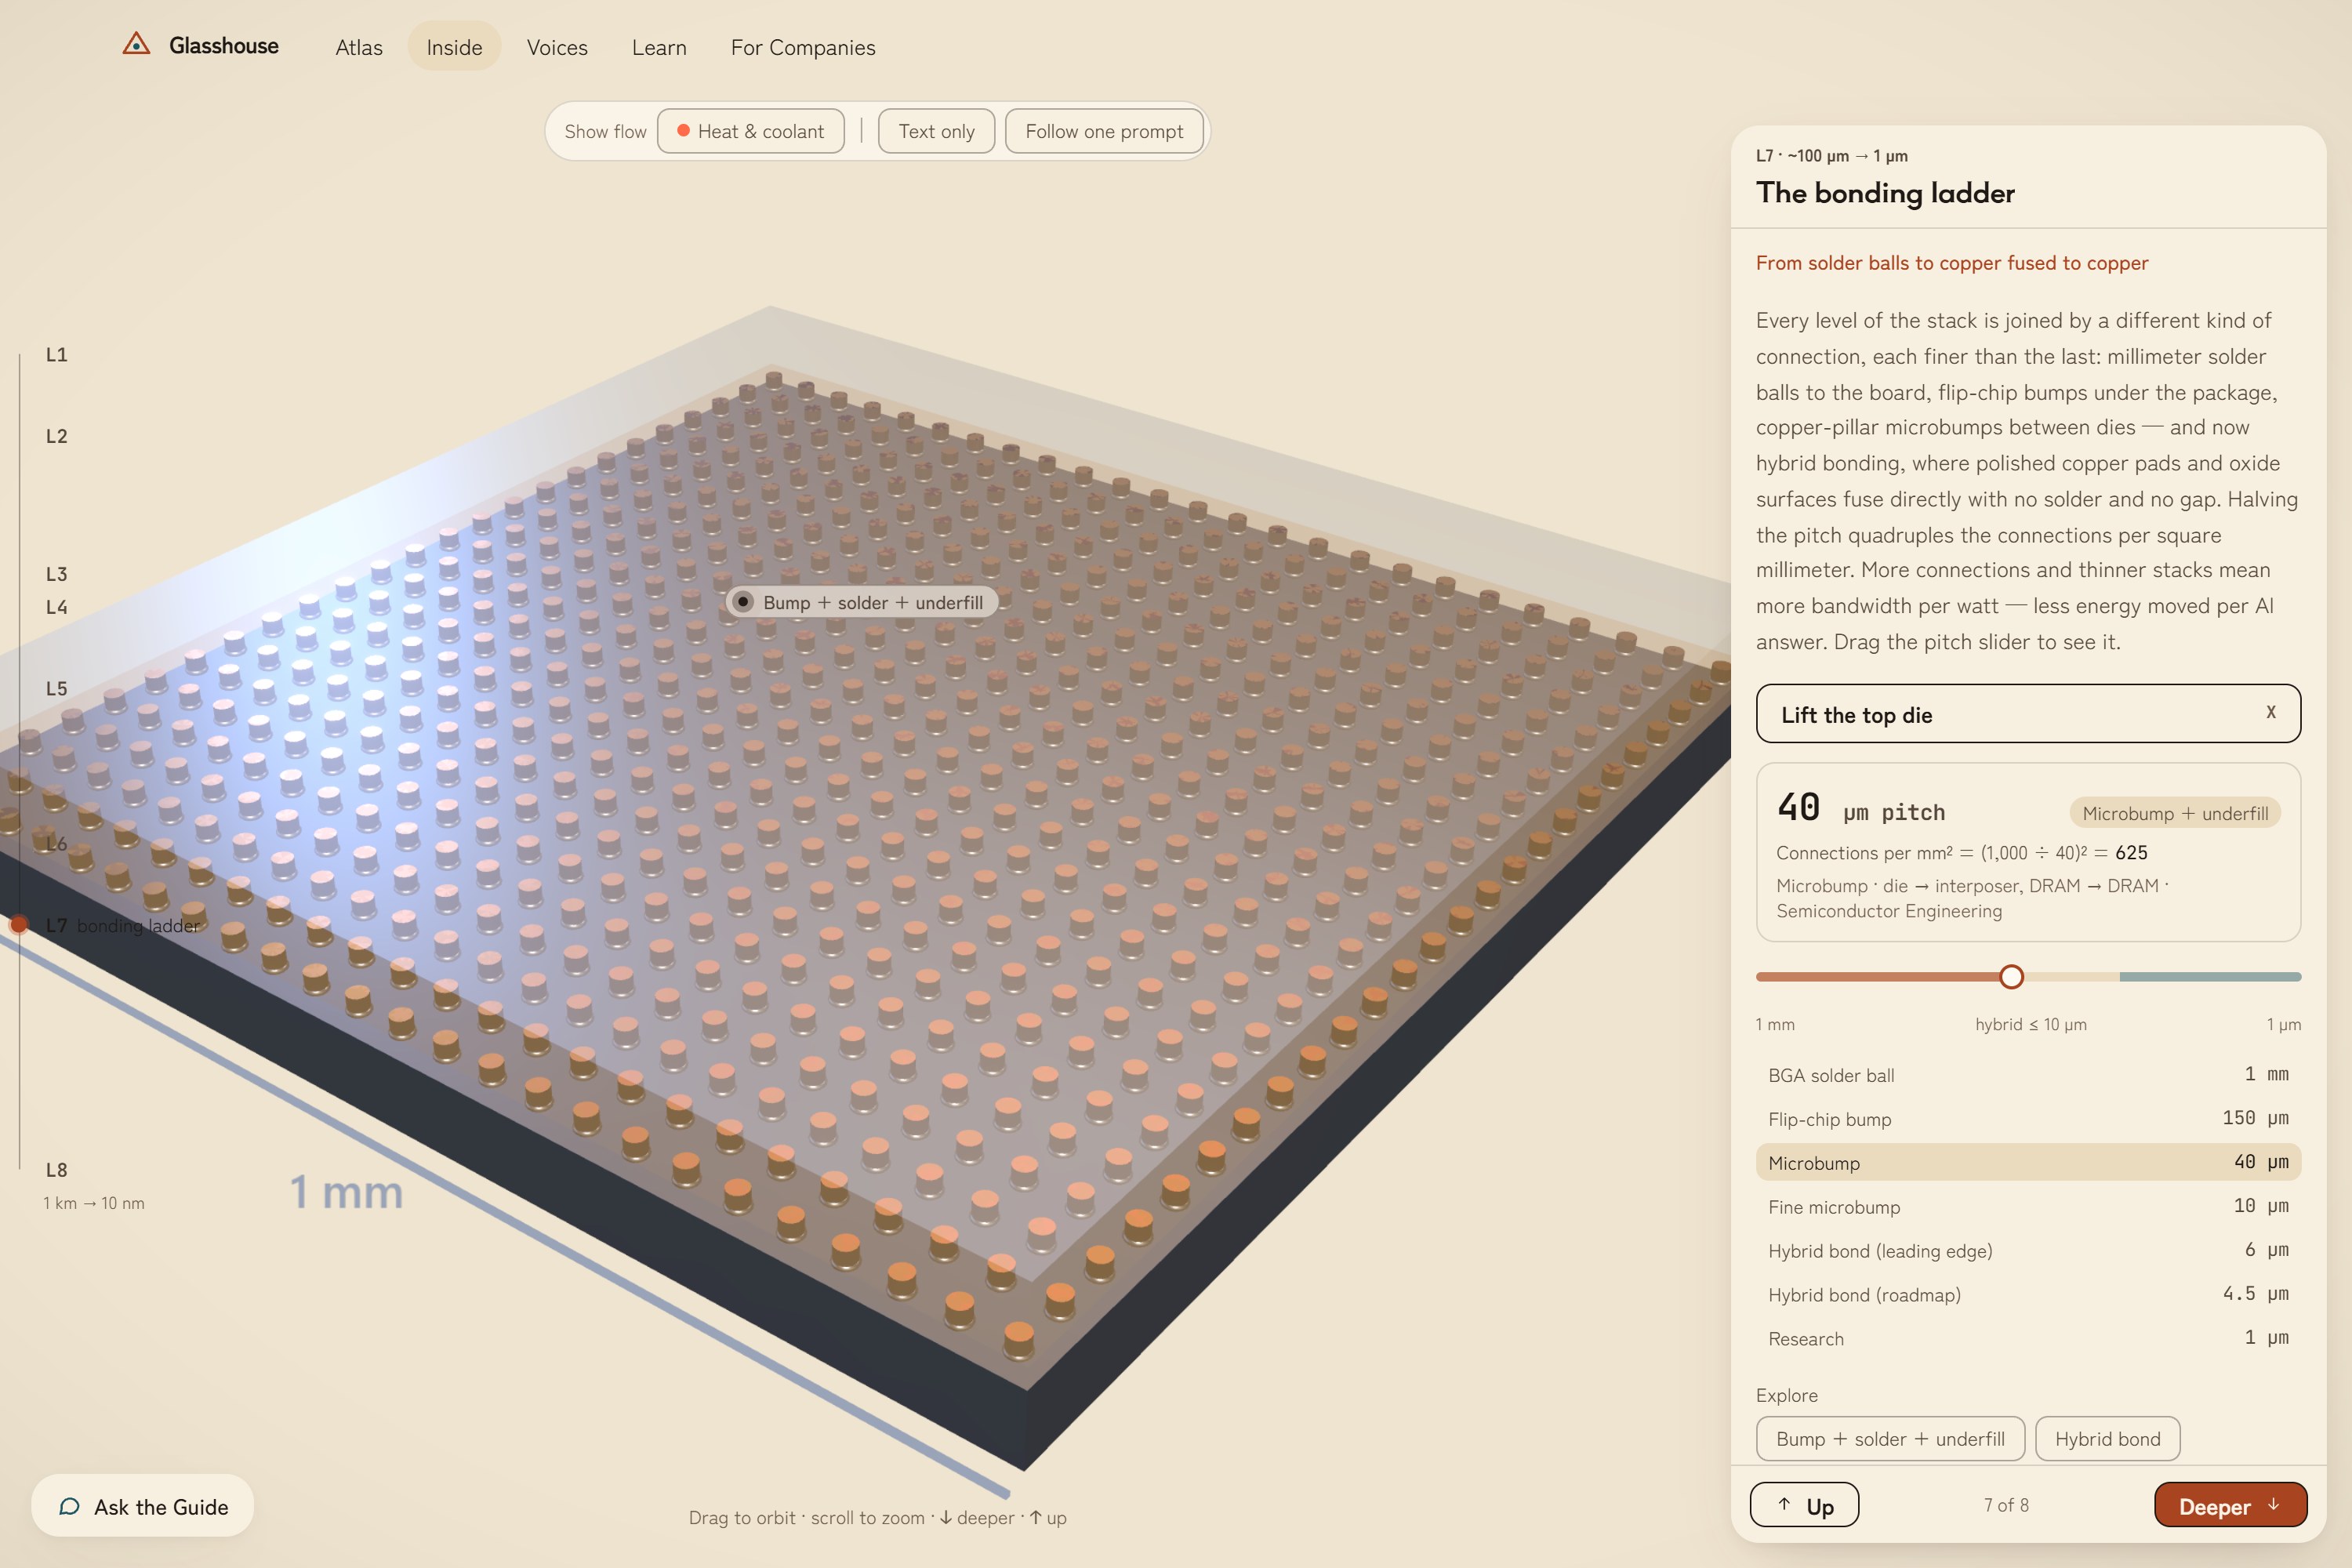
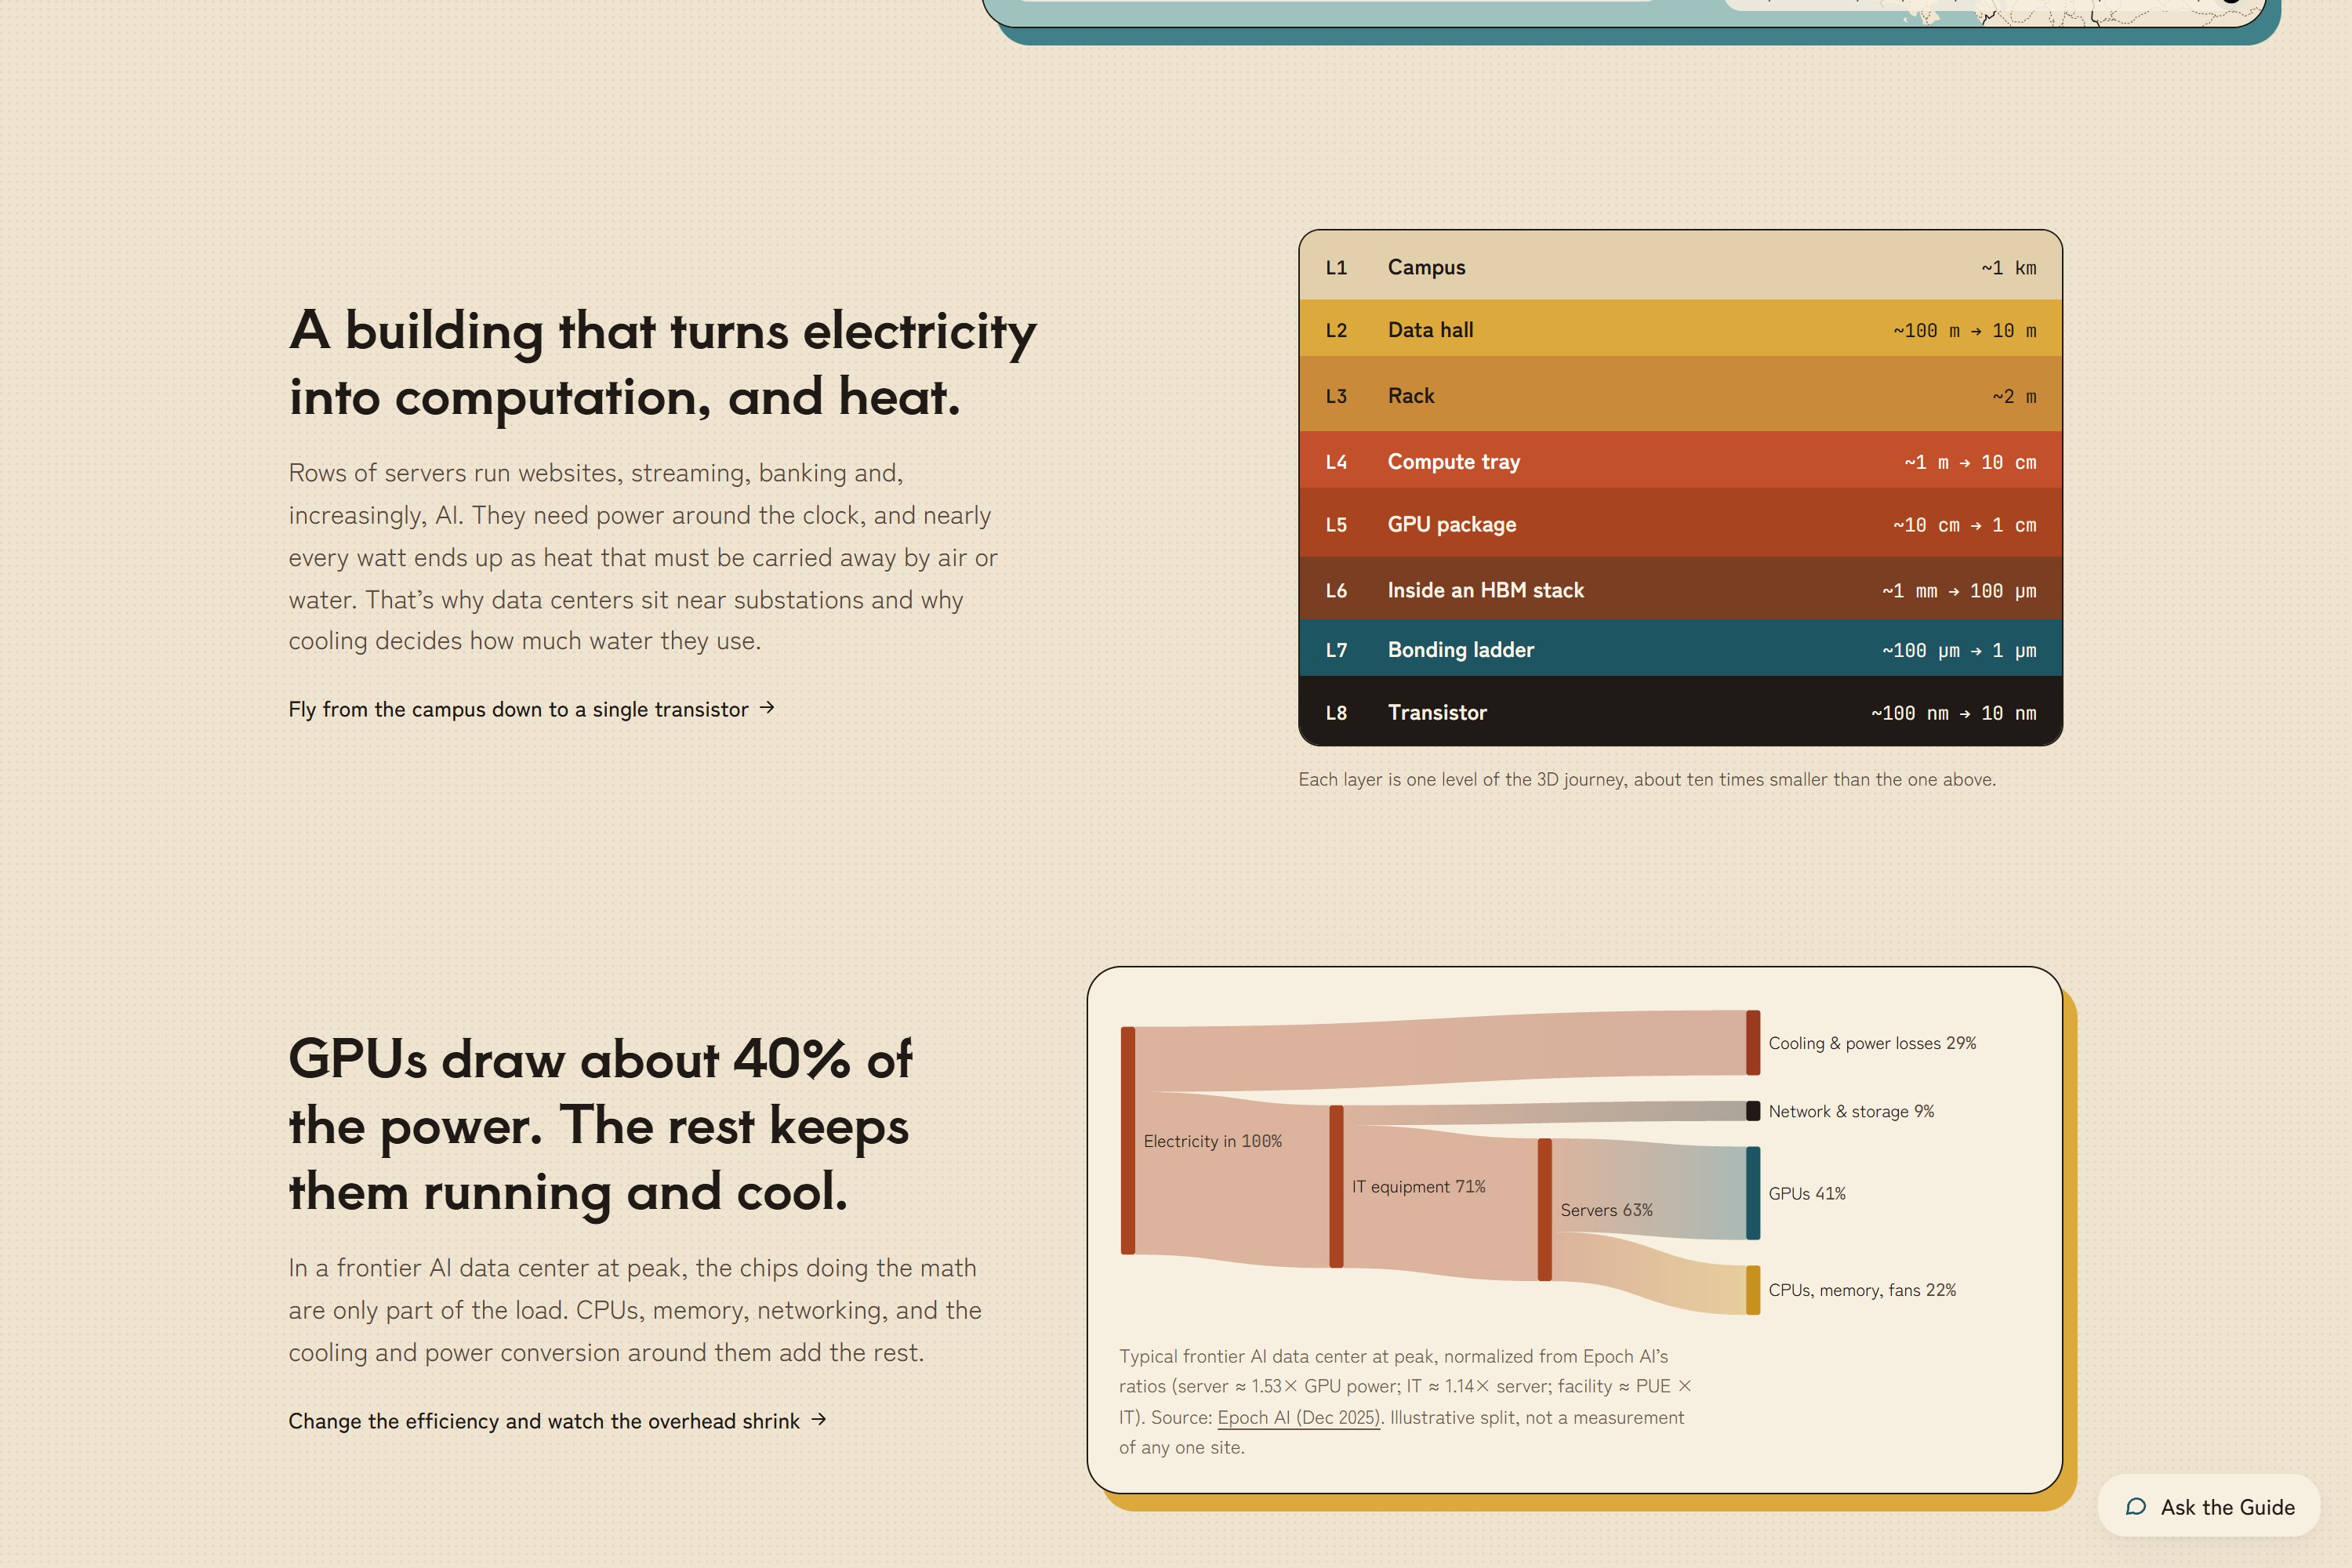
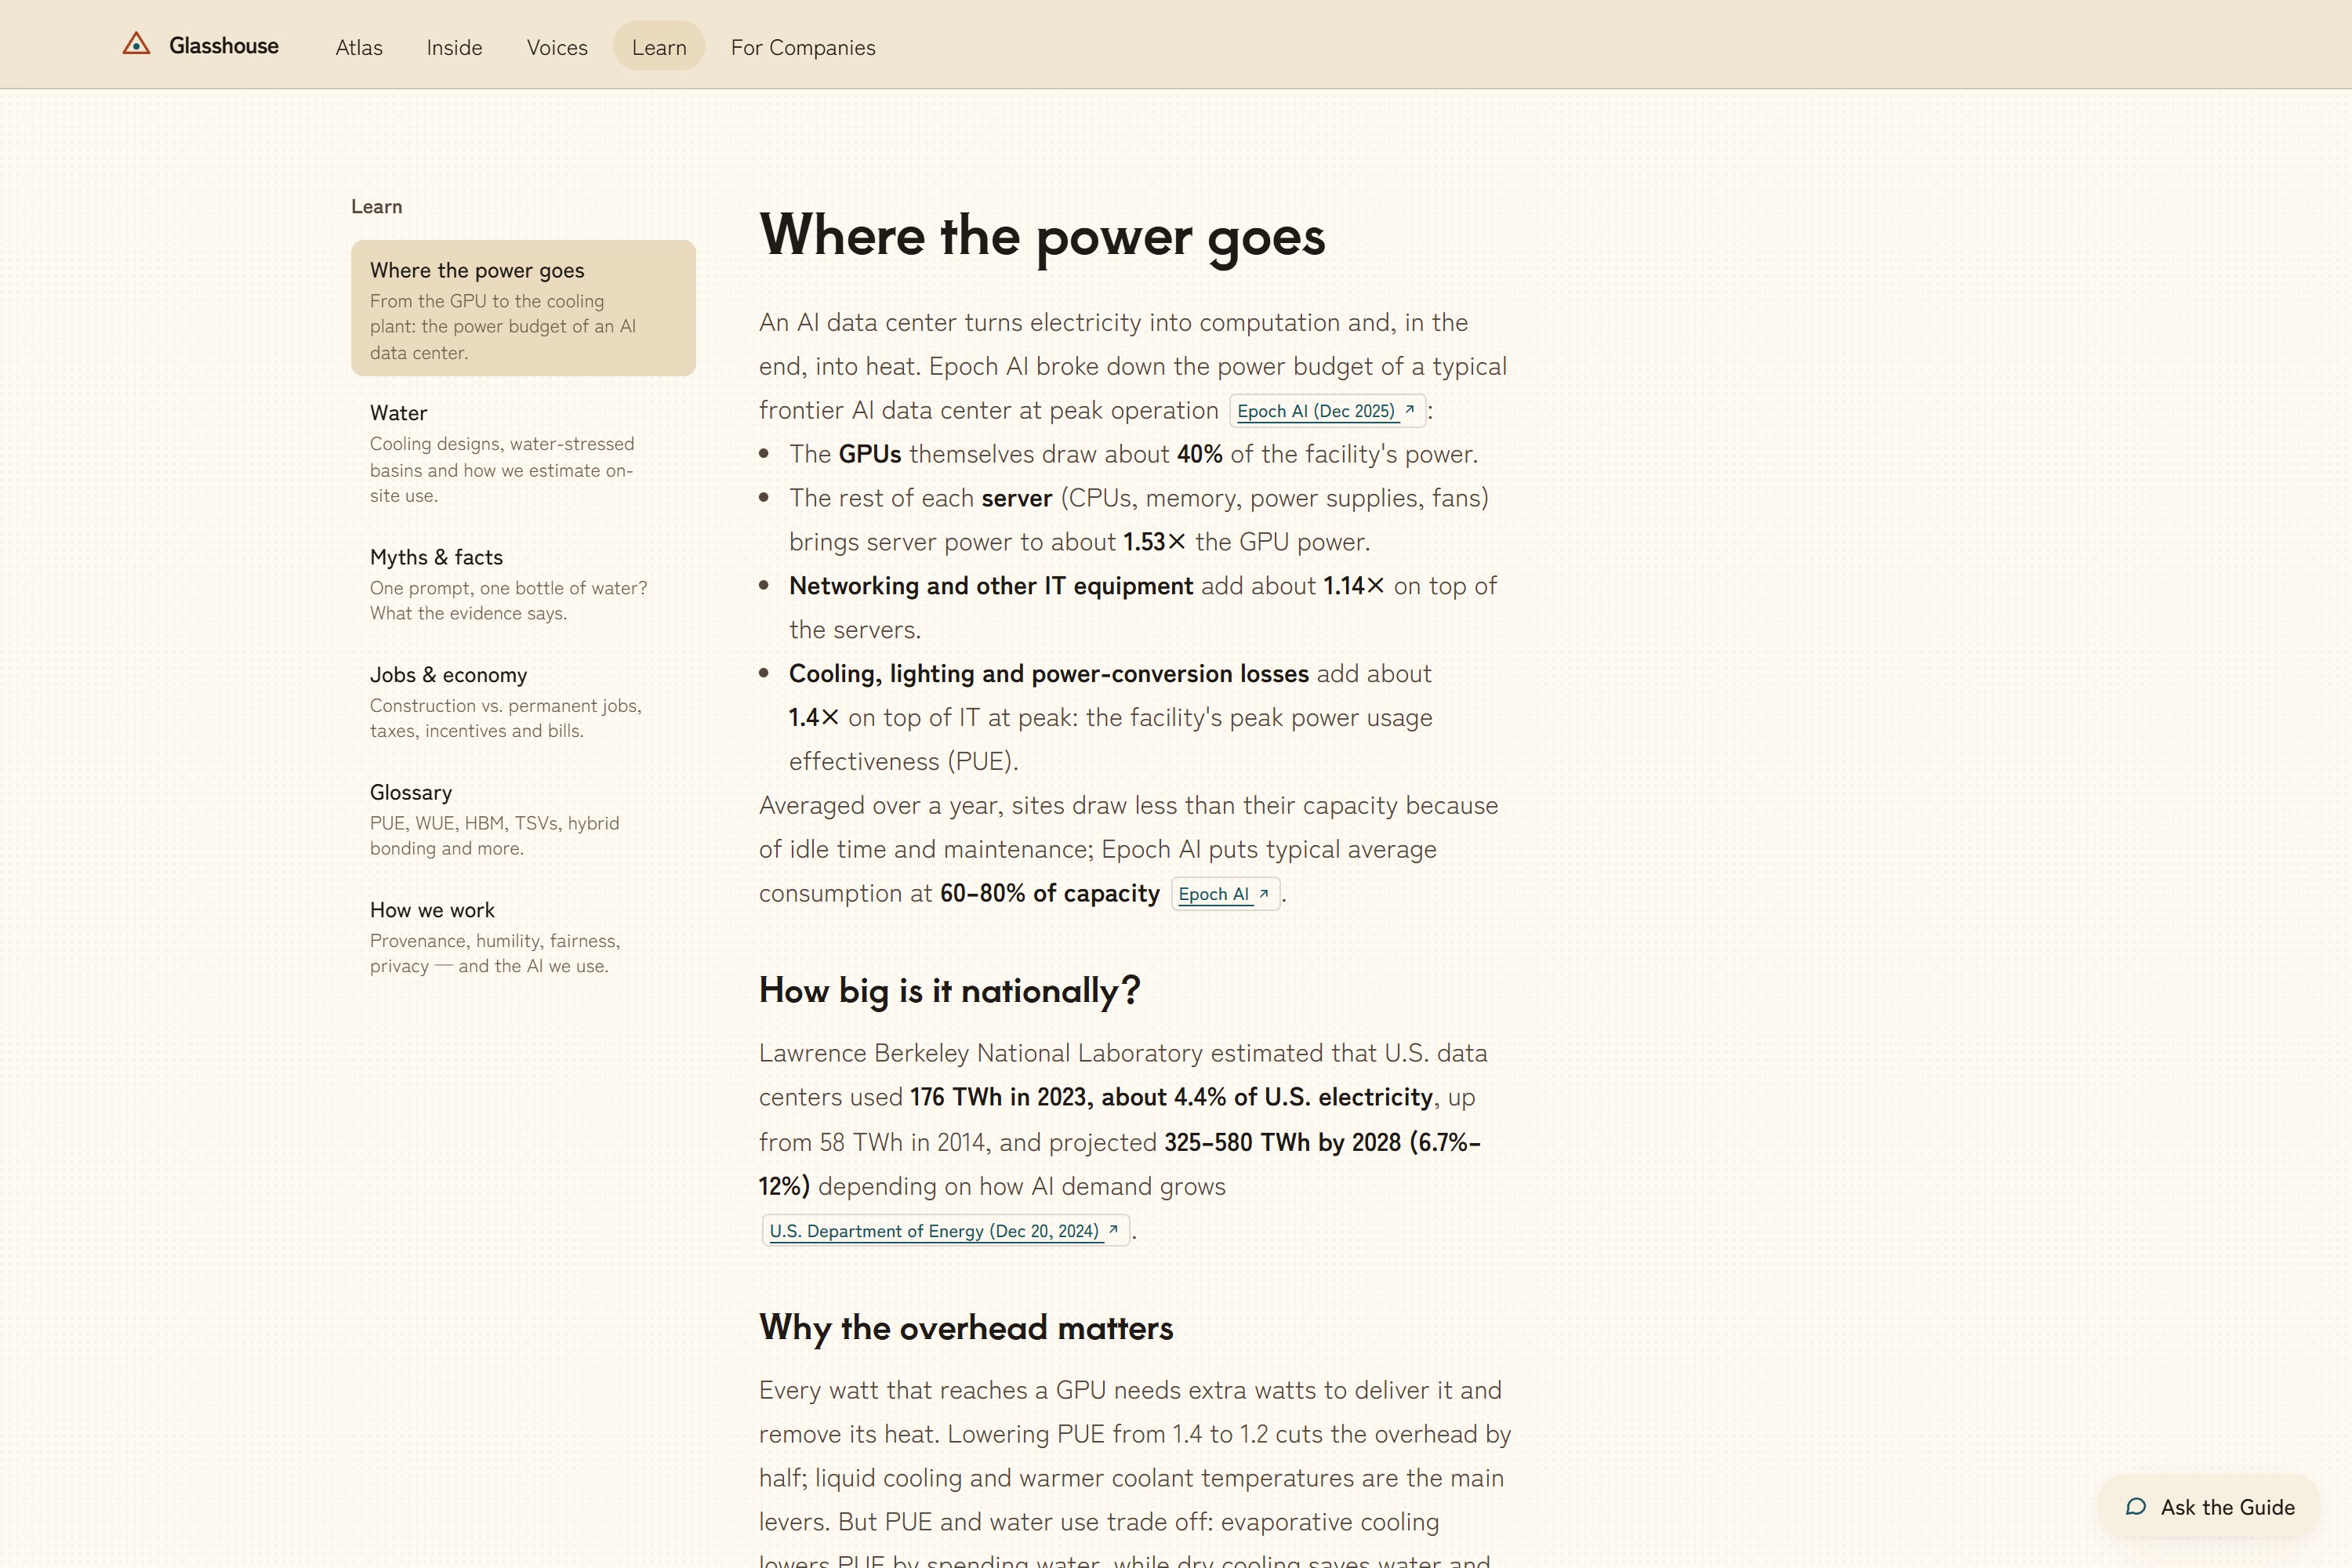
- Inside: a 3D tour. It zooms from the campus to the data hall, rack, compute tray, GPU package, HBM memory stack and bonds, down to a single transistor. A "Follow one prompt" story traces what happens between pressing send and reading the answer, and what that costs in energy and water.
- Voices. Residents report noise, lights, water, traffic, jobs or good things. Reports are AI-screened for personal data and harm, anonymized, shown in aggregate, and operators can reply.
- Company Portal. An operator claims a facility and uploads a sustainability report or permit. AI extracts each figure with the exact quote and page number, a human approves every line before it goes public, and the score updates. A Coach suggests concrete next steps.
- AI Guide on every page. It's powered by IBM Granite. It answers only from the site's sourced data, cites what it used, says when it doesn't know, and can drive the map and the 3D tour ("show me the cooling").
How we built it
Frontend: React 19, TypeScript, Vite and Tailwind 4. MapLibre GL with deck.gl draws the map on OpenFreeMap vector tiles. three.js through React Three Fiber renders the 3D levels: the large ones (campus, hall, rack, tray) are Blender models built by scripts, and the chip, memory and bond levels are procedural. D3 handles the charts and the power Sankey.
Backend: FastAPI, PostgreSQL with PostGIS (spatial queries such as nearest facility), pgvector, Redis and an RQ worker for document extraction. The REST API is documented with OpenAPI.
IBM AI stack:
- Granite 4 (
granite-4-h-smallon watsonx.ai) powers the Guide, extraction and the Coach. - Granite Guardian's risk criteria are used for safety. Guardian itself isn't callable on our watsonx plan, so Granite judges with Guardian's published criteria: screening questions, checking answers against their sources, and screening community reports. Granite Guardian 4.1 runs locally as the offline option.
- Docling reads uploaded PDFs with page numbers and tables.
- Mellea enforces rules on extraction output: the quote must appear on the cited page, and units must normalize.
- granite-embedding-english-r2 indexes 5,000+ sourced passages for retrieval.
Data (all open, licensed and listed on the Sources page):
| Source | What it gives us |
|---|---|
| Compute Atlas | Facility list (CC BY 4.0) |
| Data Center Index | Facility details (CC BY) |
| Epoch AI | Frontier-site estimates |
| OpenStreetMap | Building footprints |
| EPA eGRID | Grid emissions |
| EIA | Electricity prices |
| WRI Aqueduct 4.0 | Basin water stress |
| CDC/ATSDR Environmental Justice Index | Neighborhood context |
Estimates are explainable. For example, on-site water is modeled as
$$ \text{gal/day} = \frac{\text{MW} \times 1000 \times 24 \times u \times \text{WUE}}{3.785} $$
where \(u\) is utilization (0.6–0.8) and WUE (water use per unit of energy) depends on the cooling type. Every estimate shows its formula, its inputs and a low–high range.
How it would be used and funded
- Residents look up what is near them, see how each number is known, and report what they notice.
- Journalists and local officials get a sourced starting point before a hearing or a story.
- Operators get a neutral place to disclose, reply to neighbors and see what would improve their score.
There is no business model by design. Glasshouse is meant to run as a public commons, funded by government grants and/or a consortium of AI and data-center companies, like other open-data infrastructure. It sells nothing, has no ads, and stores no personal data from reports.
Responsible AI
The site applies responsible AI to AI's own footprint:
- AI never invents facts. The Guide answers only from sourced data, and each answer is checked against its sources.
- Humans approve everything that publishes. That covers both company figures and community reports.
- Context, not accusation. Environmental justice data is shown as neighborhood context, never as proof a facility caused harm.
- Fairness to both sides. Operators get a right of reply, and the score rewards transparency rather than punishing size.
- Accessibility. There's a text-only version of the 3D tour, and reduced-motion is respected.
Challenges
- There is no complete public list. Sources overlap and disagree, so facilities had to be merged and deduplicated across datasets.
- Most per-site numbers aren't public. Building estimates that are honest about uncertainty, with ranges and formulas instead of single numbers, was harder than showing a number.
- "MW" is ambiguous. Announced capacity sometimes means IT load and sometimes total draw, so the range carries that ambiguity instead of guessing.
- 3D performance in a browser. Going from a kilometer-wide campus to a 10-nanometer transistor needed dynamic camera planes, instancing, and capped detail with honest "representing N" labels.
- Small local models were too slow for a live Guide, so we moved to watsonx and kept a cached fallback for demos.
What we learned
Transparency is a design problem as much as a data problem. Labeling how each number is known, and admitting what's missing, made the site more trustworthy than any single figure could. We also learned how far a small, well-grounded model goes when it is only allowed to answer from sources and is checked before it speaks.
What's next
- State permit and utility-filing scrapers, to turn more "Not disclosed" into Filed.
- Partnerships with utilities and operators to publish verified data.
- Email delivery for Portal sign-in.
- A full accessibility audit.
AI tools disclosure
Most of the code was written with AI coding assistants (Claude and Kiro). IBM Bob was installed but not used. IBM Granite, Docling, Mellea and granite-embedding are the AI that runs inside the product.
Built With
- ai
- blender
- d3.js
- deck.gl
- docker
- docling
- fastapi
- granite-embedding
- granite-guardian
- ibm-granite
- maplibre
- mellea
- openstreetmap
- pgvector
- postgis
- postgresql
- python
- react
- react-three-fiber
- redis
- tailwindcss
- three.js
- typescript
- vite
- watsonx


Log in or sign up for Devpost to join the conversation.