-
-
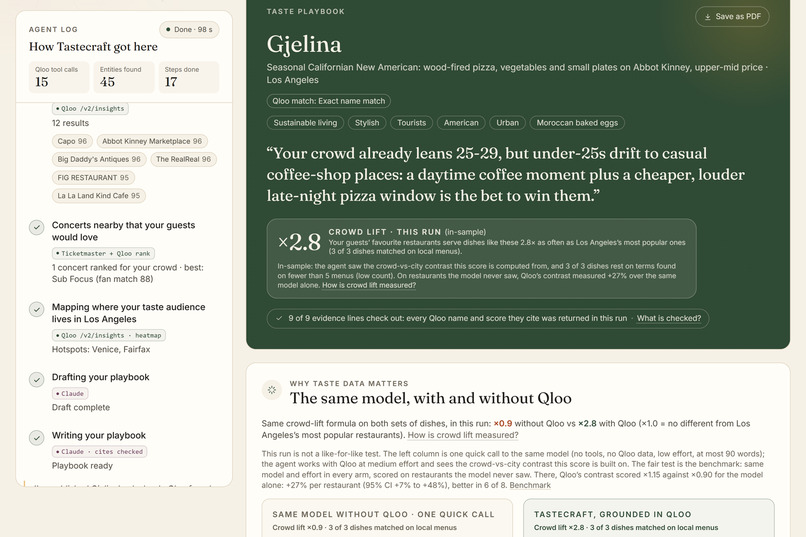
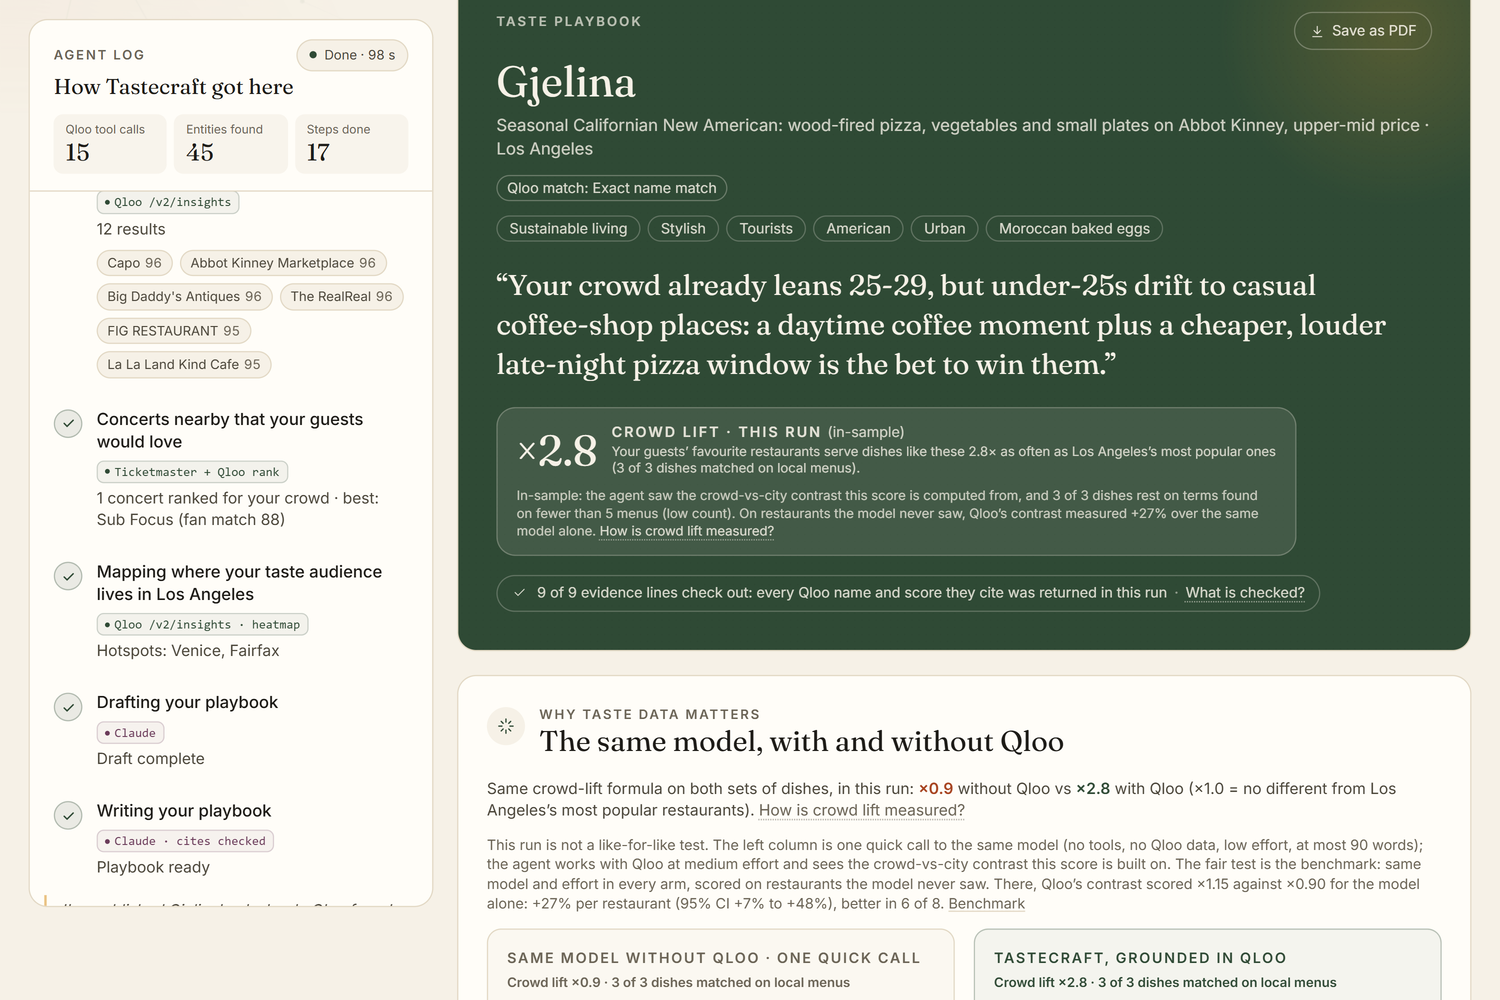
A real, recorded Gjelina run: crowd lift ×2.8 this run (in-sample), and right below it ×0.9 for the same model without Qloo.
-
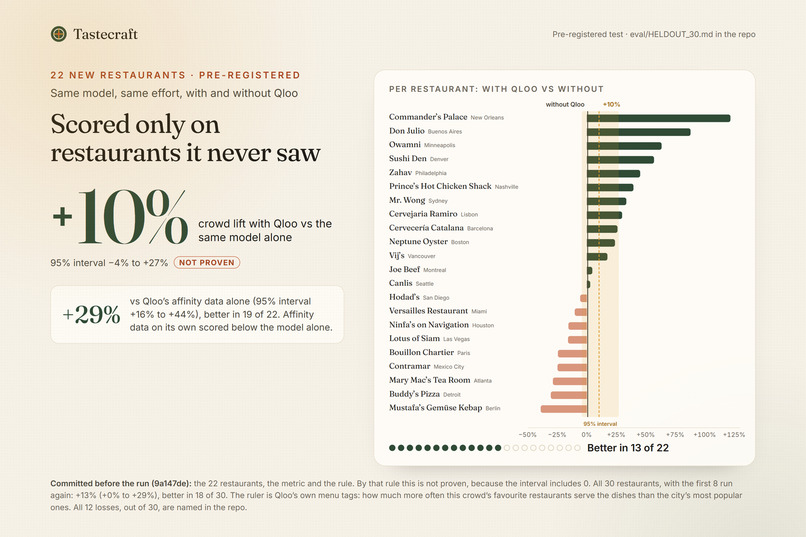
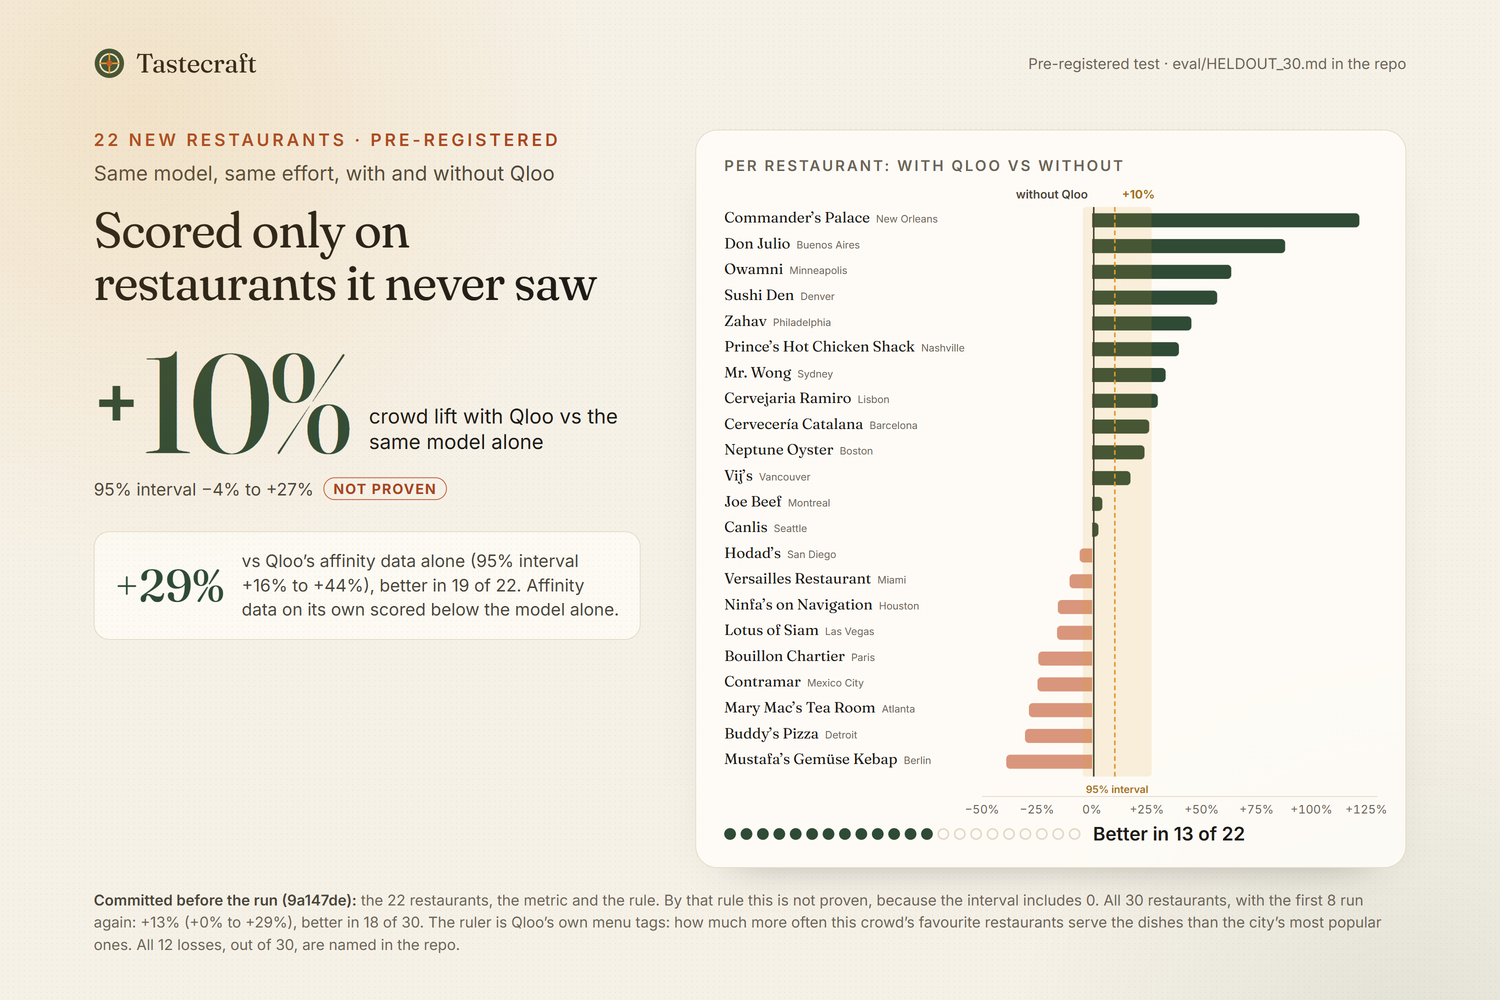
Pre-registered test on 22 new restaurants: +10% vs the same model alone, not proven. +29% vs Qloo affinity data alone.
-
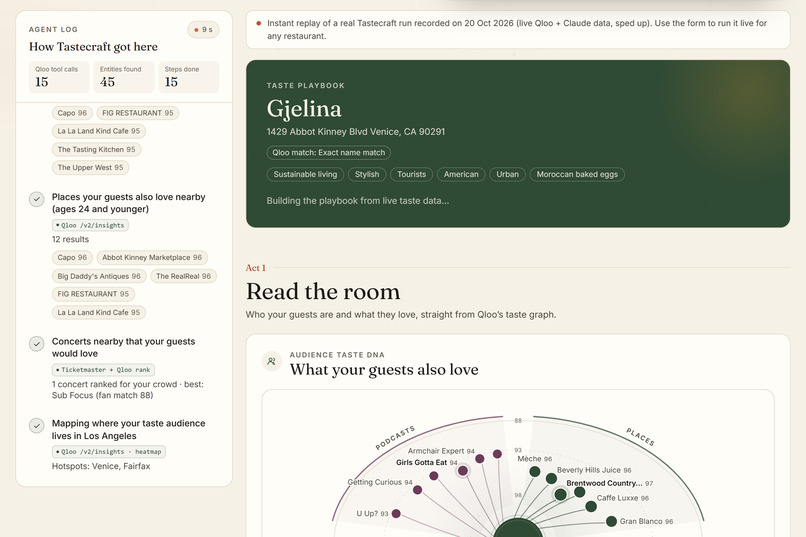
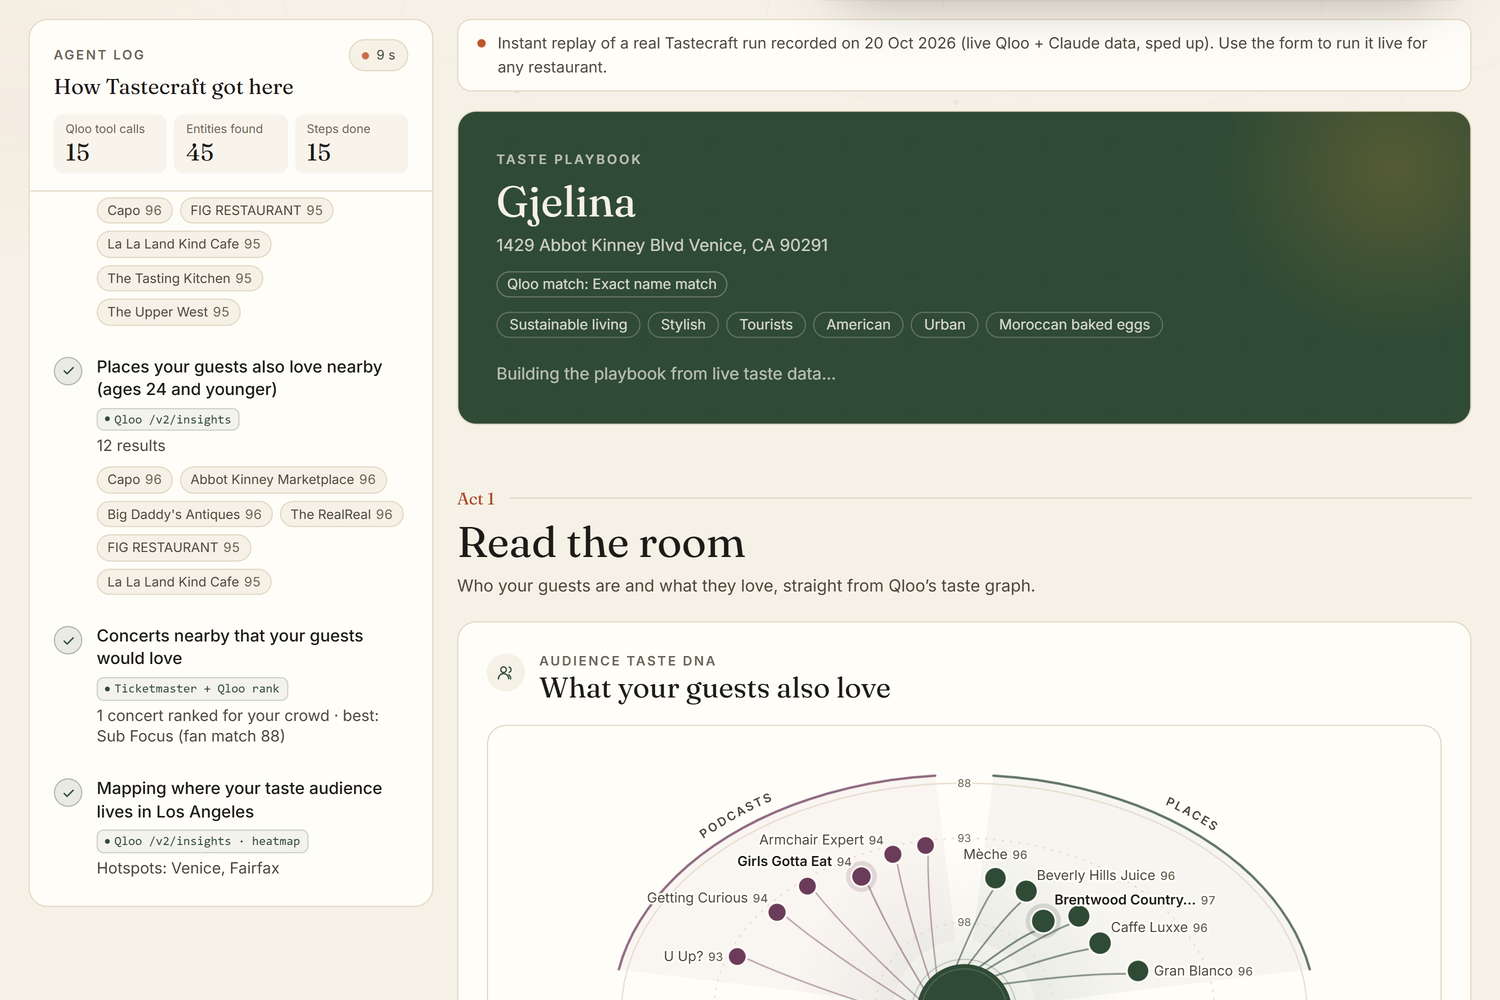
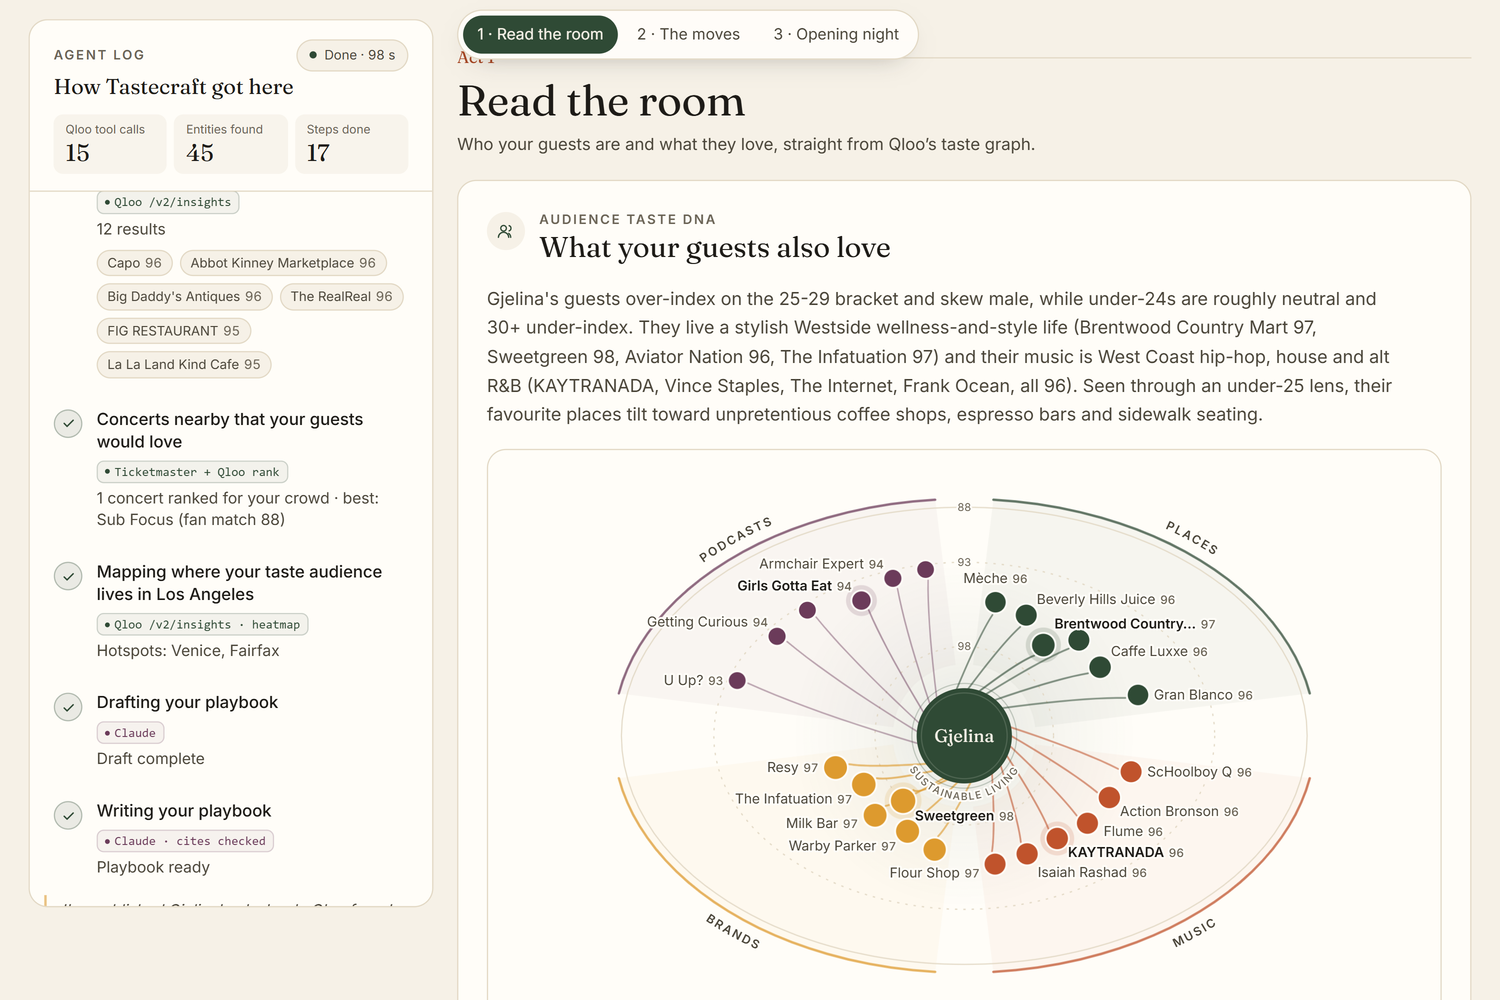
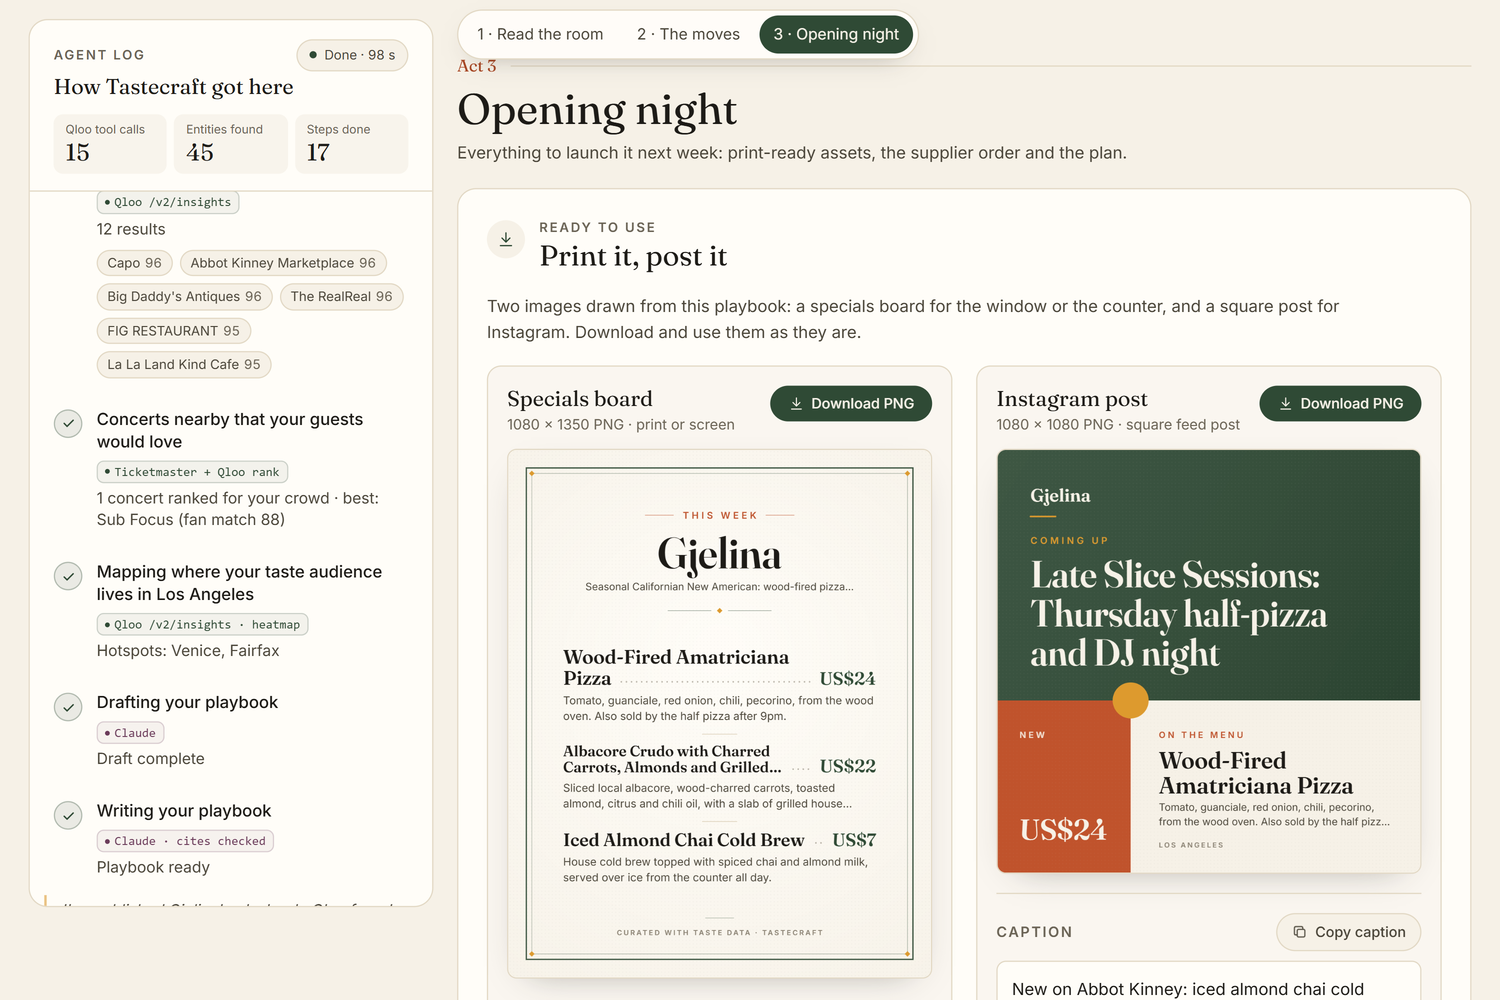
The agent mid-run: each Qloo call with its endpoint and results, and the counters (15 Qloo tool calls, 45 entities found).
-
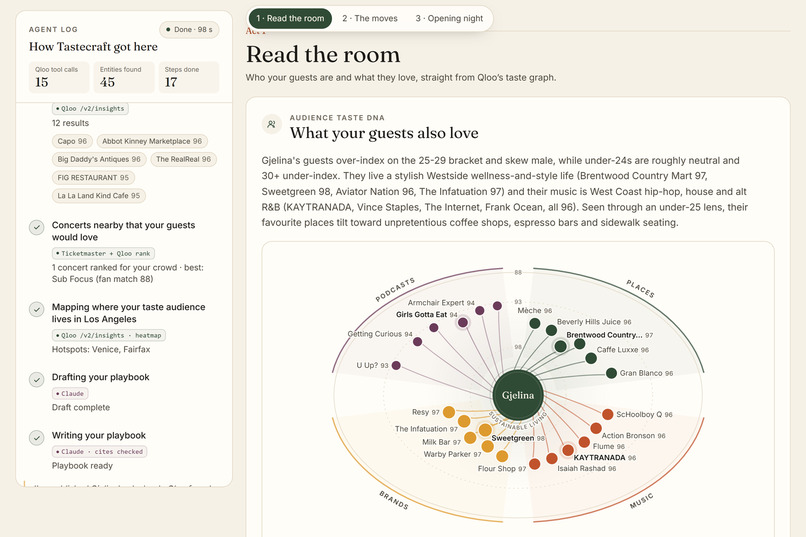
Read the room: the places, music, brands and podcasts Gjelina's guests also love, each with its Qloo affinity score.
-
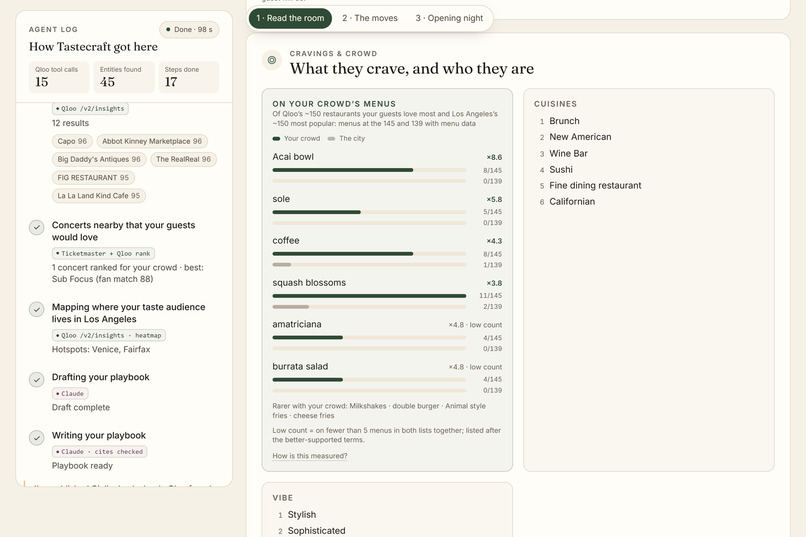
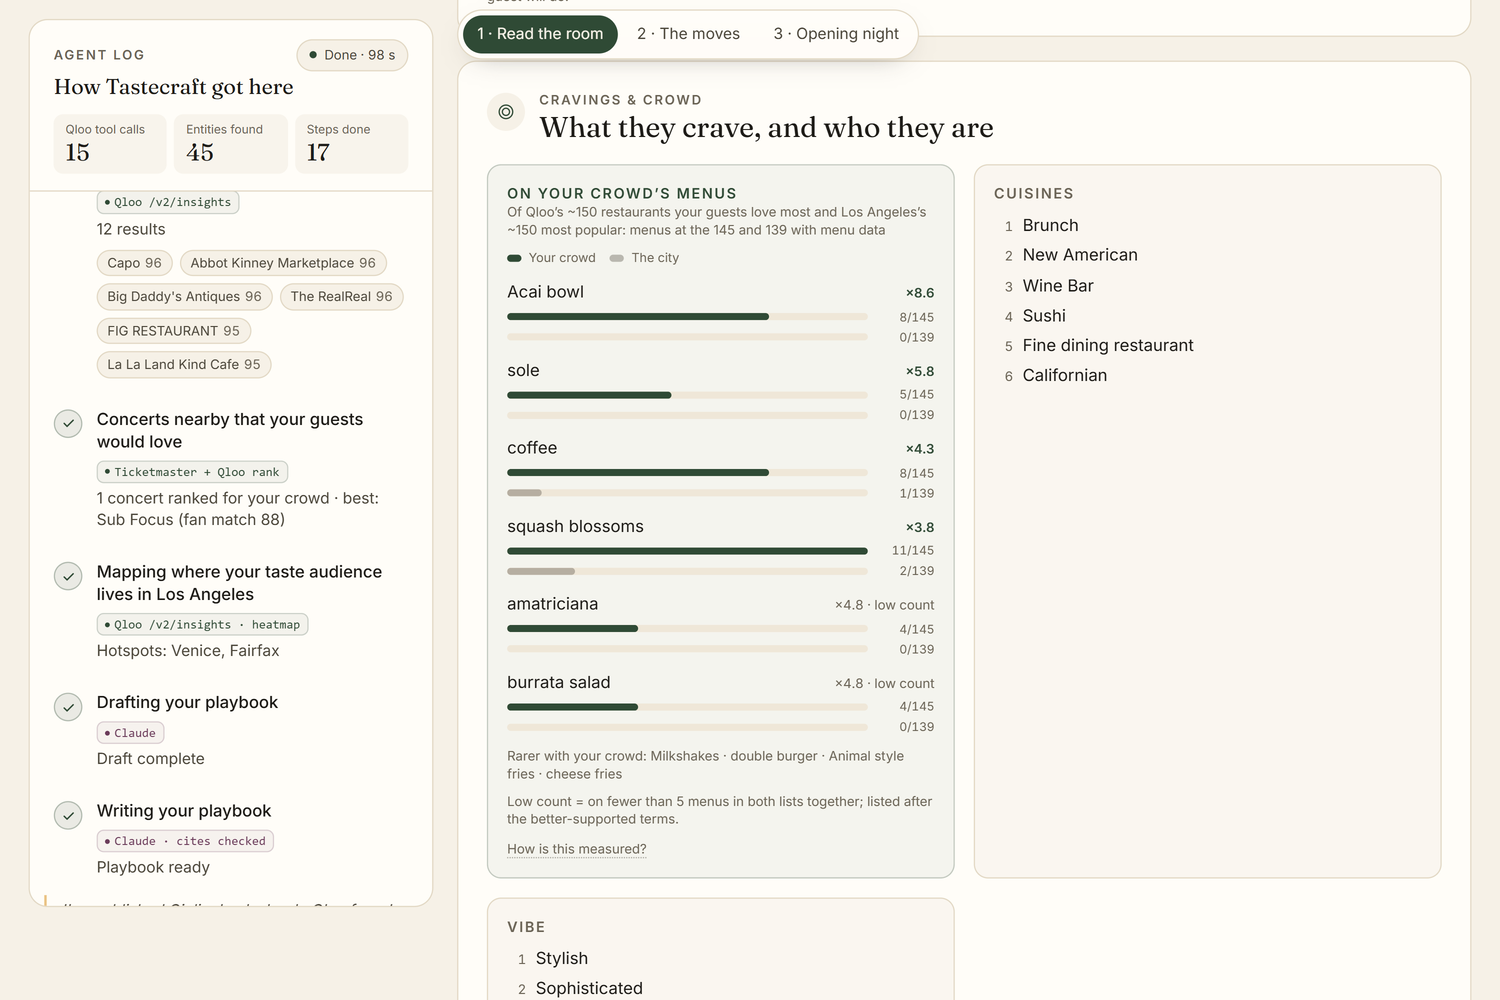
Crowd vs city: how many of the crowd's favourite places serve a food vs the city's top places (acai bowl 8 of 145 vs 0 of 139).
-
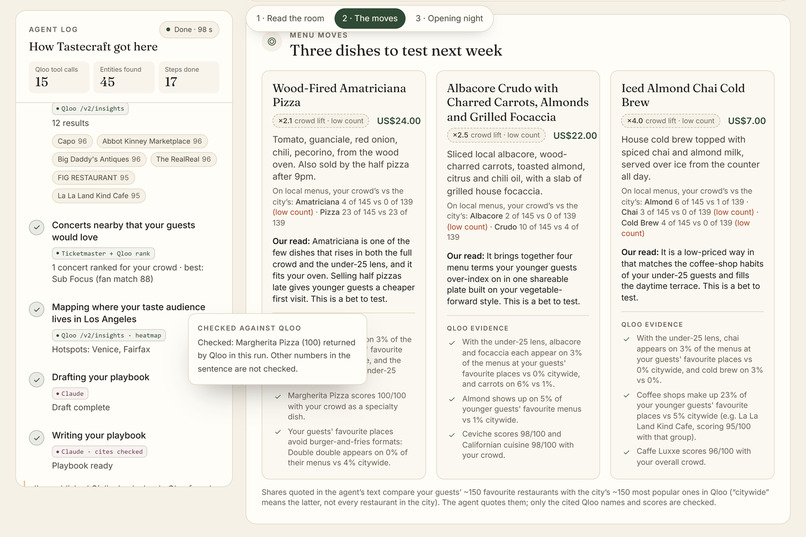
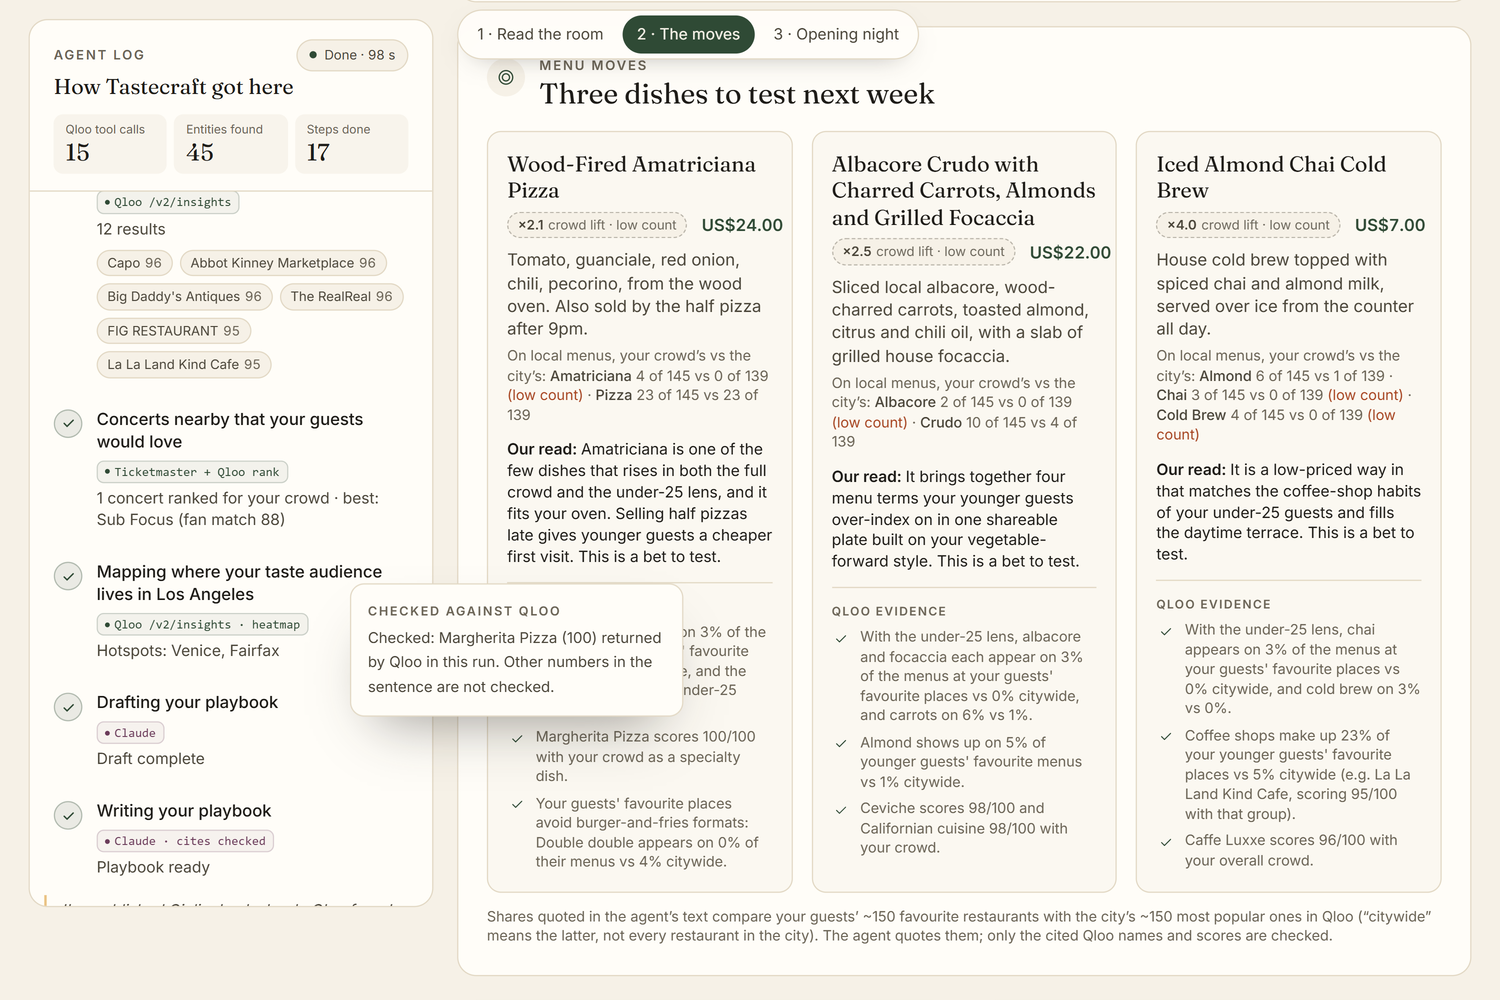
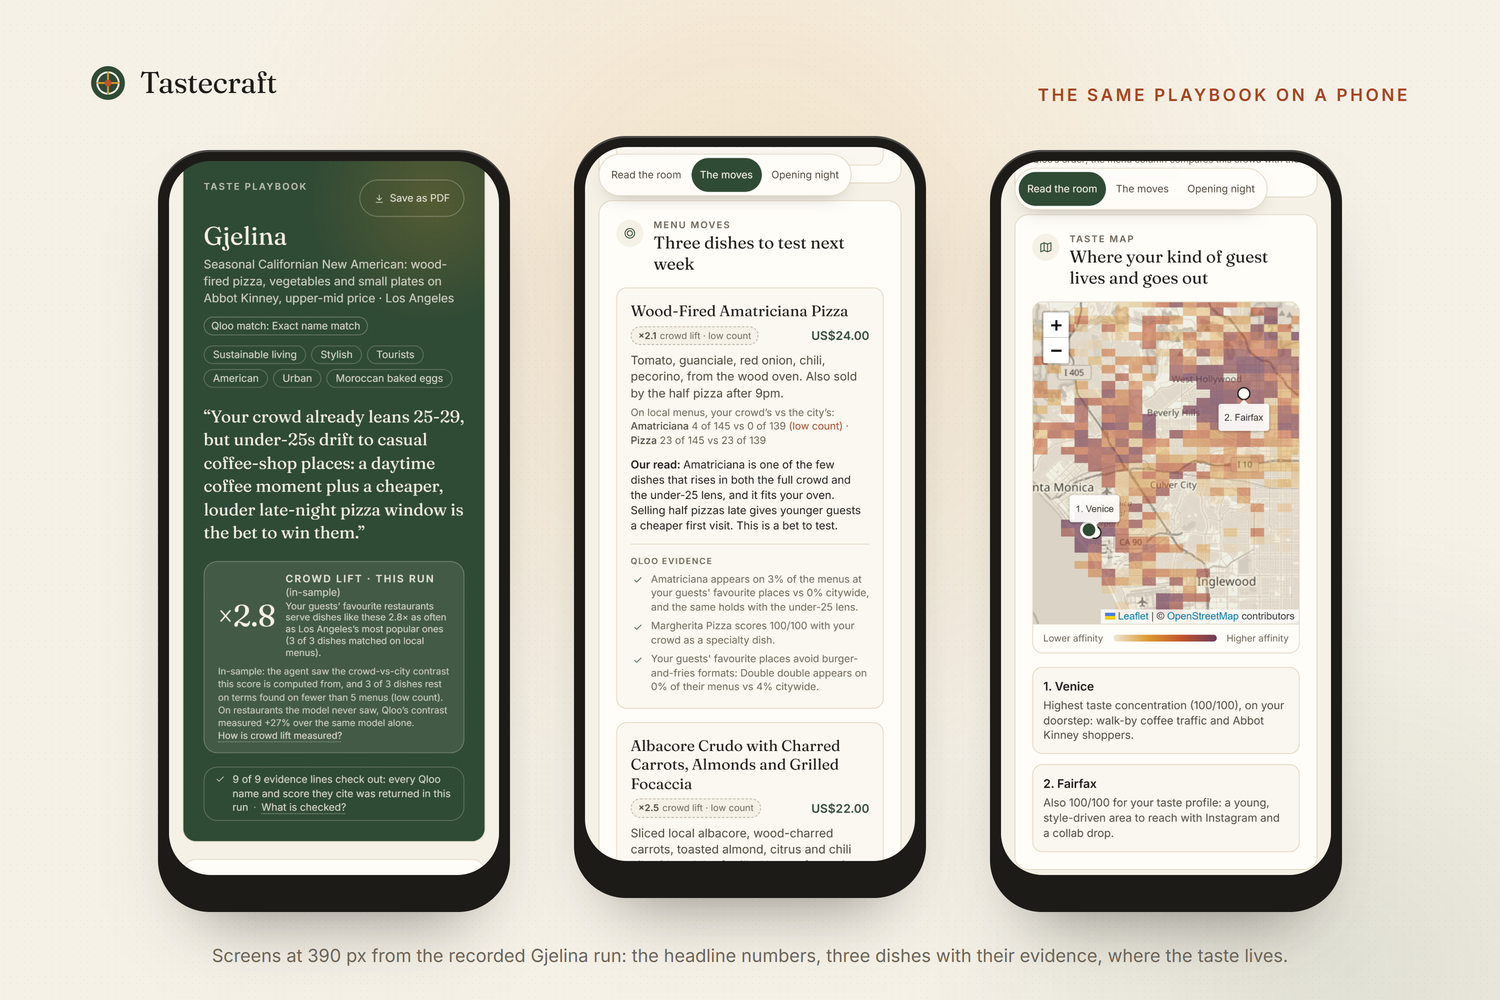
Three dishes to test, each with its crowd lift, local menu counts and a low-count mark. A ✓ shows the Qloo name and score checked.
-
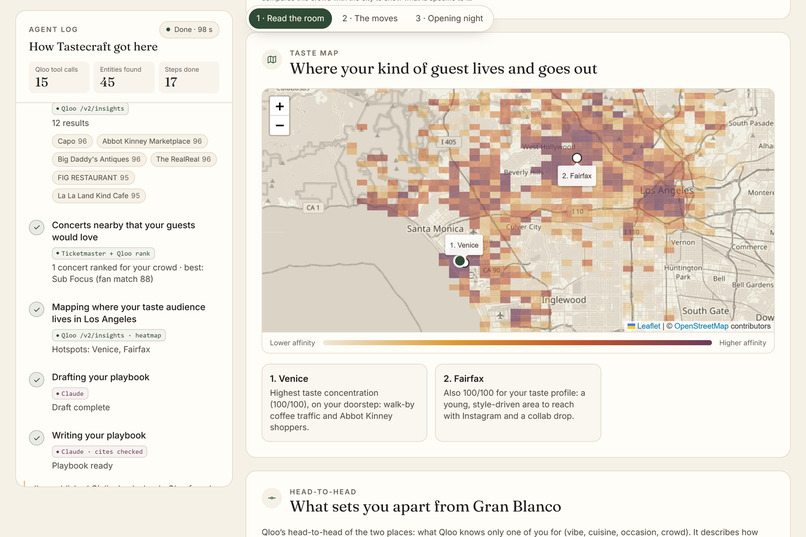
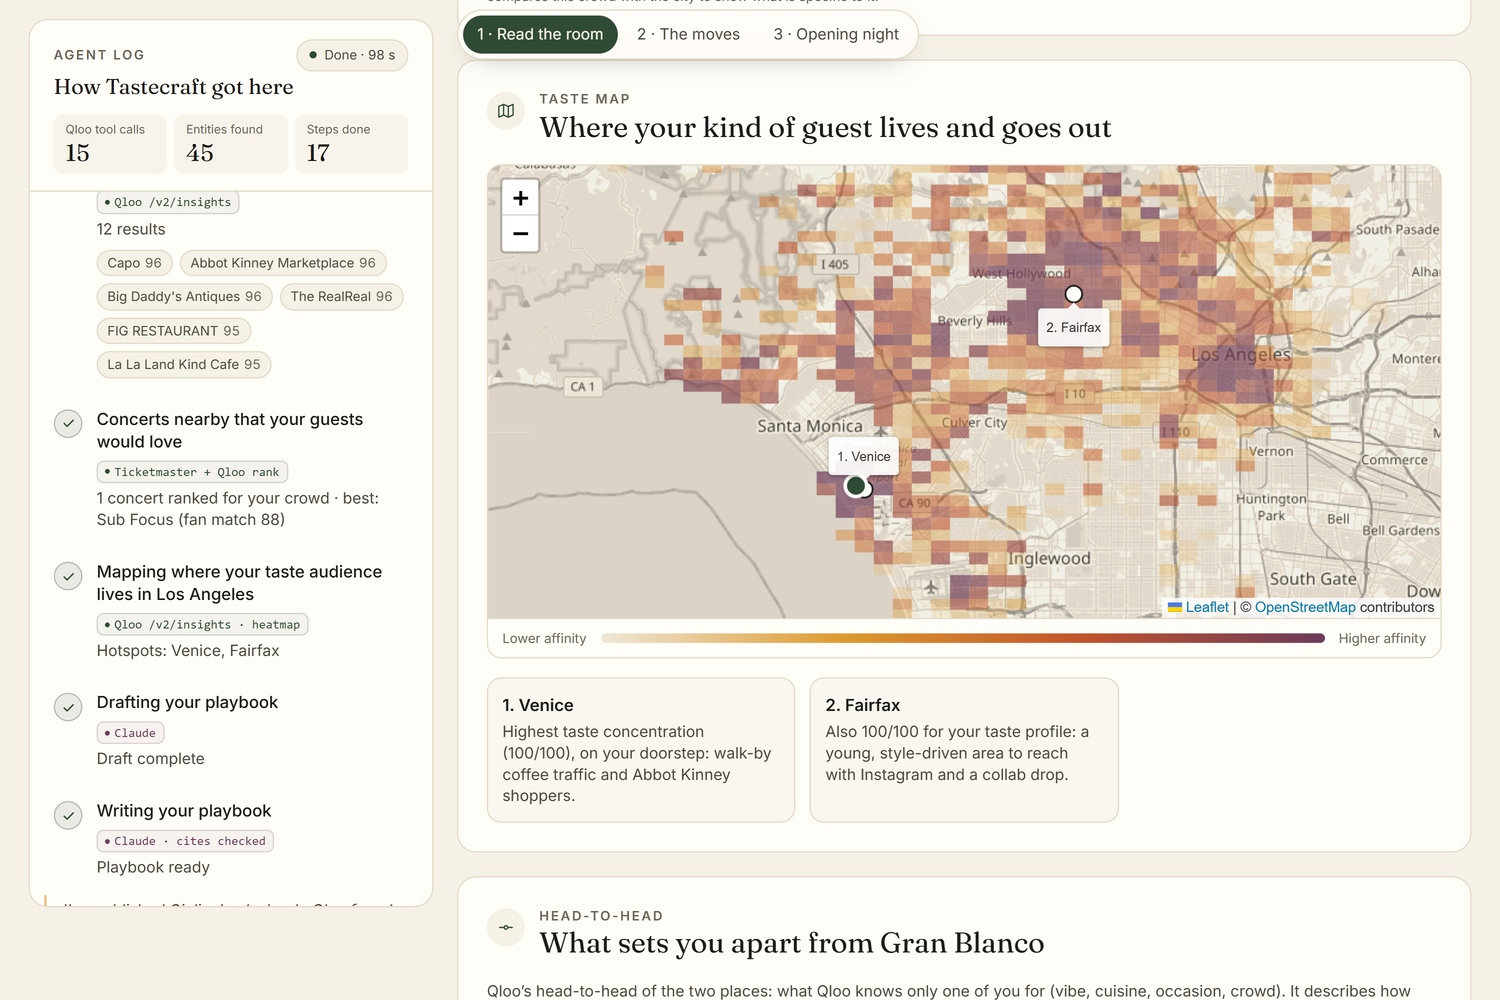
Where this taste lives: Qloo's heatmap of Los Angeles, Venice and Fairfax named, and below it the head-to-head with Gran Blanco.
-
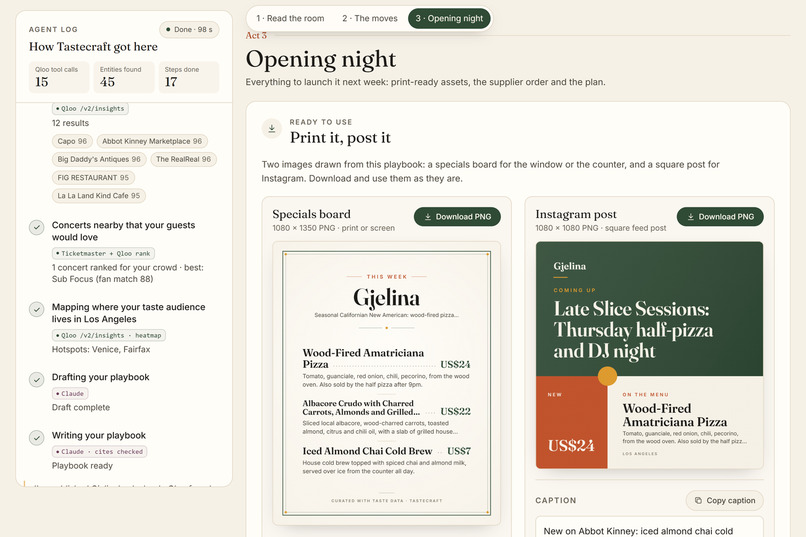
Opening night: a specials board and an Instagram post drawn from the playbook, ready to download, with the caption to copy.
-
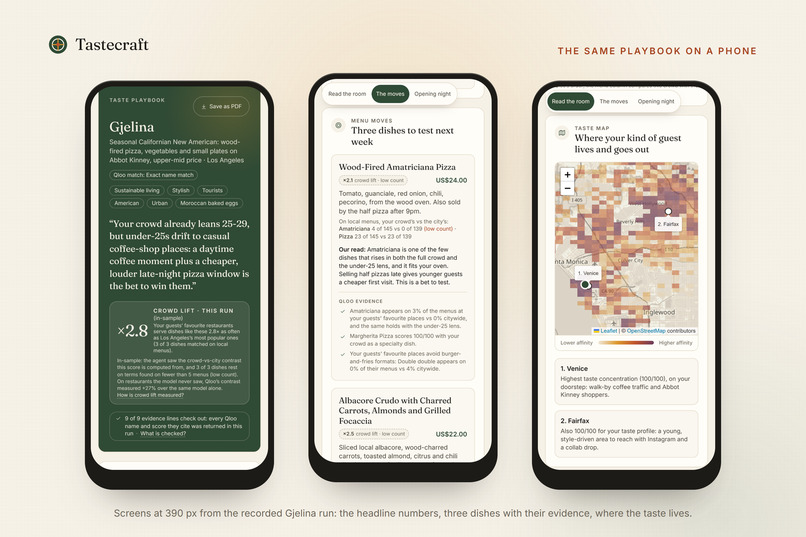
The same playbook on a phone (390 px): the header with this run's in-sample lift, three dishes with their evidence, the map.
Tastecraft tells an independent restaurant what its own crowd likes, from Qloo's taste graph, and turns it into next week's plan: three dishes to test, an event, a post and a supplier order.
Judge it in 60 seconds
- Open https://tastecraft-xi.vercel.app and press Replay on the Gjelina, Los Angeles card. It's a real run (Qloo + Claude) that I recorded, replayed in about 15 seconds. Katz's Delicatessen is the one with the best concert matches.
- Under the headline you'll see this run's crowd lift (×2.8 for Gjelina). It's labelled in-sample, because the agent saw the crowd-vs-city contrast it's scored on. Right below it is the same model with and without Qloo, scored with the same formula.
- Open "Three dishes to test". Each dish shows its lift and the local menu counts behind it. If a term sits on fewer than 5 menus, it's marked "low count". An evidence line gets a check when the Qloo names and scores it cites came back in that run.
- If you want it live, type any restaurant and city. It takes about 2 minutes (median 128 s over 5 runs). Live runs are capped per day so the demo stays up. If the cap is hit, the page says so and offers the replays, which are always instant.
Or skip the wait: on the home page, scroll to "Now switch Qloo off" and flip the switch. It's the same recorded run with and without Qloo, both scored the same way.
What Qloo adds, measured on restaurants the model never saw. Before running anything, I committed a list of 22 new restaurants in 22 cities, the metric and the rule for reading the result (eval/PREREGISTRATION_30.md in the repo, commit 9a147de). Then I ran them, plus the 8 from my first test, with the same model at the same effort in every arm and each dish scored only on a held-out half of Qloo's restaurant lists (5 random splits). On the 22 new restaurants, Tastecraft's crowd-vs-city contrast gave +10% over the same model alone (95% interval −4% to +27%), better in 13 of 22. By my own rule that is not proven, because the interval includes zero. The +27% I first reported, from 8 restaurants, did not hold at this size. All 30 together give +13% (+0% to +29%).
What did hold is the comparison with Qloo's affinity data on its own. Given only the audience's affinity tags and favourite local places, the model did worse than with no Qloo data at all (×0.85, interval ×0.73 to ×0.99). The crowd-vs-city contrast beats that by 29% (interval +16% to +44%), in 19 of 22 restaurants. So the value is in comparing a crowd with its city, not in raw affinity. The full results are in eval/HELDOUT_30.md, and npm run eval:heldout reruns them (600 model calls, US$7.99 this time).
One thing to know about the ruler: it comes from Qloo too. Crowd lift is computed from Qloo's own menu tags, so it tests whether the dishes follow this crowd's Qloo signal, not whether guests will order them. The bigger numbers you'll see are in-sample. The badge on each replay (×2.8 Gjelina, ×2.9 Katz's, ×3.2 Casa Lucio) comes from an agent that saw the contrast it's scored on, next to a quick no-Qloo answer from one low-effort call. My first in-sample benchmark read ×2.44 against ×0.91.
How it fits the judging criteria
- Technical implementation. Eight Qloo workflows: seven over /search, /entities, /v2/insights (entities, tags, demographics, heatmap) and /v2/analysis/compare, plus concert ranking with the rank workflow from Qloo's official qloo-harness package. A crowd-vs-city contrast built from two Qloo queries, checked on a held-out benchmark. The Qloo names and scores cited in each evidence line are checked against that run's own Qloo responses. Bounded retries, request smoothing, 176 unit tests with CI and an MCP server.
- Design. You watch the agent work through Qloo call by call and see the plan drafted live. A one-click switch on the home page turns Qloo off and on for the same question. The with/without-Qloo comparison sits right under the headline. Then a taste constellation, a taste map with named neighbourhoods, lift and evidence on every dish, print-ready assets, in English and Spanish.
- Potential impact. More than 7 in 10 US restaurants are single-unit, with no insight team. Tastecraft gives the owner dishes, an event, a campaign, a supplier order and a week plan. There's a business case with a price hypothesis and a measured cost per playbook below.
- Quality of the idea. It uses the guests' other tastes and compares them with the city to find what's specific to this crowd. Katz's guests' other favourite places are cheap pizza slices, hot-dog counters and dive bars, which points to a weeknight pub-snack menu rather than more deli classics.
Inspiration
Before this I built Supplora, an AI tool that read supplier delivery notes for a family-run restaurant in Spain and loaded them into its management system (715 notes processed by September 2026). Sitting in that kitchen I kept seeing the same thing. The owners know their costs to the cent, but the week's special, the Thursday event and where to hand out flyers get decided on gut feel. Chains have insight teams for this. A 40-seat restaurant has the owner, at 11 pm, after service.
A general chatbot doesn't fix it. Ask what a tapas bar should add and it answers from the cuisine, so every tapas bar gets roughly the same advice. What's missing is who actually loves this specific place, what else they love, and what sets them apart from the rest of the city. That's what Qloo's taste graph knows.
What it does
The owner types the restaurant, the city and a goal ("fill quiet weeknights"). A Claude agent works through Qloo's taste graph in front of them and builds a playbook in three acts:
- Read the room. What the guests also love (local places, music, brands, films) as a taste constellation, what this crowd's favourite restaurants serve more often than the city's most popular ones, who they are, where in the city this taste lives, and what only this restaurant or only its closest rival is known for.
- The moves. Three dishes to test, each with a price, a crowd lift and Qloo evidence. An event built on the guests' music taste and on nearby concerts whose fans match this crowd. A ready-to-post caption aimed at the right neighbourhoods.
- Opening night. A supplier shopping list (CSV plus an order email), print-ready chalkboard and Instagram images, and a 7-day plan you can drop into a calendar.
The concert part is easiest to see with Katz's. The recorded run found two shows its crowd over-indexes on: Amber Mark at the Blue Note, 0.9 km away (fan match 92), and Will Varley at Mercury Lounge, 0.1 km away (fan match 87). The playbook turned them into a free pickle plate with any sandwich for ticket holders after the Blue Note set, and a dog, fries and beer combo before doors at Mercury Lounge.
An honest note on Gjelina. Its bet is a daytime coffee moment plus a cheaper late-night pizza window, and that overlaps with Gjelina Take Away next door at 1427 Abbot Kinney, which already sells wood-fired pizza and sandwiches from breakfast to dinner. The agent itself flagged that Take Away guests may be mixed into the signal. So I read the Gjelina playbook as: bring that daytime crowd into the restaurant itself. The replays are well-known restaurants on purpose. Qloo has rich data on them and a judge can check the output against what they know. A small place with thin data gets a thinner playbook, and its caveats say so.
How I built it, and how it uses Qloo
- The agent is Claude (claude-opus-5-5) with the Anthropic SDK's tool runner, adaptive thinking and streaming. It has eight Qloo-backed tools and a schema-checked publish_playbook tool, so the UI never parses free text.
- /search and /entities find the restaurant (exact, close or ambiguous, with a one-click switch). /v2/insights gives cross-domain affinity (places filtered to the city, other domains localised), tag families, demographics and the urn:heatmap taste map. /v2/analysis/compare sets the restaurant against its closest rival. Concerts are ranked for this audience with the harness rank workflow.
- Crowd lift is the score on every plan, and the server computes it. I make two Qloo queries in the same city: the ~150 restaurants this restaurant's audience loves most and the city's ~150 most popular. Only the ones with menu tags count (145 and 139 for Gjelina), and every count on screen uses those denominators. A dish's lift is how much more often the crowd's favourite places serve its food terms than the city's do. It replaced my first score, the mean affinity of the cited facts, after I measured that Qloo's top dish tags average 99.2 for one audience and 99.6 for the whole city. That score read 96 to 100 on every plan.
- Every name and score Qloo returns is recorded on the server. Each evidence line lists the Qloo names and scores it relies on; a name has to have come back in the run and a score has to match within 1 point. Names and numbers in the rest of the text aren't checked, and the app says so.
- It's also an MCP server (taste_profile, taste_playbook), so a POS copilot or Claude Desktop can call Tastecraft.
- Next.js 16, React 19, Tailwind 4, Leaflet with OpenStreetMap. Instant replays come from an encrypted private cache, so there's no Qloo data in the public repo. Live runs are rate-limited and have a kill switch.
A real restaurant tried it
I ran Tastecraft for my family's restaurant in Spain. Qloo knows it well, with 163 tags. The playbook bet on a weeknight vermouth and pintxos evening in the garden, the one thing Qloo says it has and its closest rival doesn't, plus three dishes to test. In the last week of October the restaurant tried the plan for two days and put its suggestions on the menu. It's too early for numbers, but my mother told me on the phone that guests liked it a lot and told them to keep it going.
Business case
Who pays: independent restaurants and small groups of 2 to 10 locations, per location per month, with the first playbook free. My price hypothesis is US$49 per location per month. I haven't tested it with a paying owner yet, and it's the first thing a pilot has to check.
What a playbook costs me: US$0.32 to 0.37 of Claude, from the token counts of two logged runs at Claude Opus 5.5 list prices (82k and 93k input tokens, mostly cache reads, and 8.7k and 9.2k output tokens). On the Qloo side it's 17 to 34 API requests, counted from the code paths the three recorded runs took. The crowd and city lists alone are 6 requests, and the concert ranking adds one lookup per artist. A weekly playbook is about US$1.50 of Claude per location per month. Qloo's commercial price isn't public, so I left it out.
How it reaches owners: the app marketplaces that POS systems run (Toast, Square and Clover each have one) and reservation platforms' partner programs, through the MCP endpoint. Food distributors are the third route, because the shopping list is already an order for them.
How big it can get: there were 412,498 independent restaurants in the US at the end of 2025, per Technomic data reported by Nation's Restaurant News. The National Restaurant Association's 2025 pocket guide says more than 7 in 10 US restaurants are single-unit. Just as arithmetic, not a forecast: 1% of US independents at that price is about 4,125 locations and US$2.4M a year.
Why it's good for Qloo: every playbook is Qloo API usage, and a weekly one turns each subscribing restaurant into a recurring Qloo customer by proxy. Why me: I've already shipped an AI tool into a working restaurant kitchen, and I know where the owner's time goes.
Responsible data handling
No personal data, only Qloo's aggregated, privacy-first signals. Scores are written as group tendencies, never as predictions about a guest. Qloo responses are cached on the server only and never published in the repository (replays are encrypted at rest). The owner decides everything; nothing is ordered or posted automatically.
Challenges
- Finding the right restaurant. Names collide, and one of my own sample buttons resolved "Gjelina, Los Angeles" to the convention centre until I added a name-only fallback.
- A score that tells plans apart. Affinity sits near 100 for anything popular, so I built the crowd-vs-city lift and measured it.
- Reading Qloo's outputs carefully. When I compared two places, every shared tag came back with the same weight (about 0.731), so I stopped showing it as a score and now show what only one side has.
- Small counts. A term on 4 menus against 0 reads about ×4.8 after smoothing, so the app marks anything on fewer than 5 menus as low count and never leads with it.
- A fair benchmark. My first one let the model see the contrast it was scored on, which gave ×2.44. A held-out split on 8 restaurants brought it down to +27%. Then I locked a list of 22 new restaurants before running them, and it came out at +10%, not proven. That last one is the number I report.
- Two languages. Qloo's menu tags are mostly English, so when I asked for a playbook in Spanish, its dishes got scored on words few local menus use (brocheta, where the menus say skewer). My test run read ×0.7 with Qloo and ×0.7 without it, which told me nothing. Now each dish also carries its English name, on both sides of the comparison, and English playbooks score exactly as they did.
What I'm proud of
- A test I couldn't tune: 22 new restaurants committed before the run, the result published as it came out, and the 12 restaurants where it lost named one by one.
- The cited Qloo names and scores in every evidence line are checked against that run's own responses, and the page says what isn't checked.
- From a restaurant's name to a supplier order, a post and a calendar in about 2 minutes.
What I learned
The value isn't that AI writes a plan. It's that the plan starts from who actually loves this restaurant, and from what makes them different from everyone else in the city.
What's next
Connect POS sales to learn which bets worked. Run a first paid pilot with a small independent. Use Qloo's trending and audiences endpoints to flag artists and brands rising with a crowd. Game-day and concert-night playbooks. Rerun the same 22 restaurants with the house cuisine kept as a constraint, pre-registered again.
Where it fails
The contrast lost to the model alone in 12 of the 30 restaurants. In 10 of them the model alone had already scored above ×1 by sticking to the restaurant's own cuisine, and the contrast pulled it towards dishes that the crowd's other places don't serve more often than the city does. The worst case is Mustafa's Gemüse Kebap in Berlin: lahmacun and lentil soup without Qloo, cheese fries and cheesecake with it. Buddy's Pizza in Detroit, Mary Mac's Tea Room in Atlanta, Au Cheval in Chicago, Contramar in Mexico City, Bouillon Chartier in Paris, Lotus of Siam in Las Vegas, Ninfa's in Houston, Dishoom in London and Versailles in Miami lost the same way. At Mama's Fish House and Hodad's the gap is within noise. It loses most at casual places: at $ and $$ it won in 3 of 11 new restaurants, at $$$ and $$$$ in 10 of 11. It helps most where the model alone is weak: Commander's Palace went from ×0.72 to ×1.59. The next thing I want to test, pre-registered on the same list, is keeping the house cuisine as a constraint when the agent reads the contrast.
Known limitations
Crowd lift is a proxy, not demand: it says the crowd's favourite places serve dishes like these more often, not that guests will order them here. Many per-term counts are single digits and coverage varies by city. On 22 new restaurants the gain over the same model alone is +10% and not proven, and it loses most at casual places where the model alone already suggests the house's own dishes. The full list is in the README.
Built With
- agents
- anthropic
- claude
- leaflet.js
- mcp
- next.js
- openstreetmap
- qloo
- qloo-harness
- react
- tailwindcss
- ticketmaster
- typescript
- vercel
- vitest
- zod
