Inspiration
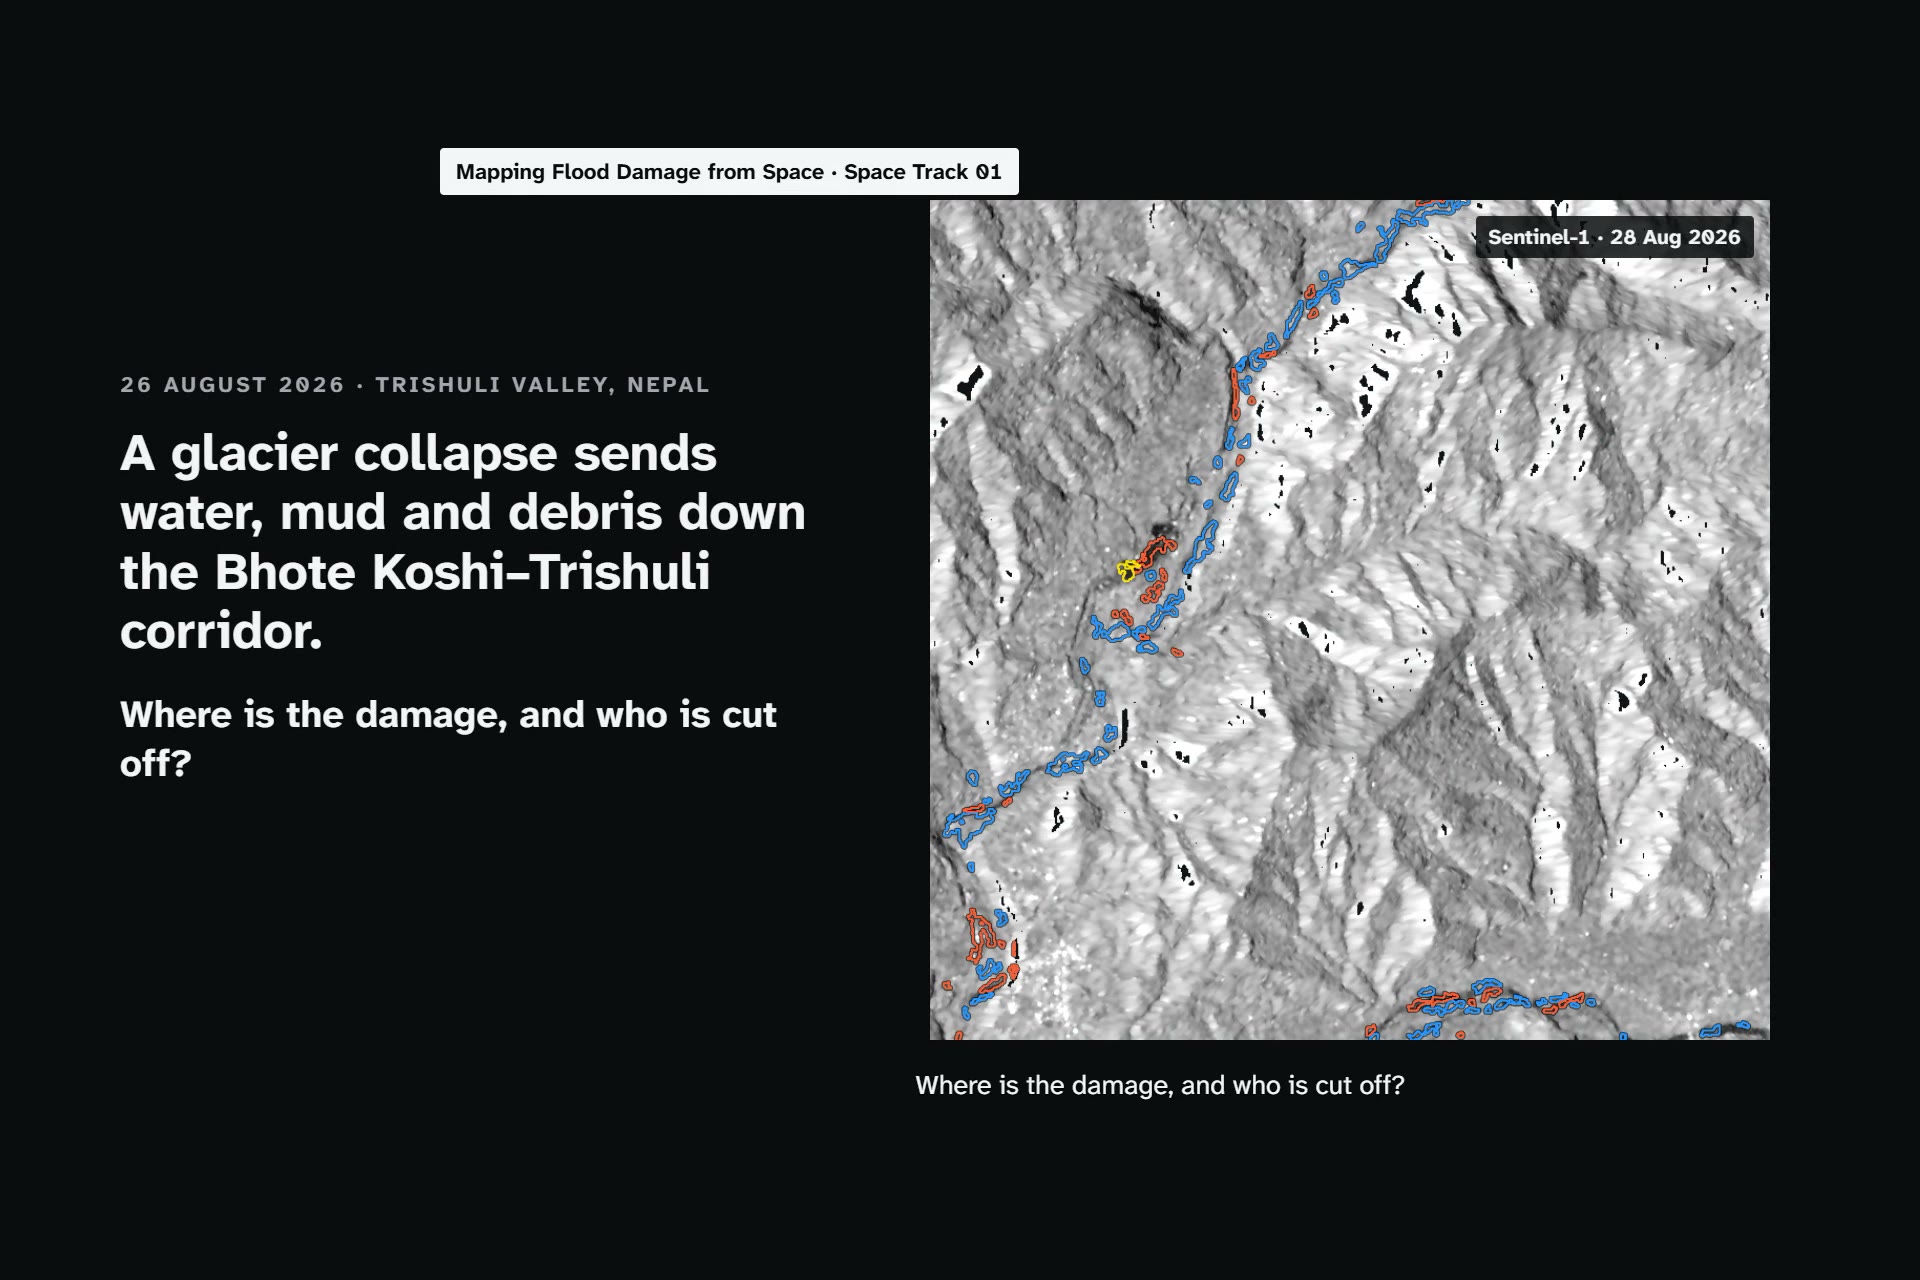
On 26 August 2026 a glacier collapse sent water, mud and rock down the Bhote Koshi and Trishuli valleys in Nepal. Ground sensors were swept away and roads, bridges and phone lines failed. Radar satellites see through monsoon cloud and the data is free, but turning two radar scenes into an answer a rescue team can use is the hard part. We wanted the answer to three questions, for any valley and date, and a system honest about how much of the damage it cannot see.
What it does
Give TANGO an area and a flood date.
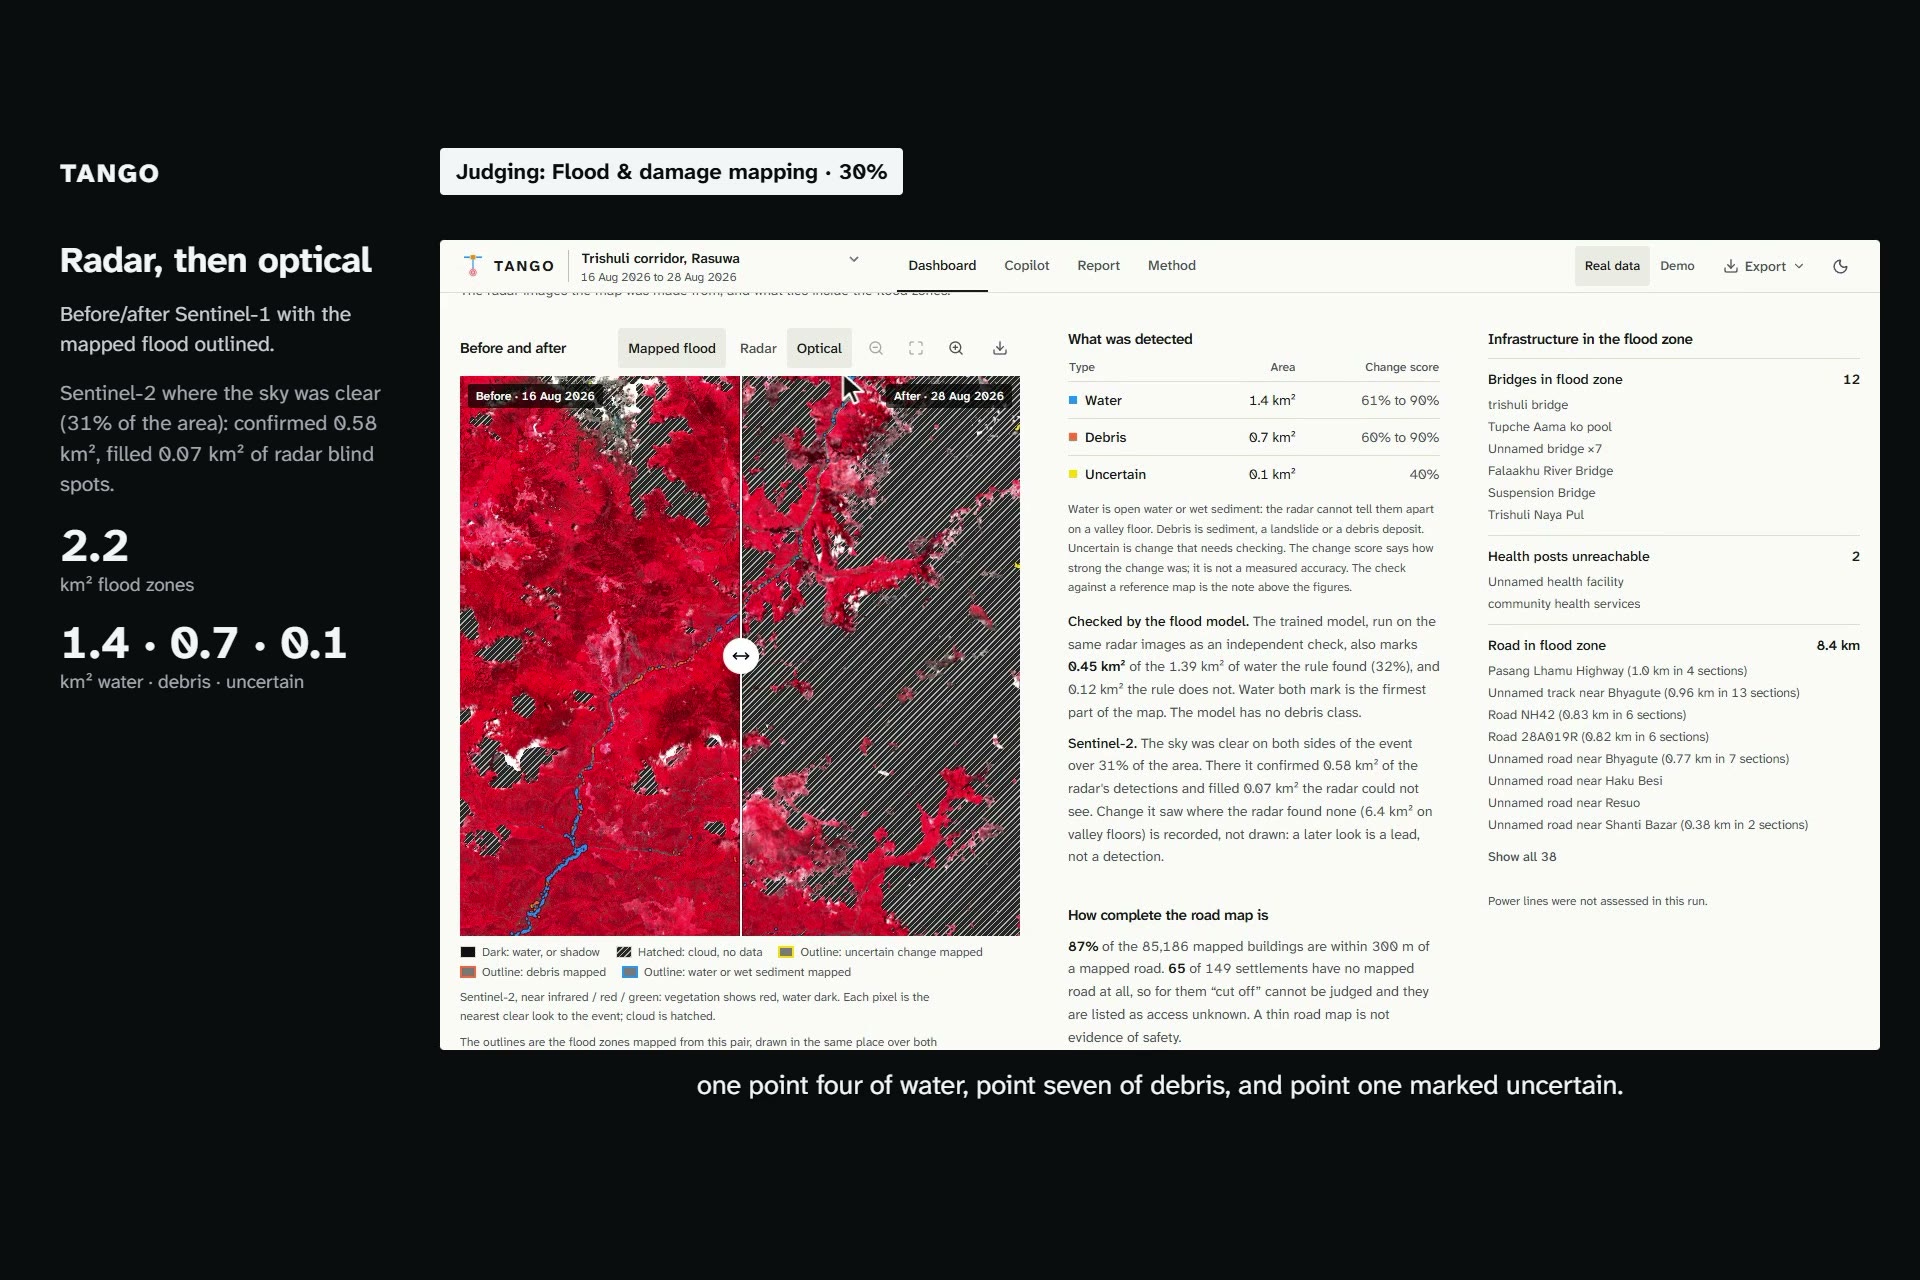
- Where did the flood hit? It finds two Sentinel-1 scenes on the same orbit track, twelve days apart, with the event between them, and compares them (against the median of three earlier scenes) on valley floors found from the Copernicus DEM and mapped rivers. It maps flood water and debris, and marks strong change elsewhere as "uncertain". Where the sky was clear, Sentinel-2 confirms the radar and fills its blind spots.
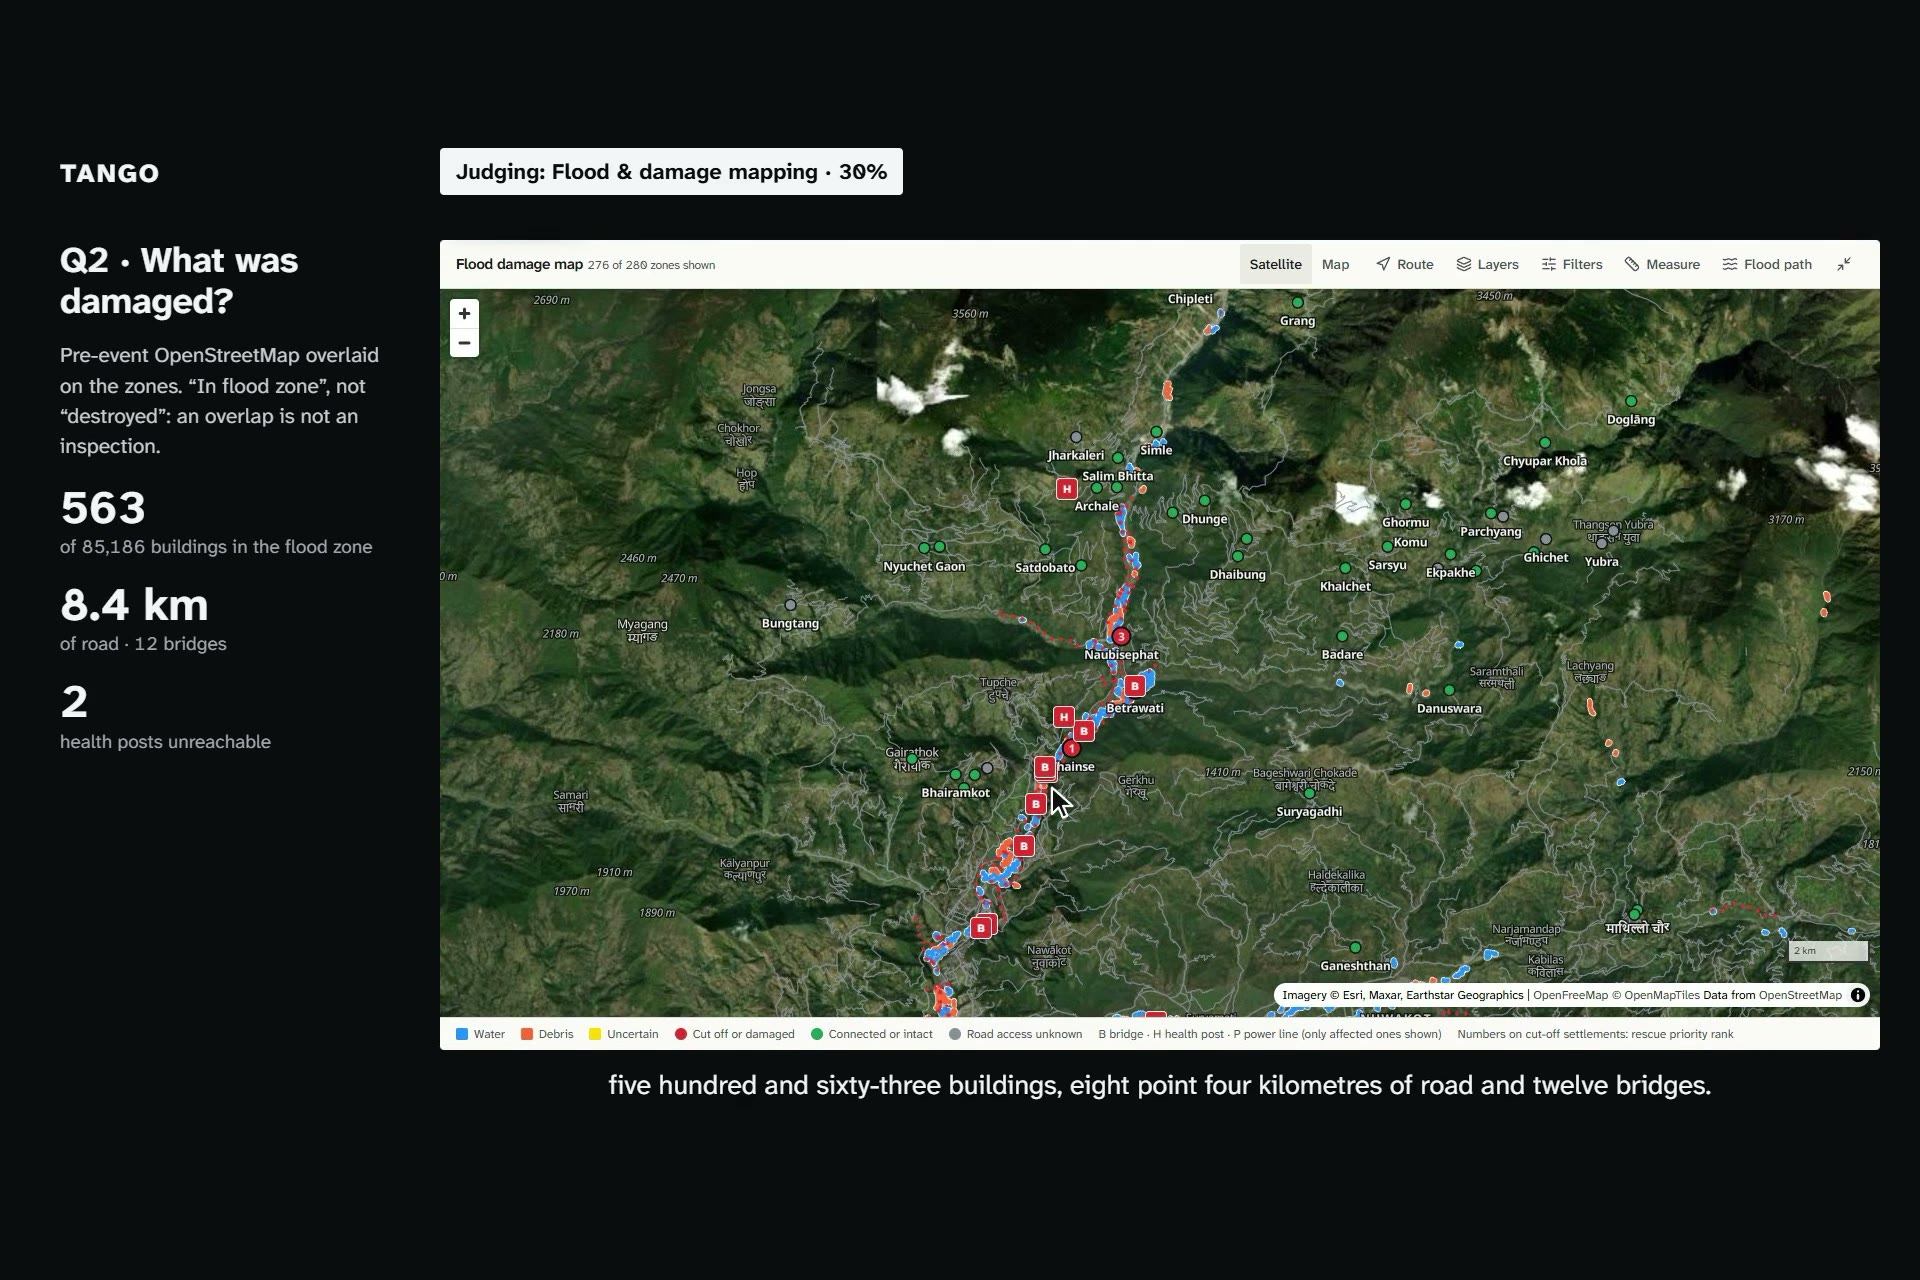
- What was damaged? It overlays pre-event OpenStreetMap buildings, roads and bridges. A road or bridge inside a flood zone is "in flood zone", not "destroyed": an overlap is not an inspection.
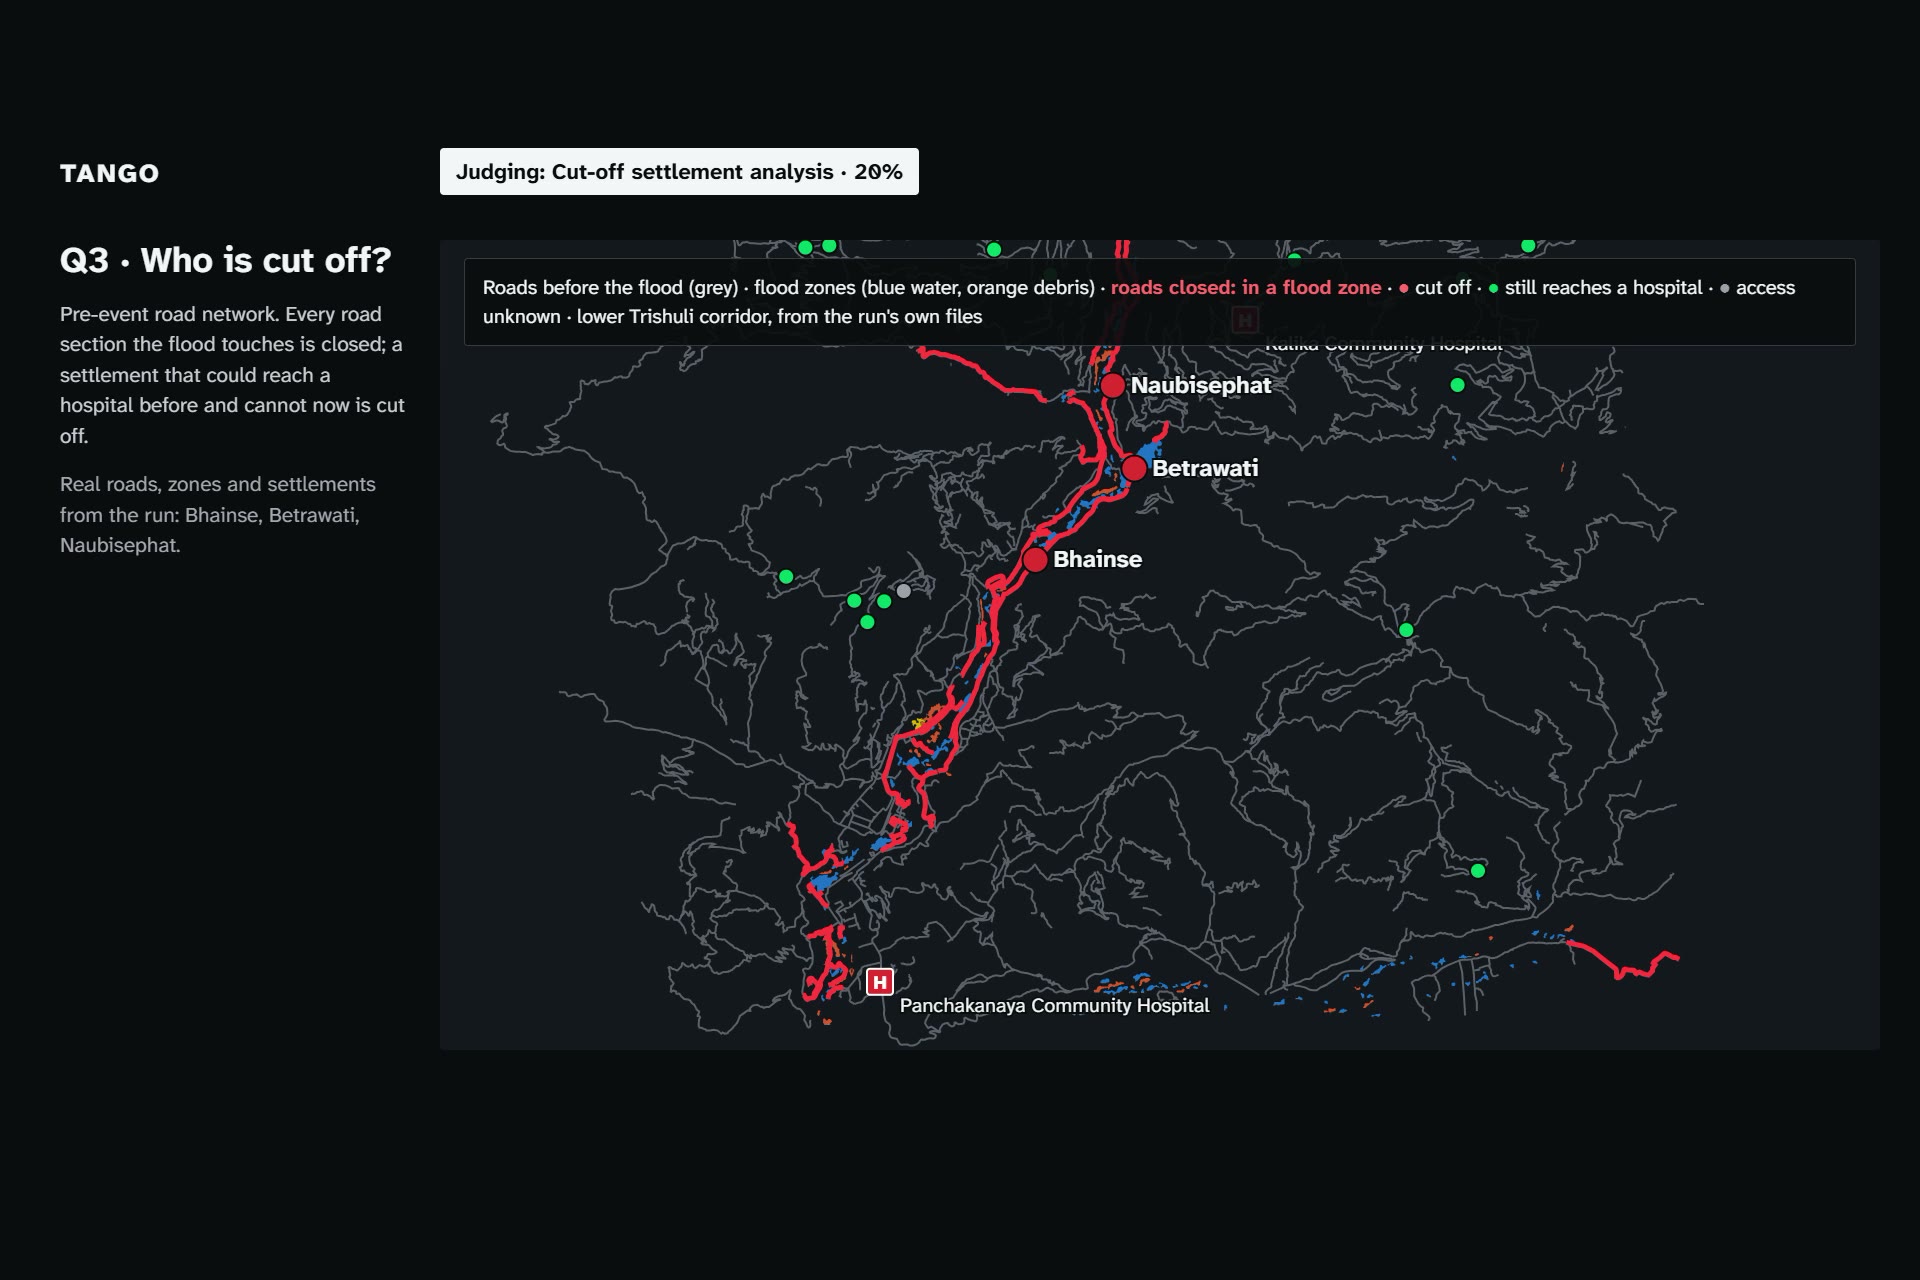
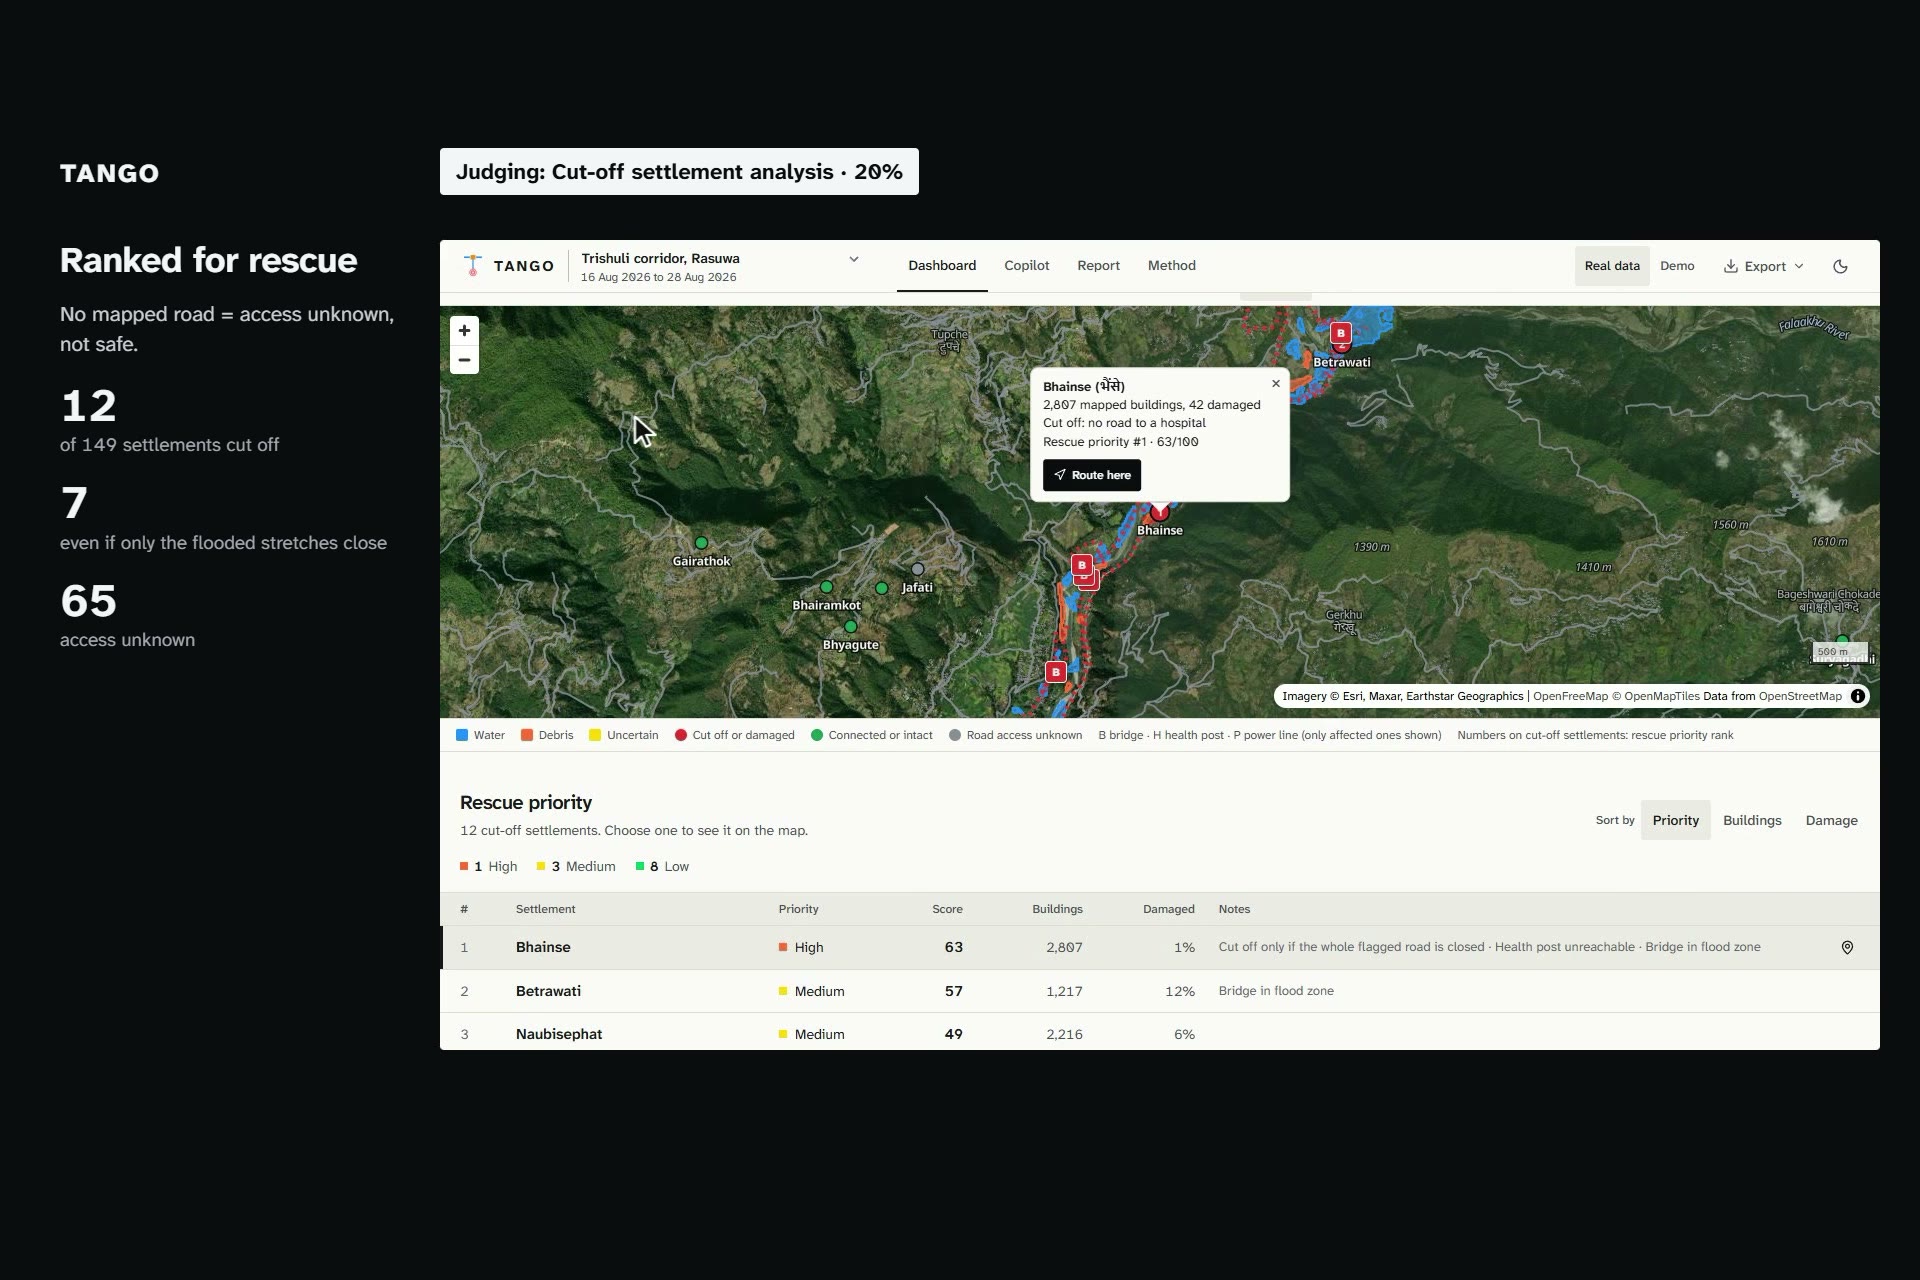
- Who is cut off? It finds the settlements that could reach a hospital by road before the event and cannot now. A settlement with no mapped road is "access unknown", never counted as safe or as cut off.
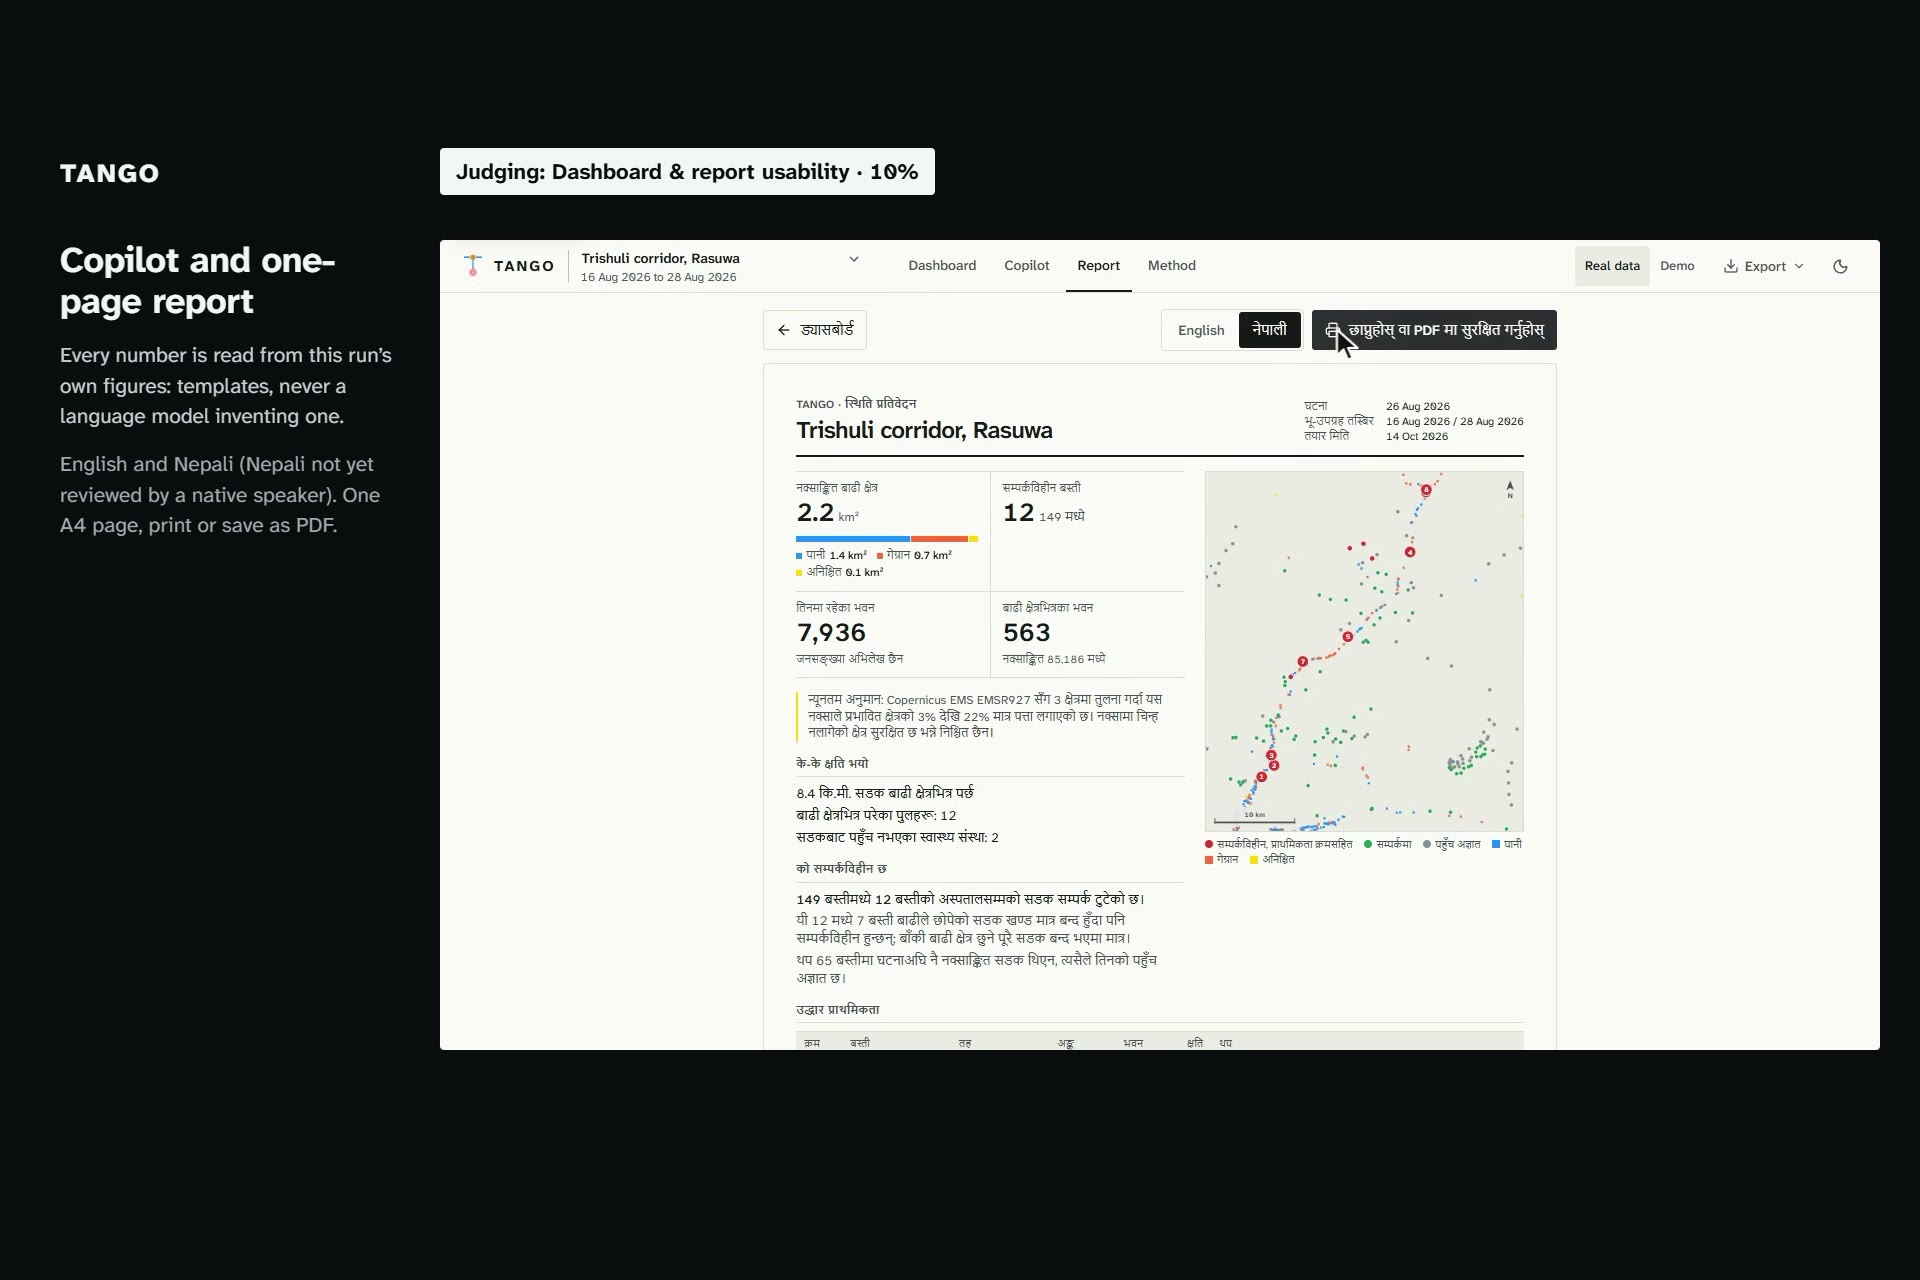
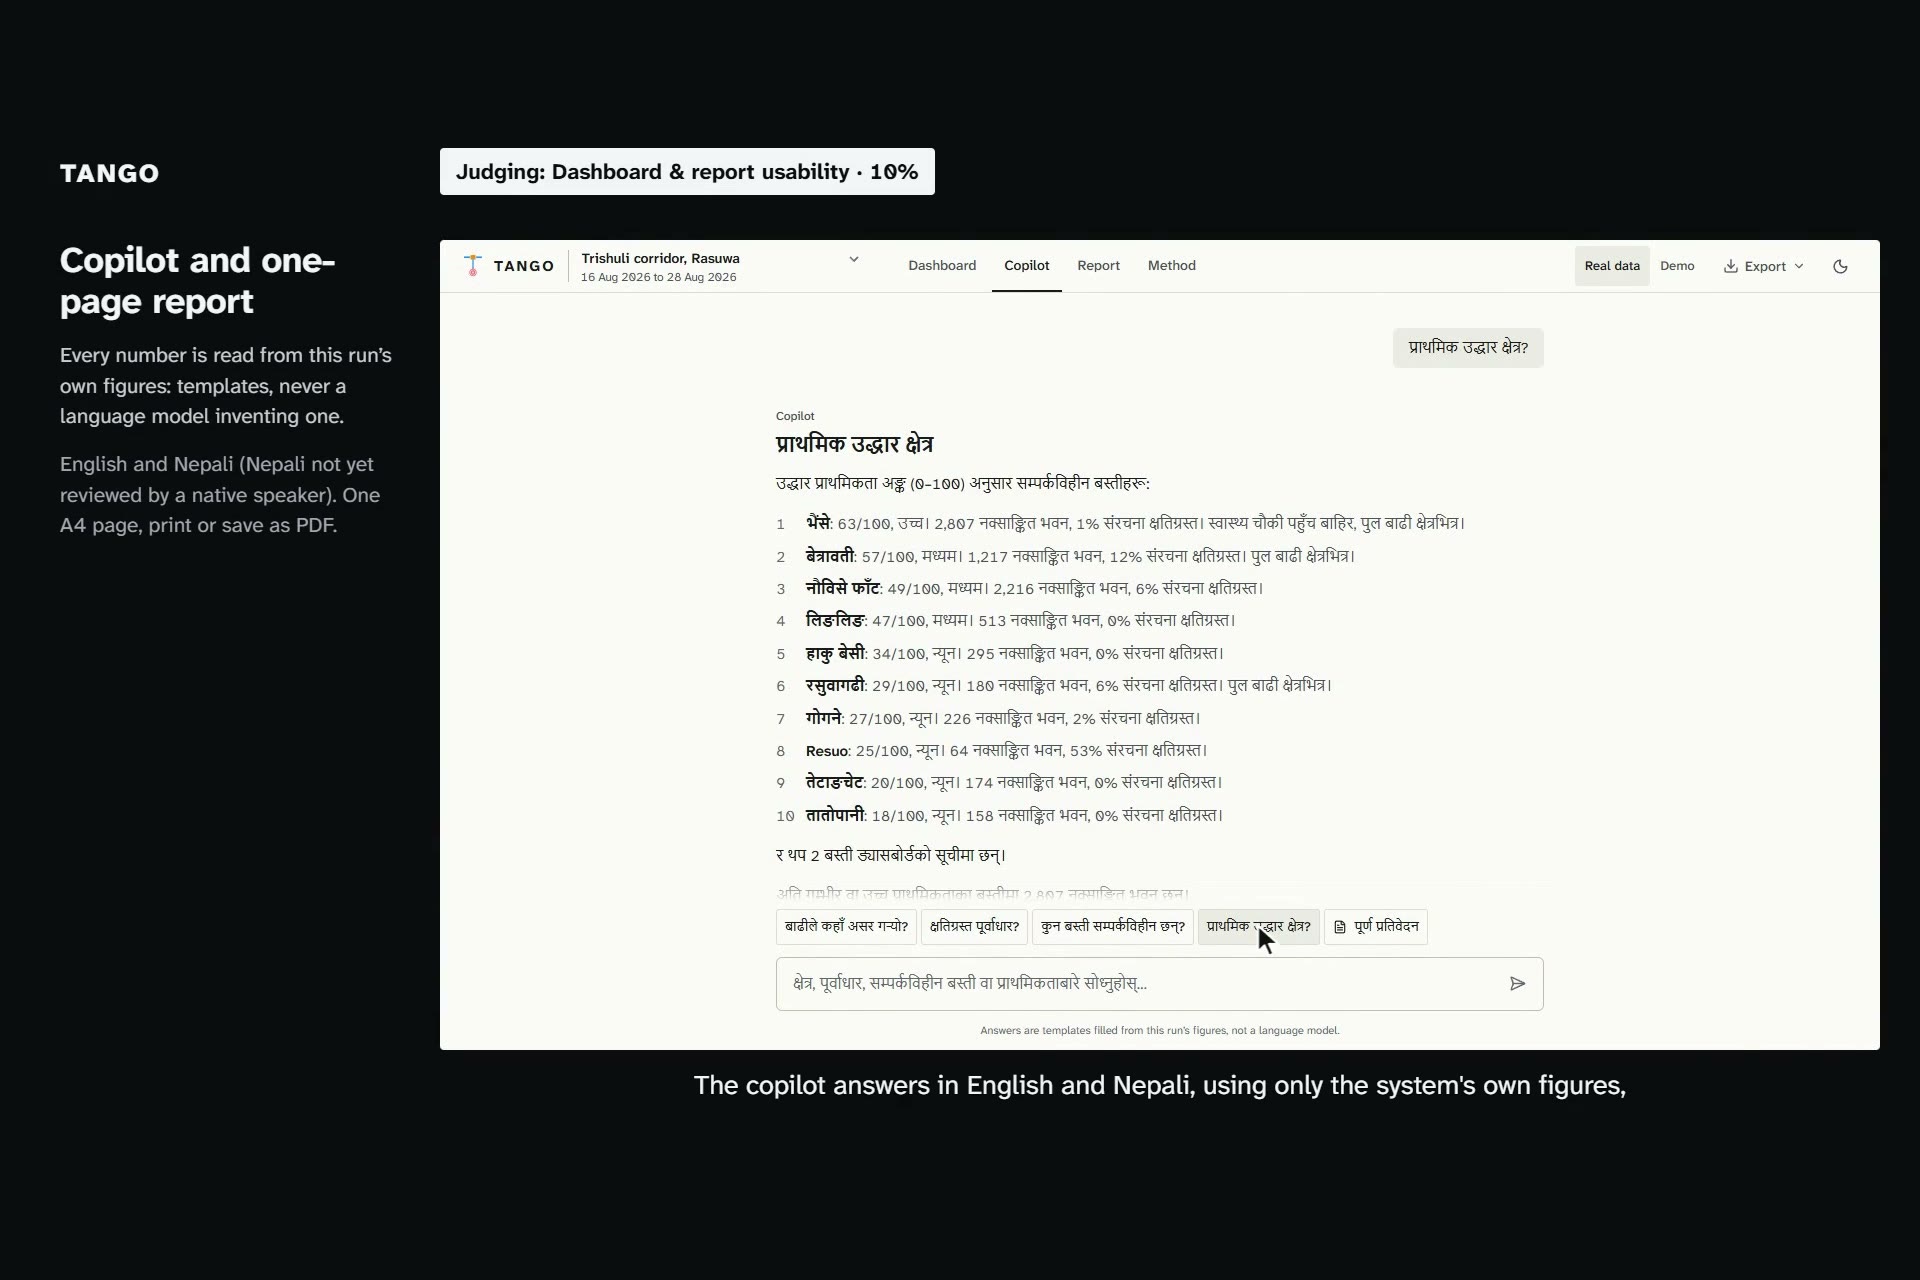
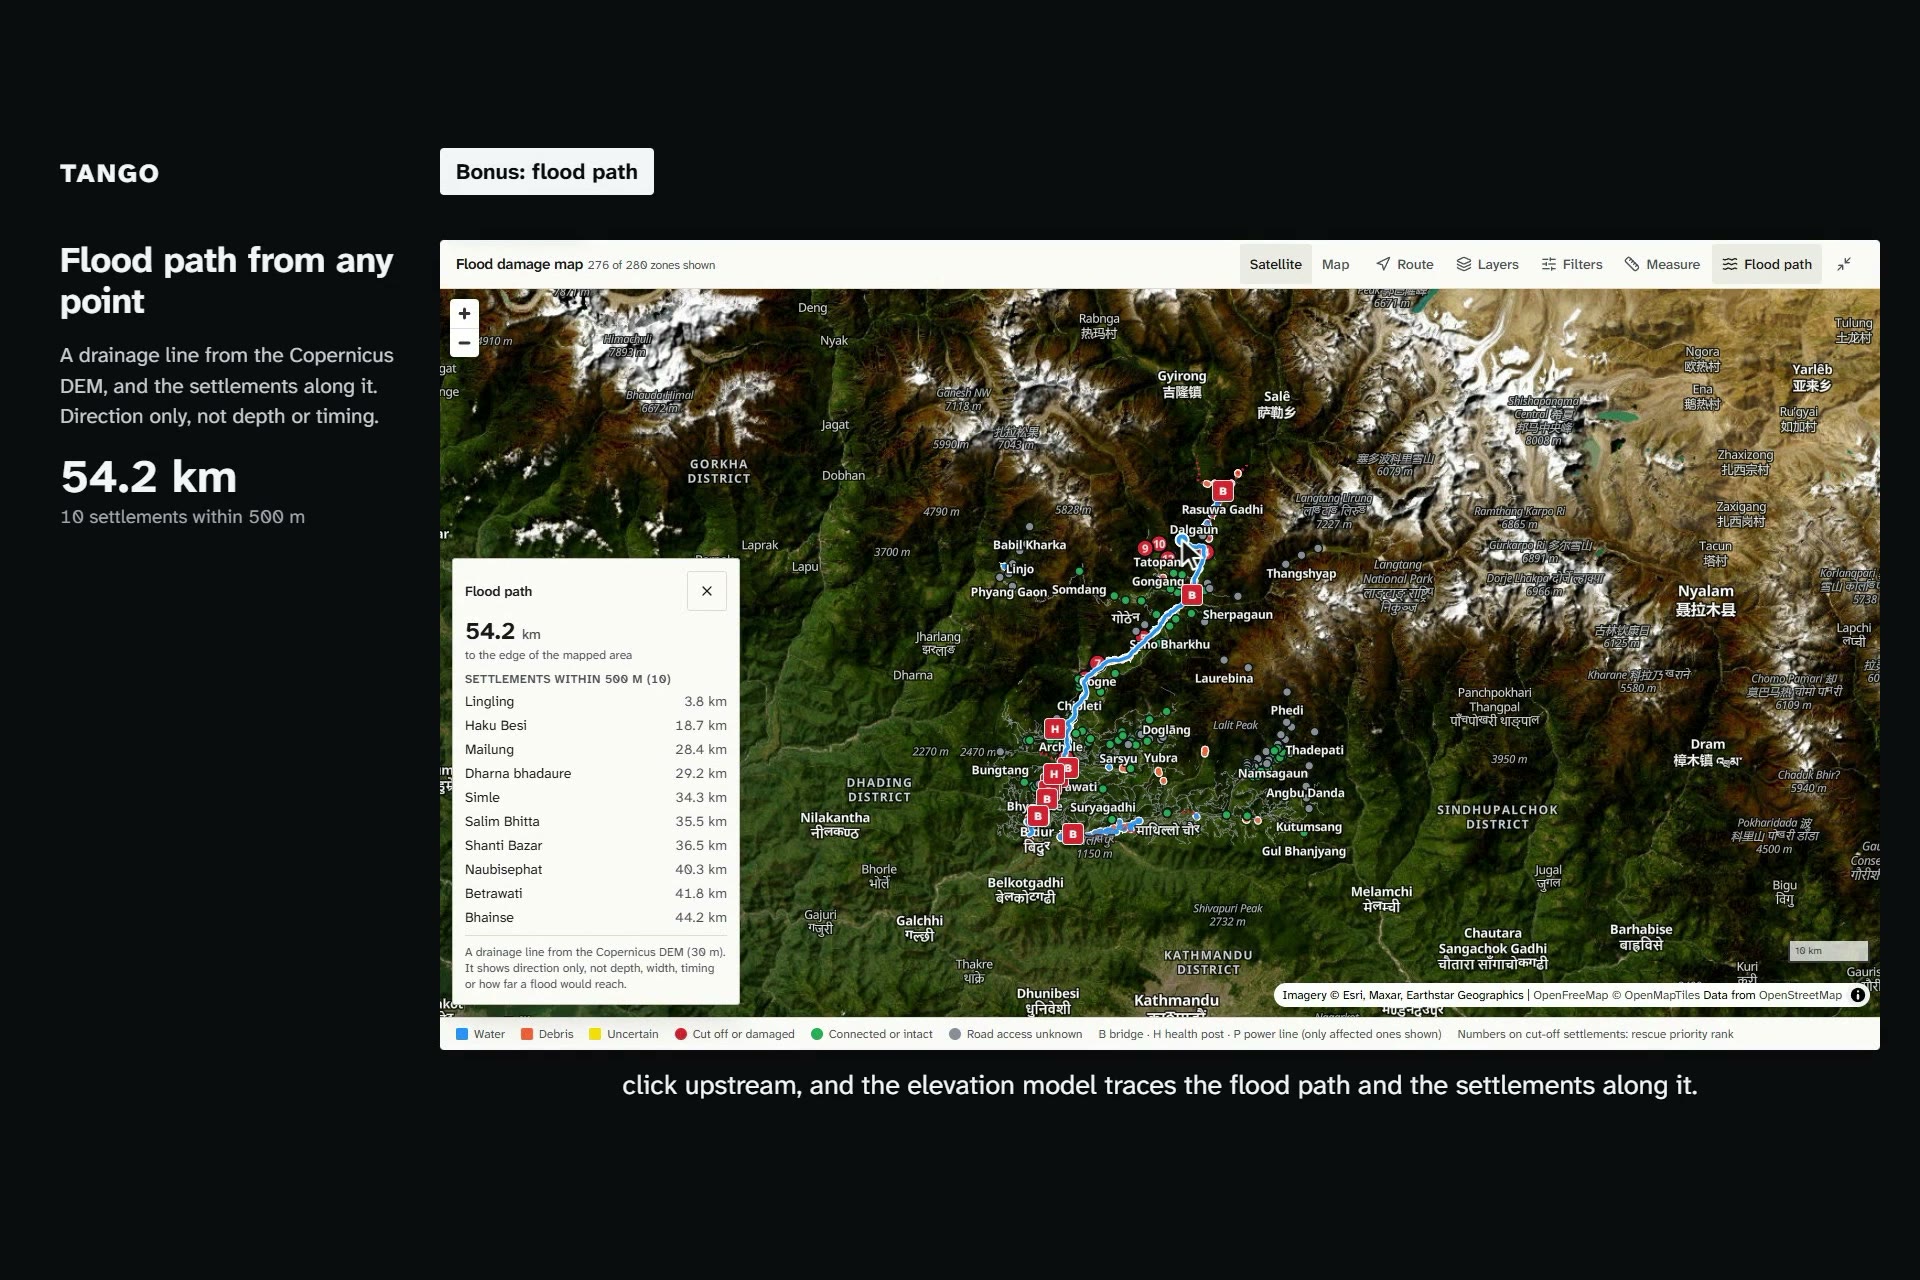
The dashboard shows the result on a map, with a rescue priority table, a before/after viewer (radar and optical) with the mapped flood outlined, a route planner that avoids flooded road sections (with live GPS navigation), and the bonus flood-path trace from any point upstream. A copilot answers rescuers' questions and writes the situation report in English and Nepali; every number comes from the run's own figures, and the one-page report prints to A4.
On the Trishuli corridor (16 and 28 August 2026): 2.2 km² of flood zones (1.4 water, 0.7 debris, 0.1 uncertain), 563 of 85,186 mapped buildings in a flood zone, 8.4 km of road and 12 bridges, and 12 of 149 settlements cut off from a hospital (7 even if only the flooded stretches of road are closed), with 65 more whose access is unknown.
How we built it
A Python pipeline reads only the needed window of each Sentinel-1 scene from the Copernicus Data Space, calibrates it, removes noise and speckle, and terrain-corrects it with the Copernicus DEM. It classifies change on valley floors, overlays OpenStreetMap as it was before the event, builds the road graph and finds the cut-off settlements. It writes static files that a React dashboard reads; there is no server.
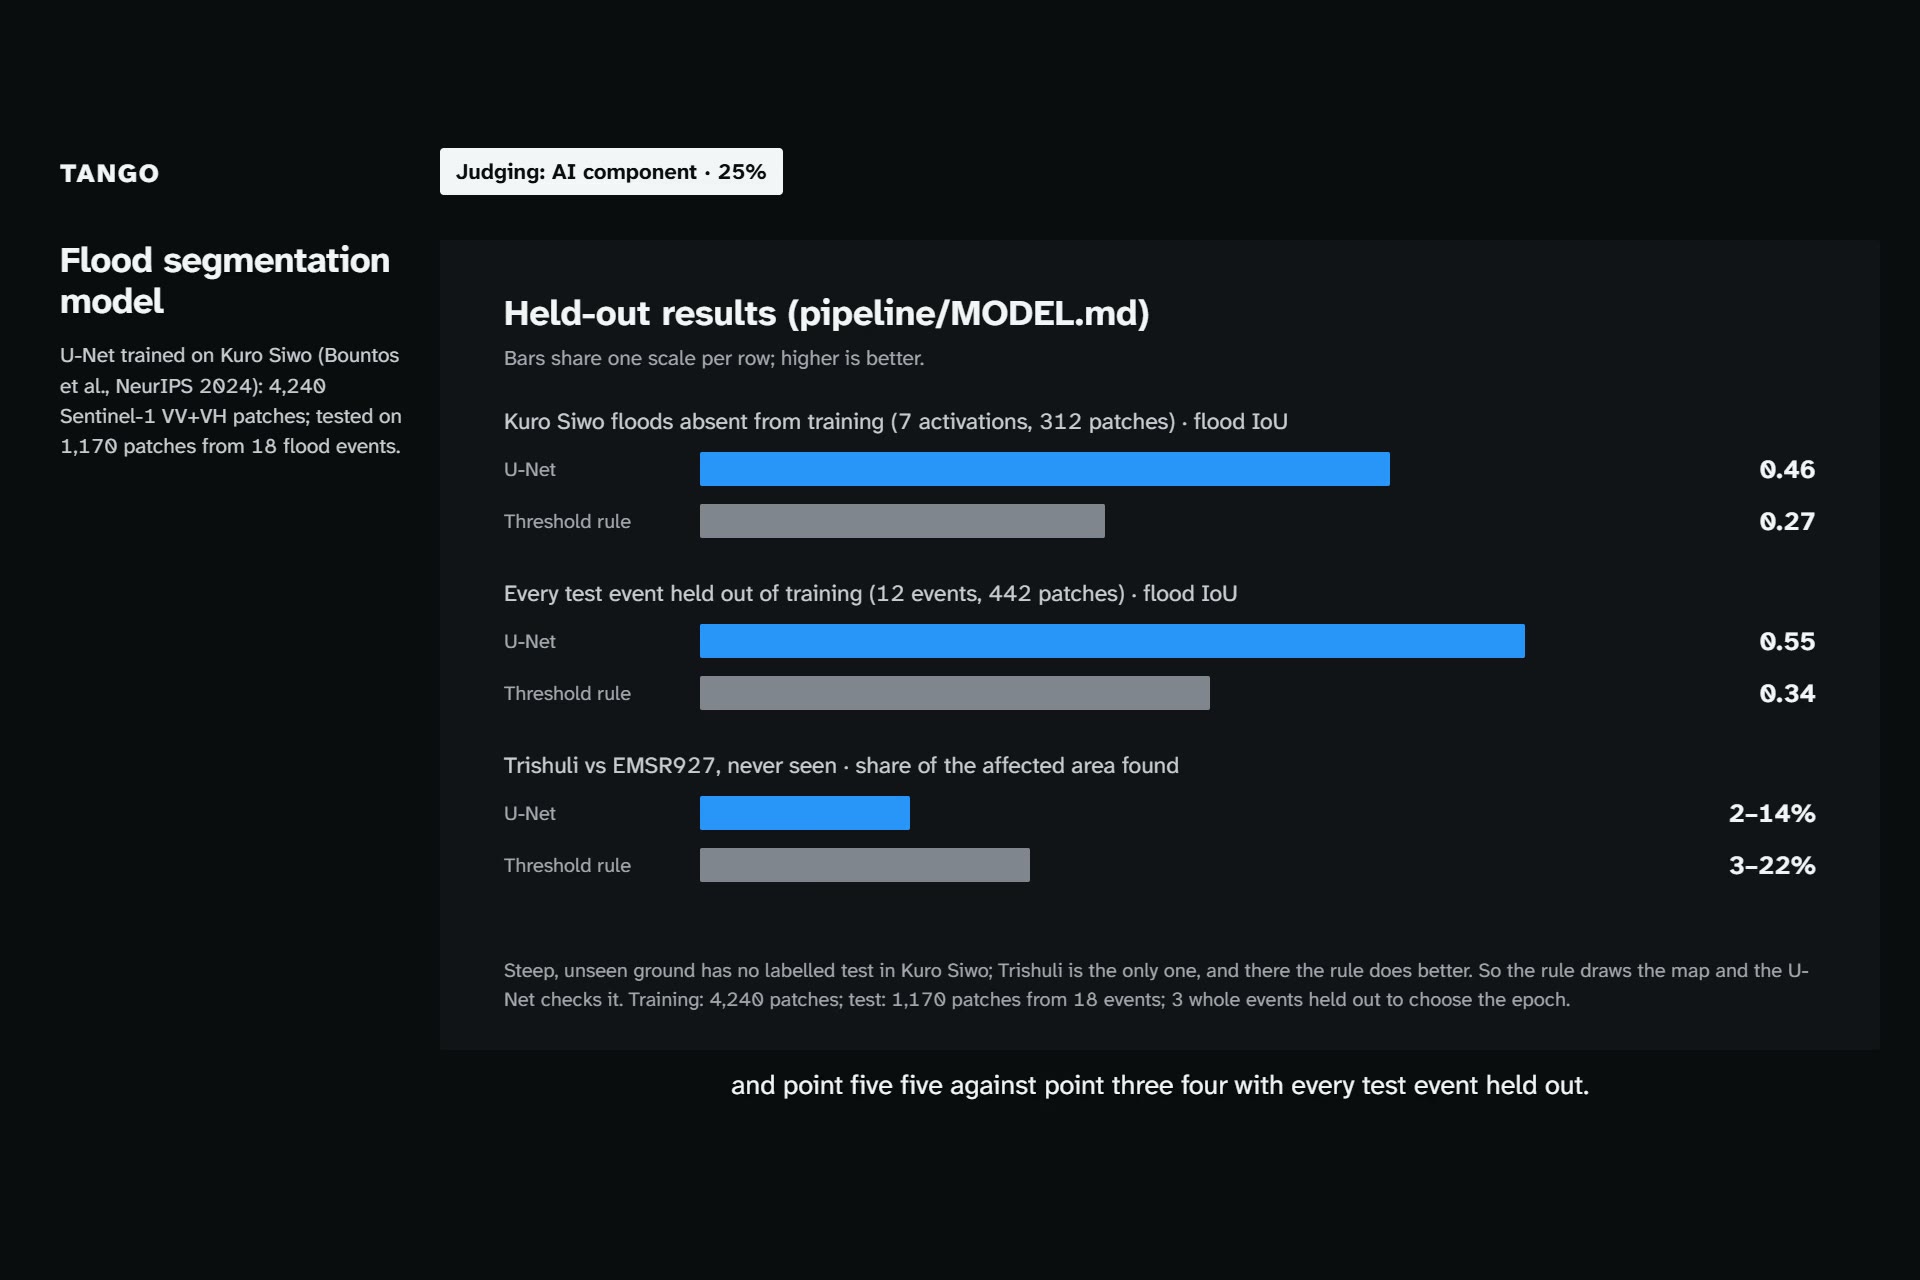
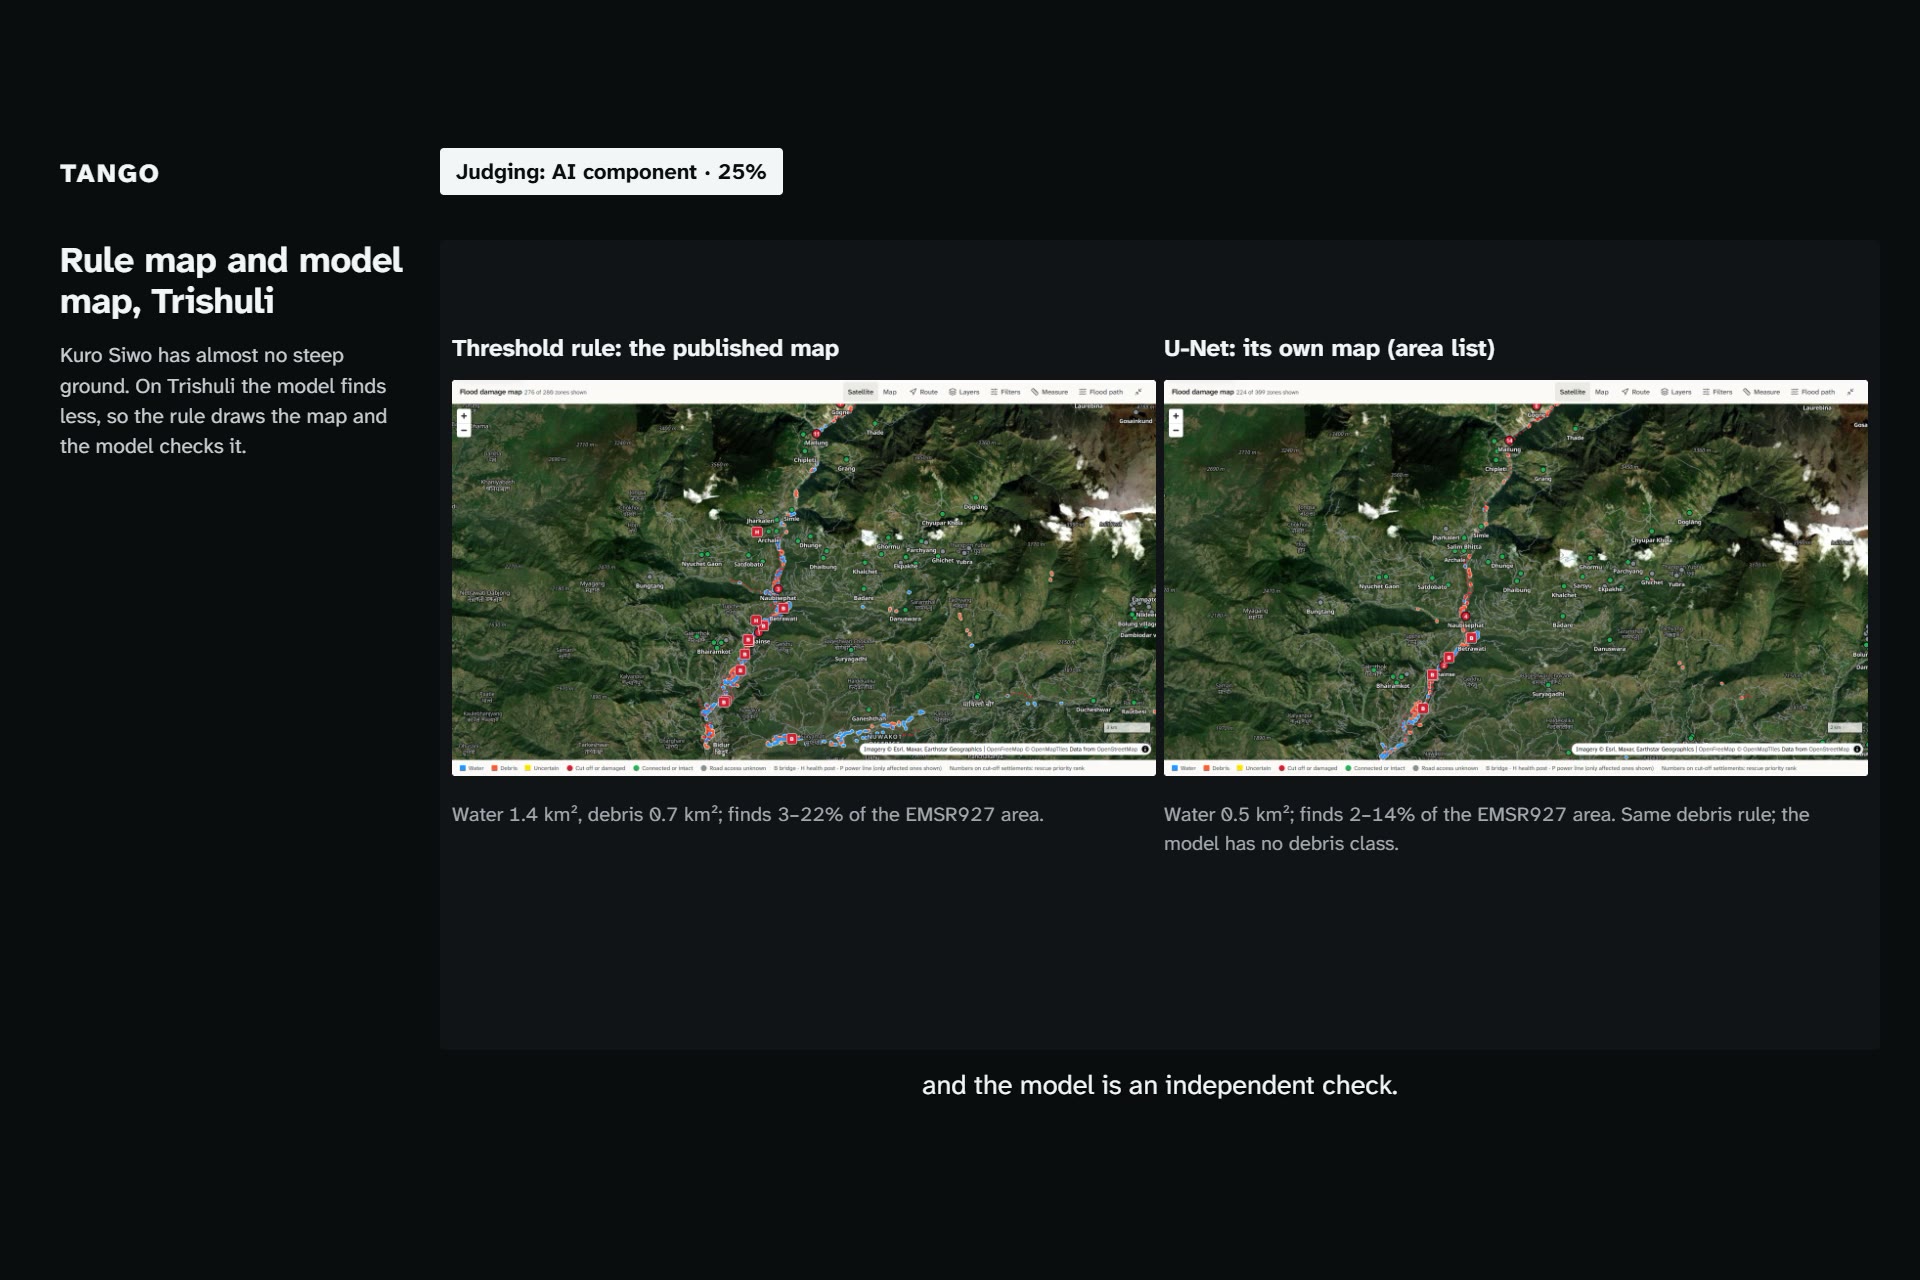
The AI component is a U-Net flood segmentation model trained on a sample of Kuro Siwo (4,240 Sentinel-1 VV+VH patches; tested on 1,170 patches from 18 flood events). On floods absent from training it beats the threshold rule (flood IoU 0.46 against 0.27; 0.55 against 0.34 for a model trained with every test event held out). On the steep Himalayan scenes it finds less than the rule, so the rule draws the map and the model checks it: run on the same images, it also marks 0.45 of the rule's 1.39 km² of water (32%), the firmest part of the map.
Challenges we ran into
- Slant-to-ground records are not exact at their stated times. Blending them as stamped was off by up to 5.7 pixels; we fit the time offset that reproduces the product's own geolocation grid (0.03 px afterwards).
- A fixed water threshold never fires in a gorge. Along the Trishuli the darkened pixels have a median of -10.8 dB, not -18. We constrained classification to ground near a mapped river.
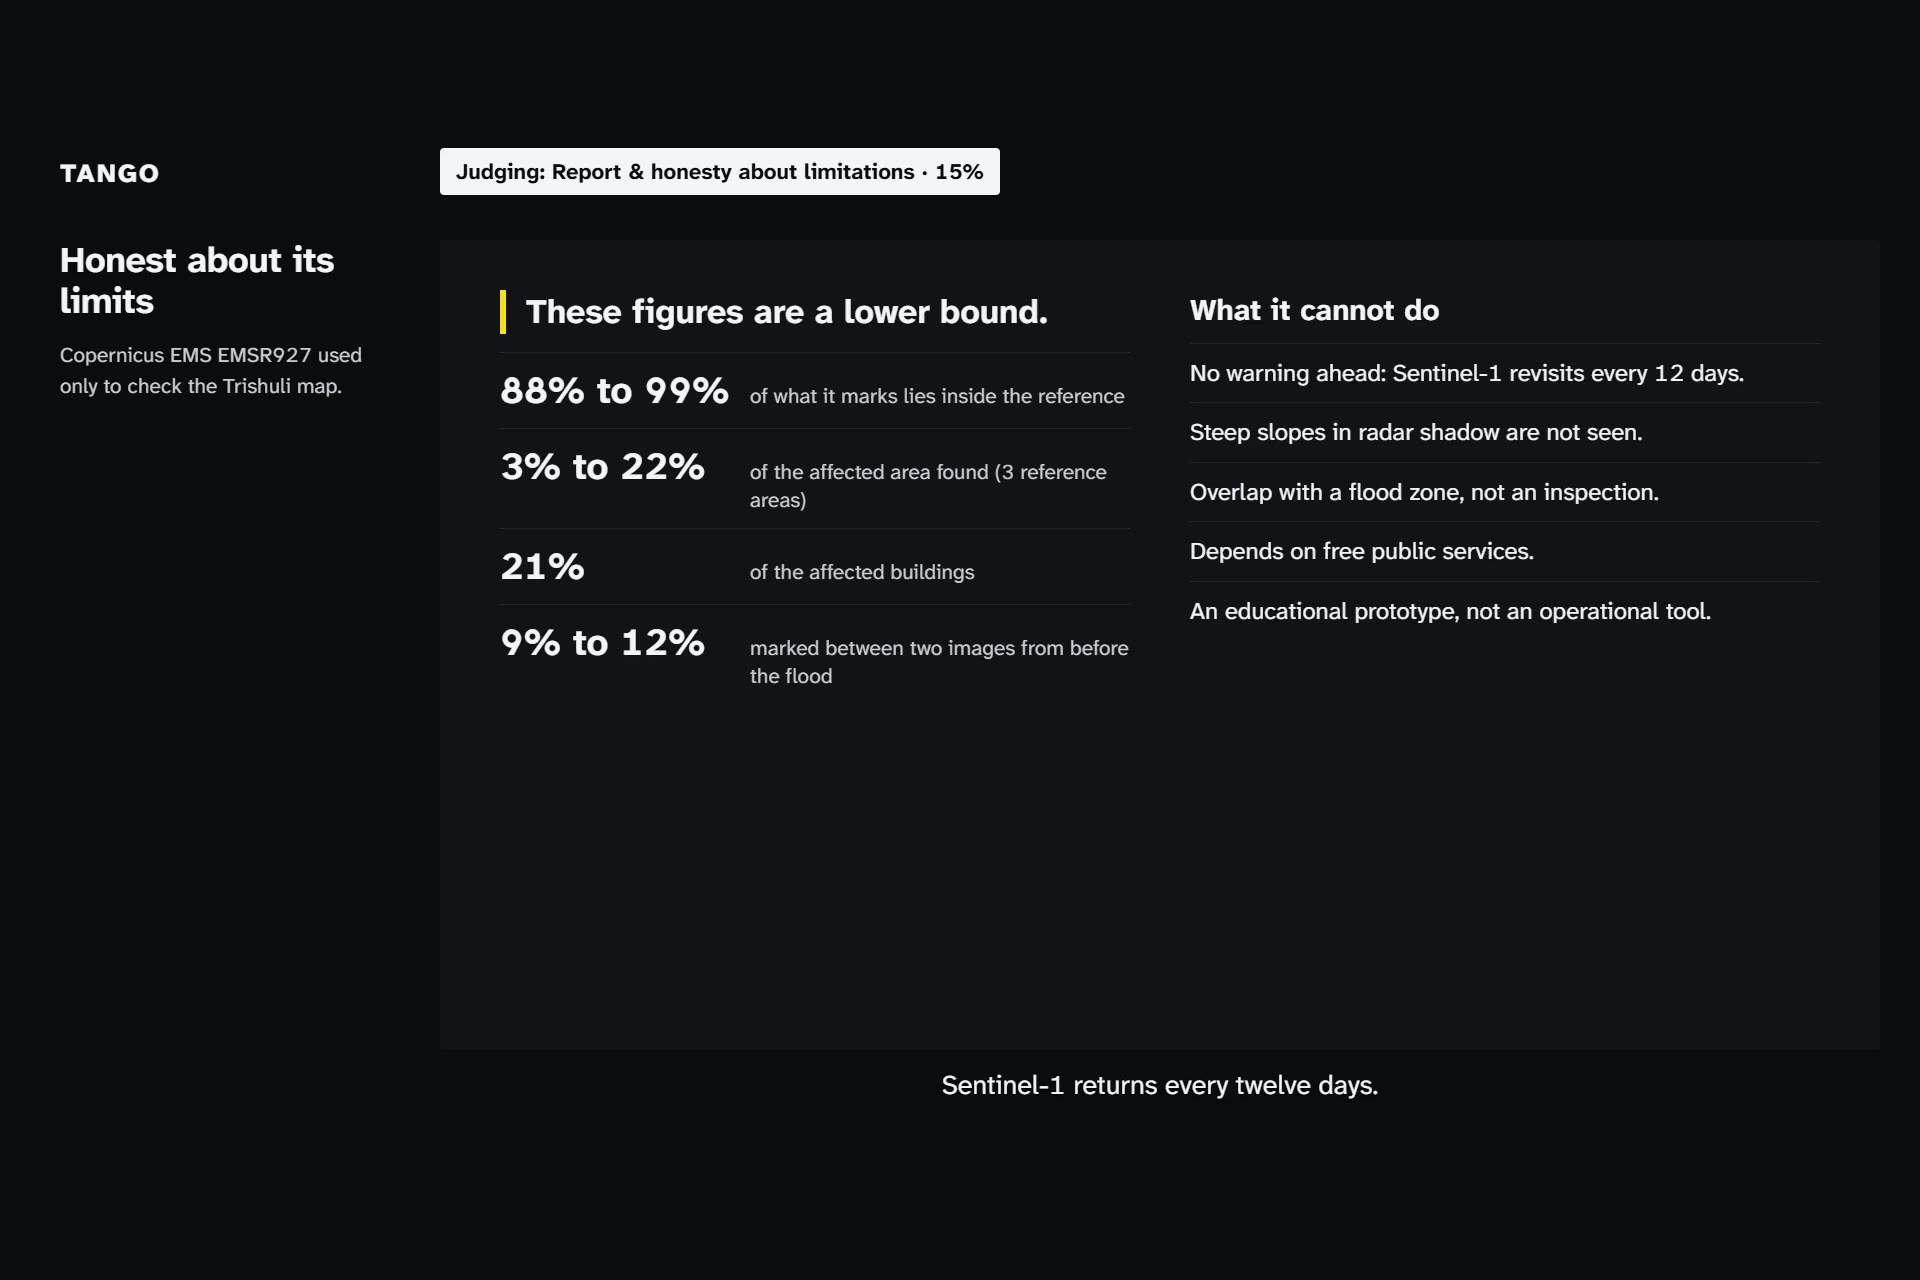
- A rule that cannot tell flood from ordinary change. On two scenes both from before the event, the first rule marked 24% to 127% of its own area. A three-image baseline brought that to 9% to 12%, and the dashboard reports it.
- An area can straddle two image frames. A rehearsal on the 2021 Chamoli flood read one frame (84% coverage); the pipeline now joins the frames of a pass.
- Data rules. Copernicus EMS, UNOSAT and post-event OpenStreetMap may only check results. Tests fail if the run path reaches the validation code or names a published damage map.
Accomplishments that we're proud of
- It runs end to end on real scenes for areas it had never seen: the Trishuli corridor, a second reach, the Bhote Koshi valley, the 2021 Chamoli glacier flood and the 2023 Teesta flood in Sikkim.
- It is checked against Copernicus EMS EMSR927 and says what the check shows: where it marks flood it is usually right (88% to 99%), but it finds only 3% to 22% of the reference area, so every figure is a lower bound.
- The dashboard states its own limits ("access unknown", "population not recorded", the lower-bound note) instead of filling gaps.
- 320 frontend tests, 202 pipeline tests, lint, accessibility checks and a build run in CI on every push.
What we learned
Most of a debris corridor changes by less than 3 dB in a radar pair, so a radar-only map finds a fraction of it however the thresholds are set; the honest output is a lower bound with its false-alarm floor beside it. A model that wins on a public dataset can still lose on steep ground the dataset barely covers.
What's next
Raising recall with evidence the rules allow (radar coherence, a second viewing track for slopes in shadow), more events and valleys, a native speaker's review of the Nepali text, and offline use for field teams.
Data and attribution
Inputs: Sentinel-1, Sentinel-2, Copernicus DEM, OpenStreetMap as it was before the event (the ohsome API answered HTTP 403, so the same snapshot date comes from Overpass), and Kuro Siwo for training. Copernicus EMS EMSR927 was used only to check results.
Contains modified Copernicus Sentinel data 2026. Produced using Copernicus WorldDEM-30 © DLR e.V. 2010–2014 and © Airbus Defence and Space GmbH 2014–2018 provided under COPERNICUS by the European Union and ESA; all rights reserved. © OpenStreetMap contributors. Kuro Siwo: Bountos et al., 2024. European Union, Copernicus Emergency Management Service data (EMSR927).
An educational prototype, not an operational tool. No images of people affected by the disaster are used.

Log in or sign up for Devpost to join the conversation.