-
-
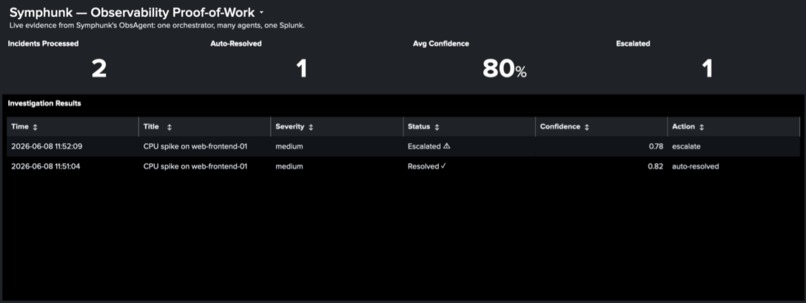
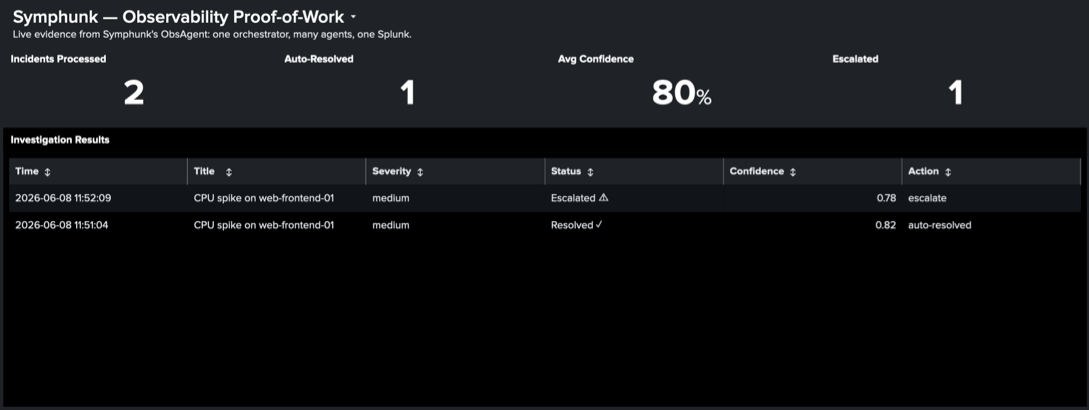
Observability Proof of Work
-
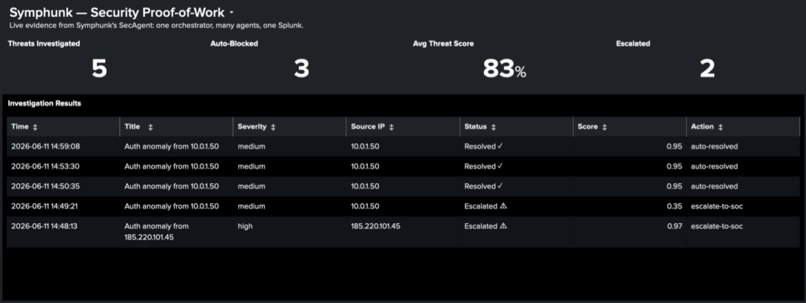
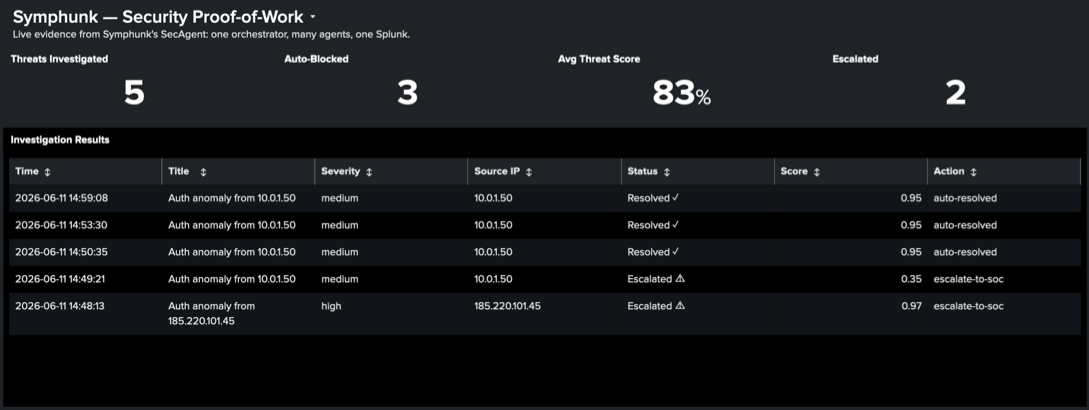
Security Proof of Work
-
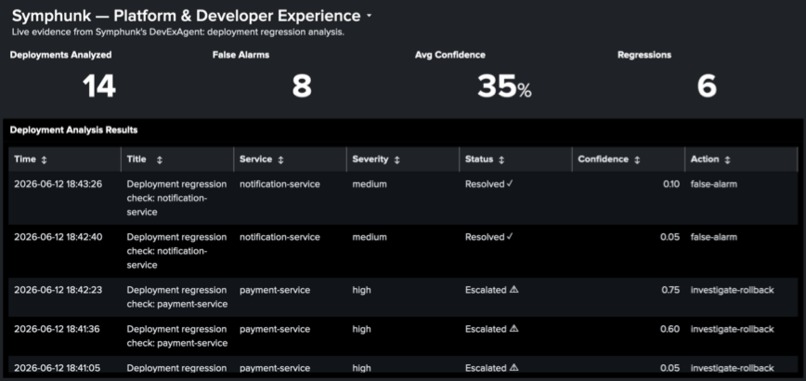
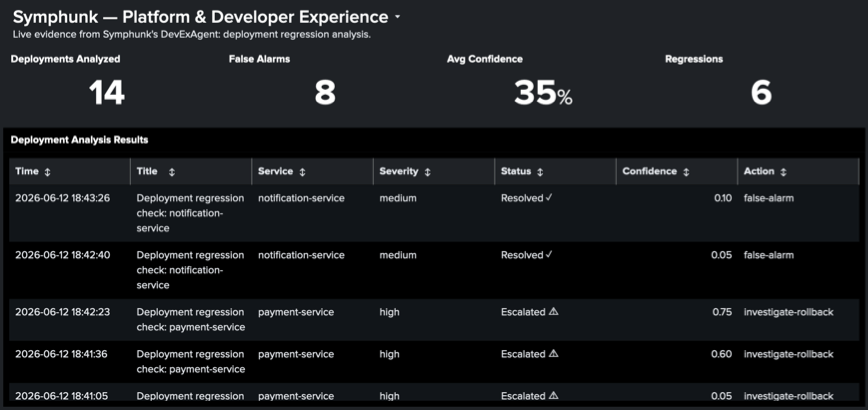
Platform Developer Experience
-

Symphunk.agents.obs_agent ObsAgent
-

Symphunk.agents.sec_agent SecAgent
-

Symphunk.agents.dev_ex_agent DevExAgent
-

Your credit balance is too low to access the Anthropic API




Inspiration
The pitch for agentic ops sounds obvious: let AI handle the alert triage. But most implementations I looked at made the problem worse before making it better — a new agent framework here, a new tool layer there, a new dashboard for the agent's own health, another Slack bot to notify you when the agent notified you. The cure was becoming its own sprawl.
The insight that became Symphunk was simpler: Splunk is already the operations backbone. Make the agent a first-class citizen of it, not a tenant above it. Splunk alerts become the work queue. Splunk KV Store becomes the state store. Splunk dashboards become the proof-of-work layer. The agent lives in its own external tier — exactly where Splunk's validated architecture says external clients belong — and writes everything it knows back into the system operators already trust.
One conductor, many agents, one Splunk.
What it does
Symphunk turns Splunk alerts into fully investigated, evidence-backed incidents — autonomously, without a human opening a search window. It runs three specialized agents across three domains from a single orchestrator.
Observability track (ObsAgent): When a saved search detects a metric anomaly (CPU spike across web-frontend hosts), it fires a custom alert action that writes a structured incident to the Splunk KV Store. The orchestrator marks it Investigating and dispatches ObsAgent, which runs a three-step investigation:
- Per-host summary — aggregate CPU, memory, error counts, and request rate across all affected hosts to establish scope.
- Z-score anomaly timeline — confirm the spike is statistically real, not noise, and identify when it started.
- Cascade correlation — trace secondary impact to downstream services (e.g., an API gateway showing elevated latency because the frontend is saturated).
The agent concludes with an explicit confidence score. Confidence ≥ 0.80 and severity not critical → auto-resolve. Otherwise escalate. The evidence chain and confidence score land in a Dashboard Studio proof-of-work dashboard.
Security track (SecAgent): When a security saved search detects an authentication anomaly, the same alert action writes an incident with agent_type=sec. The orchestrator routes it to SecAgent, which runs a parallel three-step investigation:
- Auth anomaly summary — count failures and successes per source IP; identify breach signals (successes after many failures).
- Source IP enrichment — classify the IP: Tor exit node (185.220.0.0/16), known VPN range, or internal scanner; assign risk level.
- Lateral movement check — scan for SMB connections (port 445) from the compromised host to internal targets post-breach.
SecAgent concludes with a threat score. A severity=high incident (confirmed breach from Tor exit node) always escalates — the severity gate is non-negotiable. A severity=medium incident (internal scanner, no breach, threat score ≥ 0.75) auto-resolves. Both outcomes land in a separate security proof-of-work dashboard.
Platform & Developer Experience track (DevExAgent): When a deployment regression saved search detects an error rate spike correlated with a recent deploy, the same alert action writes an incident with agent_type=devex. The orchestrator routes it to DevExAgent, which runs a three-step investigation:
- Deployment timeline — confirm when the deploy occurred relative to the error rate change.
- Before/after error rate — compare error rate immediately before and after the deploy to measure the delta.
- Blast radius — check for secondary impact across dependent services.
DevExAgent concludes with a confidence score. Confidence ≥ 0.70 or severity=high → escalate for rollback review. Confidence < 0.70 → auto-resolve as a false alarm. The evidence chain lands in a separate Platform & Developer Experience proof-of-work dashboard.
All three agents share one orchestrator, one MCP tool layer, one search budget, and one governance model. The entire loop — alert fires to investigation complete — takes under two minutes per incident.
How we built it
Symphunk is a five-layer stack, each layer composable with the others.
The harness sits at the center: a Claude tool-use loop (using the anthropic SDK with prompt caching for long SPL skill context) wired to the Splunk MCP Server via streamable HTTP. Every tool the agent can call is a real MCP tool — splunk_run_query, splunk_get_metadata, splunk_get_index_info, and the four SAIA tools (saia_generate_spl, saia_explain_spl, saia_optimize_spl, saia_ask_splunk_question). The agent never hand-writes SPL for novel queries — it asks SAIA to generate it, then runs it through the MCP Server.
The search budget is a first-class constraint, not an afterthought. Every SPL query consumes a CPU core on the search tier; a naive agent that fires ten concurrent searches starves the platform. SearchBudget caps searches per run (10 total, 5/min for expensive queries), prefers tstats and accelerated data models, bounds time windows to recent data — and when the budget runs out, it returns a directive error message that tells Claude to conclude with current evidence rather than retry.
The alert pipeline uses a custom Splunk app (symphunk_alert_action). When a saved search fires, the symphunk_ingest script reads the Splunk session key from the alert payload — no hard-coded credentials — and writes a structured incident to the symphunk_incidents KV collection using batch_save, the only reliable upsert primitive in Splunk KV Store.
The orchestrator is an asyncio polling loop: find incidents with status=New, gate on concurrency limits, dispatch one ObsAgent task per incident, then transition state through New → Investigating → Resolved/Escalated — all written back to KV.
The proof-of-work dashboards are two Dashboard Studio definitions — one per agent domain. ObsAgent emits telemetry to index=summary source="symphunk:evidence"; SecAgent to source="symphunk:sec_evidence". Both use the same pixel-layout pattern (four KPI tiles + results table) and the same HEC emit path — the second dashboard cost no architectural work to add.
The agent routing lives entirely in the orchestrator's make_agent() factory. The alert action forwards agent_type and src_ip from the SPL result fields (fetching all result rows via the Splunk REST jobs API — the binary .srs.zst results_file is not readable as plain text). One field in KV selects the agent; the harness, budget, and hooks are unchanged for all three.
Challenges we ran into
The KV Store upsert trap. POST /collection/ in Splunk KV Store returns 404 on new records — it does not upsert, despite what some documentation implies. The fix was switching to batch_save everywhere.
Accomplishments that we're proud of
A complete agentic pipeline on real Splunk infrastructure. Every component is live and wired together: a real Splunk alert action writes to a real KV Store collection; a real orchestrator polls it; a real agent calls 14 live MCP tools and uses SAIA for SPL generation; real evidence lands in a real Dashboard Studio dashboard.
The search budget actually works. Getting Claude to respect a search budget — to conclude with the evidence it has rather than keep searching — required more than a cap counter. The budget returns directive error messages that explicitly tell Claude what to do next. Watching the agent correctly summarize its findings and close the investigation when the budget fires was a genuine milestone.
SAIA in the investigation loop. Using saia_generate_spl mid-investigation — feeding the agent's current findings back into SAIA to generate a cascade correlation query it couldn't have anticipated — demonstrates the hybrid SPL strategy working as designed. The agent uses curated skill templates for repeatable hot-path queries and SAIA for the novel ones. Both in the same run.
Auto-resolve with a real confidence gate. Confidence 0.82, severity medium, auto-resolved — not because we hardcoded the answer, but because the agent built an evidence package and scored it. The threshold and the severity gate are the only policy the human sets. Everything else is the agent's reasoning. Live dashboard state: Observability — 2 incidents processed, 1 auto-resolved, 80% avg confidence, 1 escalated. Security — 5 threats investigated, 3 auto-blocked, 83% avg threat score, 2 escalated. Platform & Developer Experience — 14 deployments analyzed, 8 false alarms auto-resolved, 35% avg confidence, 6 regressions escalated.
Anti-sprawl architecture that survives a third agent — live. The design decision that one orchestrator, one harness, and one governance model should serve all agents isn't just a thesis — it's demonstrably true in the code. SecAgent and DevExAgent each share the same harness, budget enforcement, hook lifecycle, and KV state machine as ObsAgent. Each addition was one new skill set, one new agent class, one new detection saved search, and two lines in make_agent() to route by agent_type. No new orchestrator, no new tool layer, no new governance model.
What we learned
MCP is the right abstraction for agent-Splunk integration. The MCP Server surfaces 14 tools with clean schemas — the agent discovers them at runtime, the harness builds the tool registry dynamically, and there's no coupling between agent logic and Splunk API details. When Splunk adds new MCP tools, the agent picks them up without a code change.
Proof-of-work is the human trust layer. The dashboard isn't just a demo artifact — it's what lets a human operator trust that autonomous decisions were made for articulable reasons. Confidence score, evidence chain, recommended action: all in Splunk, all queryable, all auditable. The agent doesn't just resolve the incident; it shows its work.
The anti-sprawl thesis holds — and we proved it twice. Adding SecAgent meant writing a new skill set and pointing the orchestrator at a security saved search — not a new harness, not a new tool layer, not a new governance model. Adding DevExAgent meant exactly the same. The consolidation design (one orchestrator, shared harness, swap skills + polled source) survived contact with a real second and third agent type. Three agent domains, 38 unit tests, one symphunk run command that handles all three.
What's next for Symphunk - Symphony for Splunk
Full DD8 self-observability. Right now all three agents emit investigation evidence via HEC. The next level is structured OTel traces per agent run — token cost, tool call latency, confidence trajectory, budget consumption — fed into Splunk Observability Cloud's AI Agent Monitoring. An agent that Splunk itself can monitor closes the loop: Splunk watches the infrastructure, Symphunk watches the alerts, and Splunk watches Symphunk.
Human-in-the-loop approval gate. The current auto-resolve/escalate decision is binary and fully autonomous. A natural extension is surfacing pending high-severity decisions as an actionable item in the Splunk dashboard — the operator sees the evidence package, clicks Approve or Reject, and the orchestrator continues. The hook infrastructure (PreToolUse approval gates) is already in place; the UI layer is what's missing.
Foundation-Sec-8B integration. Splunk's open-weight security model is locally runnable and purpose-trained on machine data. Wiring it into the SecAgent investigation path — as a first-pass triage filter before escalating to Claude — would put a genuine Splunk hosted model in the reasoning loop and sharpen the security track's pitch considerably.
Multi-tenant and multi-environment support. Symphunk currently targets a single Splunk instance. A natural enterprise extension is routing incidents by environment tag — prod vs. staging vs. region — to separate agent pools, all feeding a unified proof-of-work dashboard. The KV Store schema and orchestrator concurrency model already support this without architectural changes.

Log in or sign up for Devpost to join the conversation.