-
-
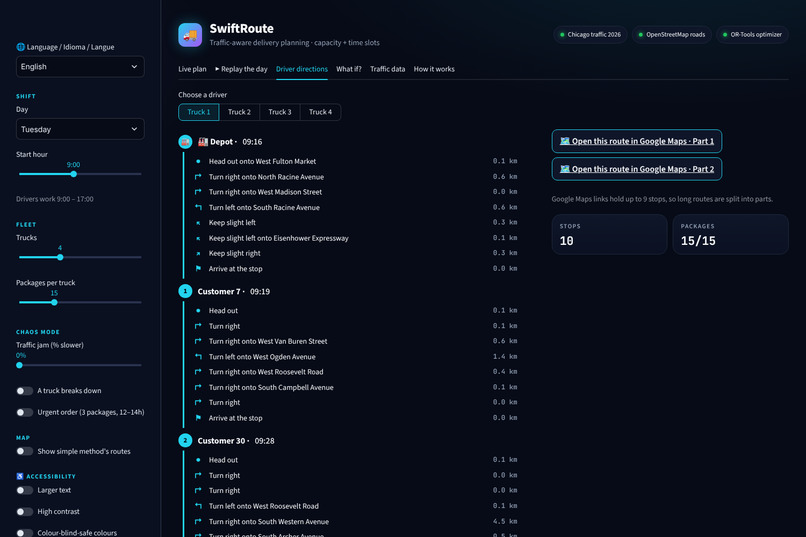
Driver
-
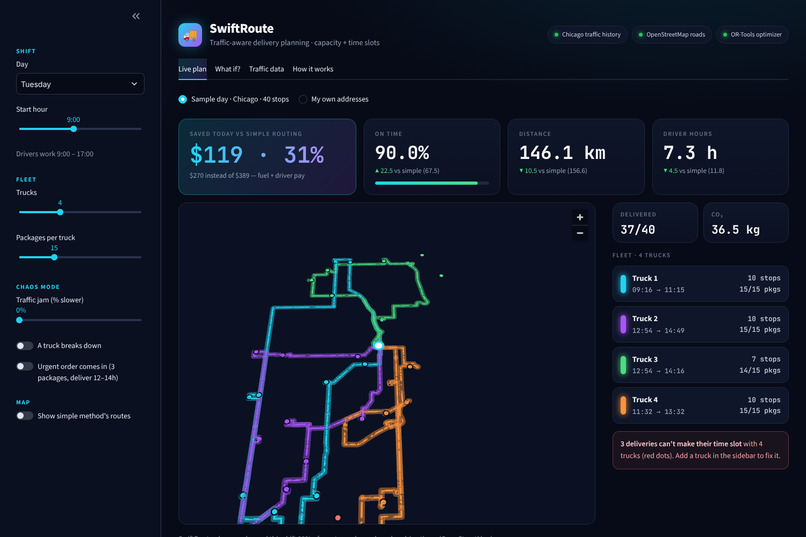
Plan
-
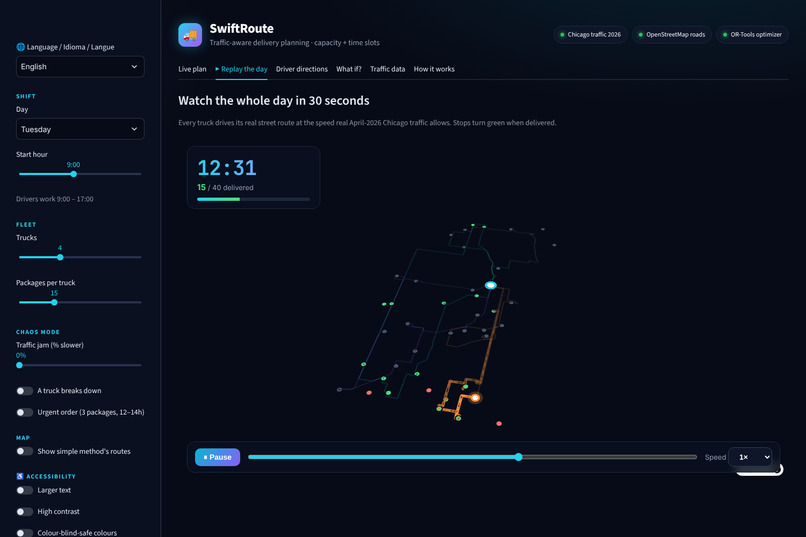
Replay
-
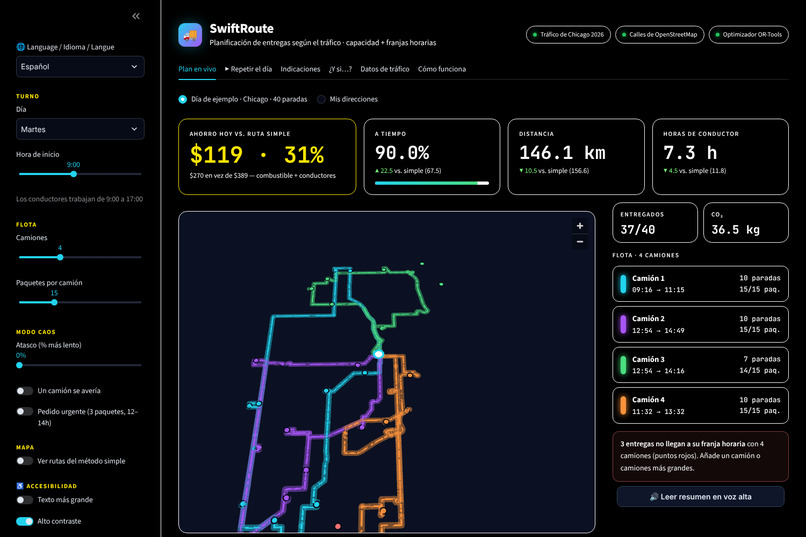
Spanish
-
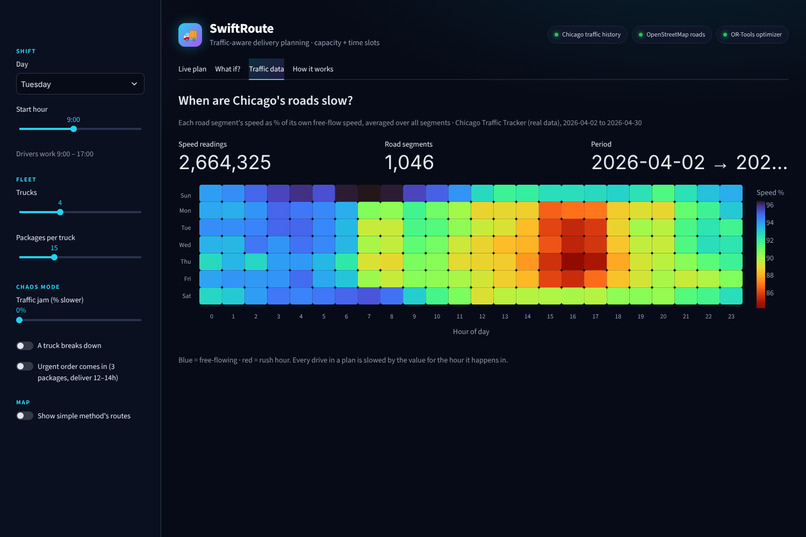
Traffic
-
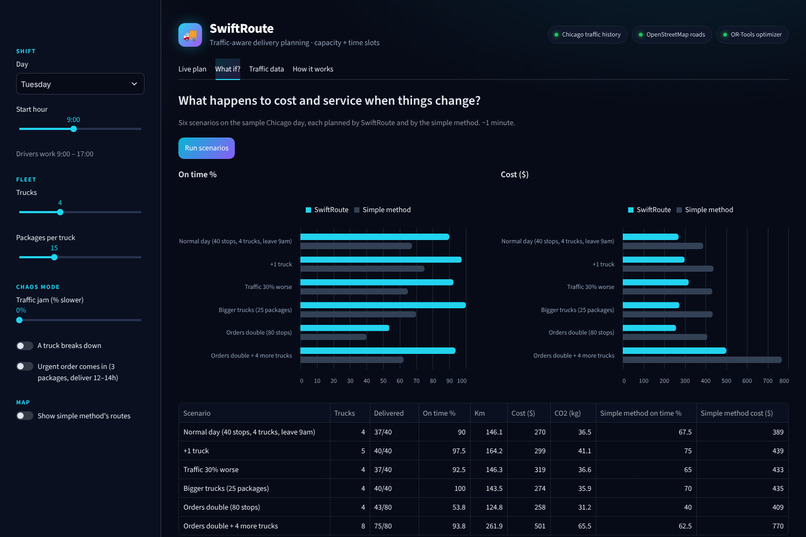
What-IF
-
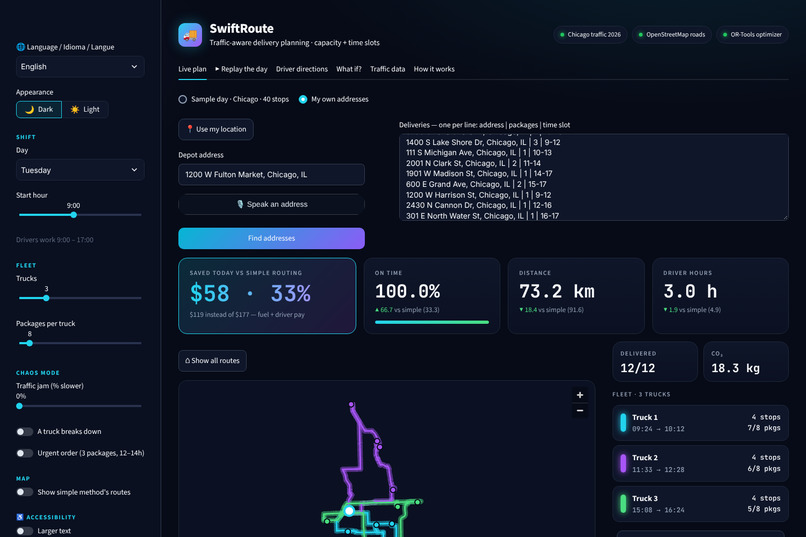
Scenario Plan
-
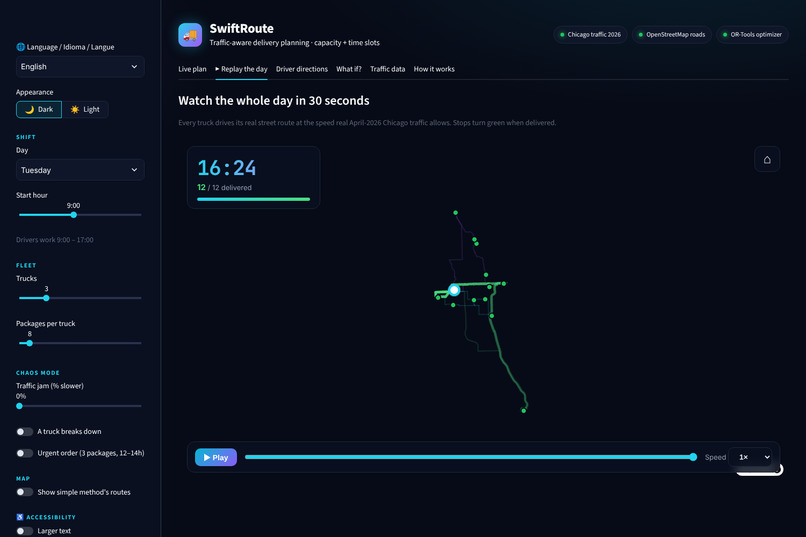
Scenario Replay
Track: Operations Research and Decision Intelligence Problem statement: Last-Mile Delivery Route Optimization: "Optimize last-mile delivery routes under capacity, time-window and traffic constraints to reduce cost and improve service."
How SwiftRoute meets the brief: | Required | SwiftRoute | |---|---| | Capacity constraint | Packages per van, enforced by the optimizer | | Time-window constraint | Customer time slots, enforced by the optimizer | | Traffic constraint | Real hourly Chicago traffic (2.66 M readings) in planning and in the replay | | Routing optimization engine | Google OR-Tools vehicle routing (capacity + time windows) | | Visualization of routes and KPIs | Live map, animated replay, driver directions, cost / on-time / km / CO₂ cards | | Scenario analysis | 6 what-if scenarios + a 10-day robustness test |
Inspiration
Every day, small delivery fleets plan their routes by hand, usually by driving to the nearest stop next. That ignores three things that decide whether a package arrives on time: how much each van can carry, when each customer is home, and traffic that changes every hour. Last-mile delivery is the most expensive part of shipping, and the tools that solve it properly are built for big companies. We wanted something any small business could run on a laptop, built on free, open data.
What it does
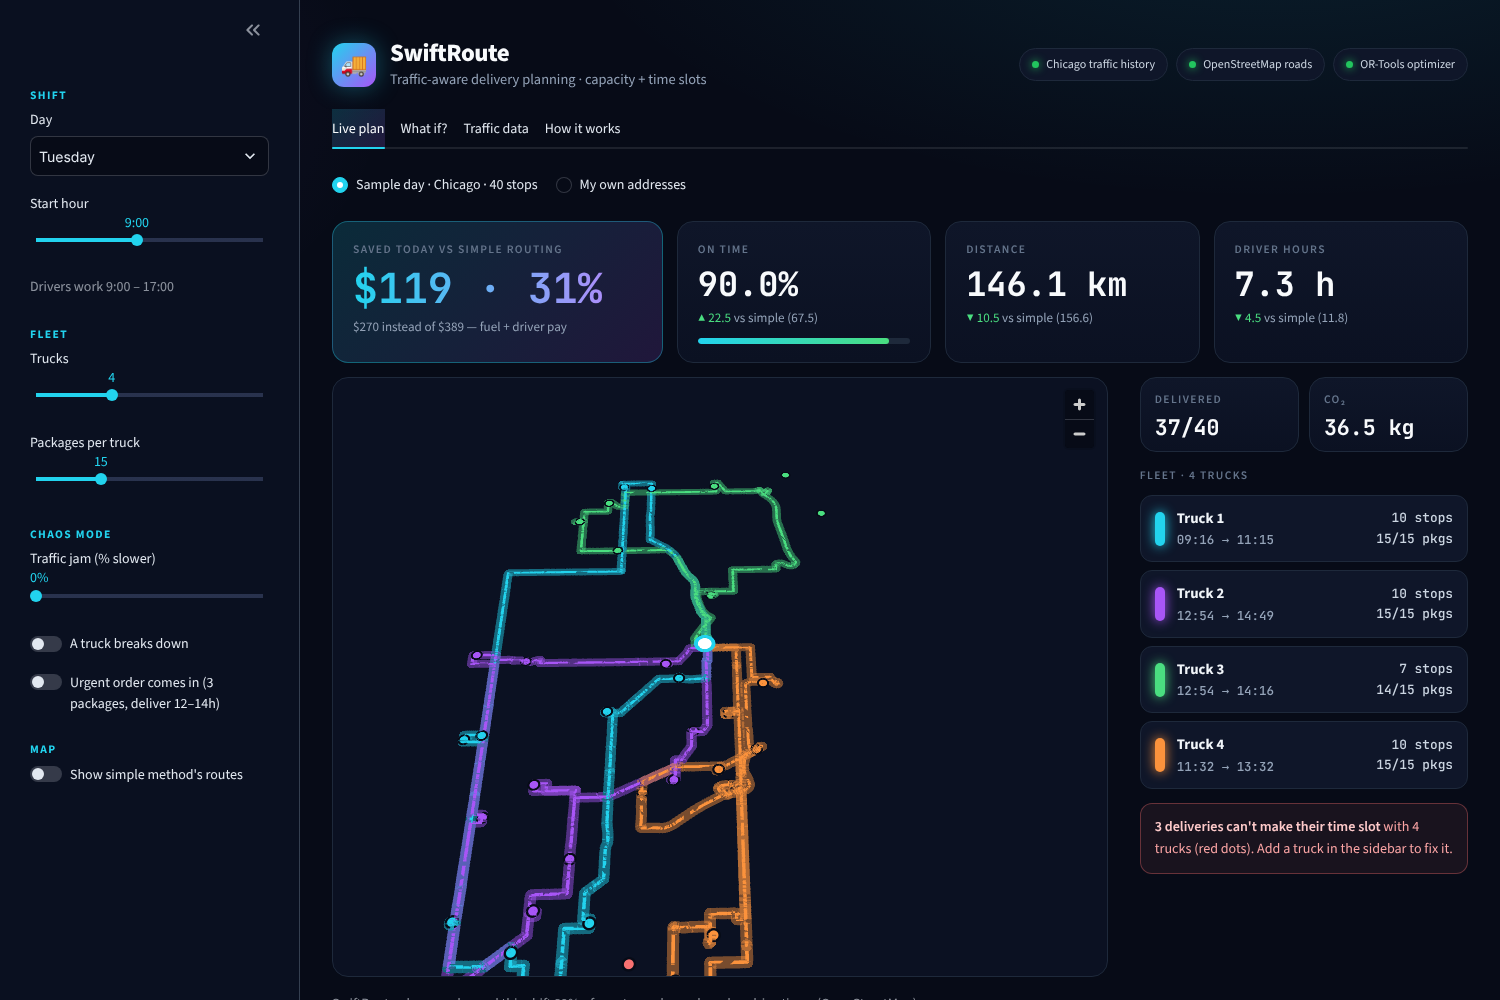
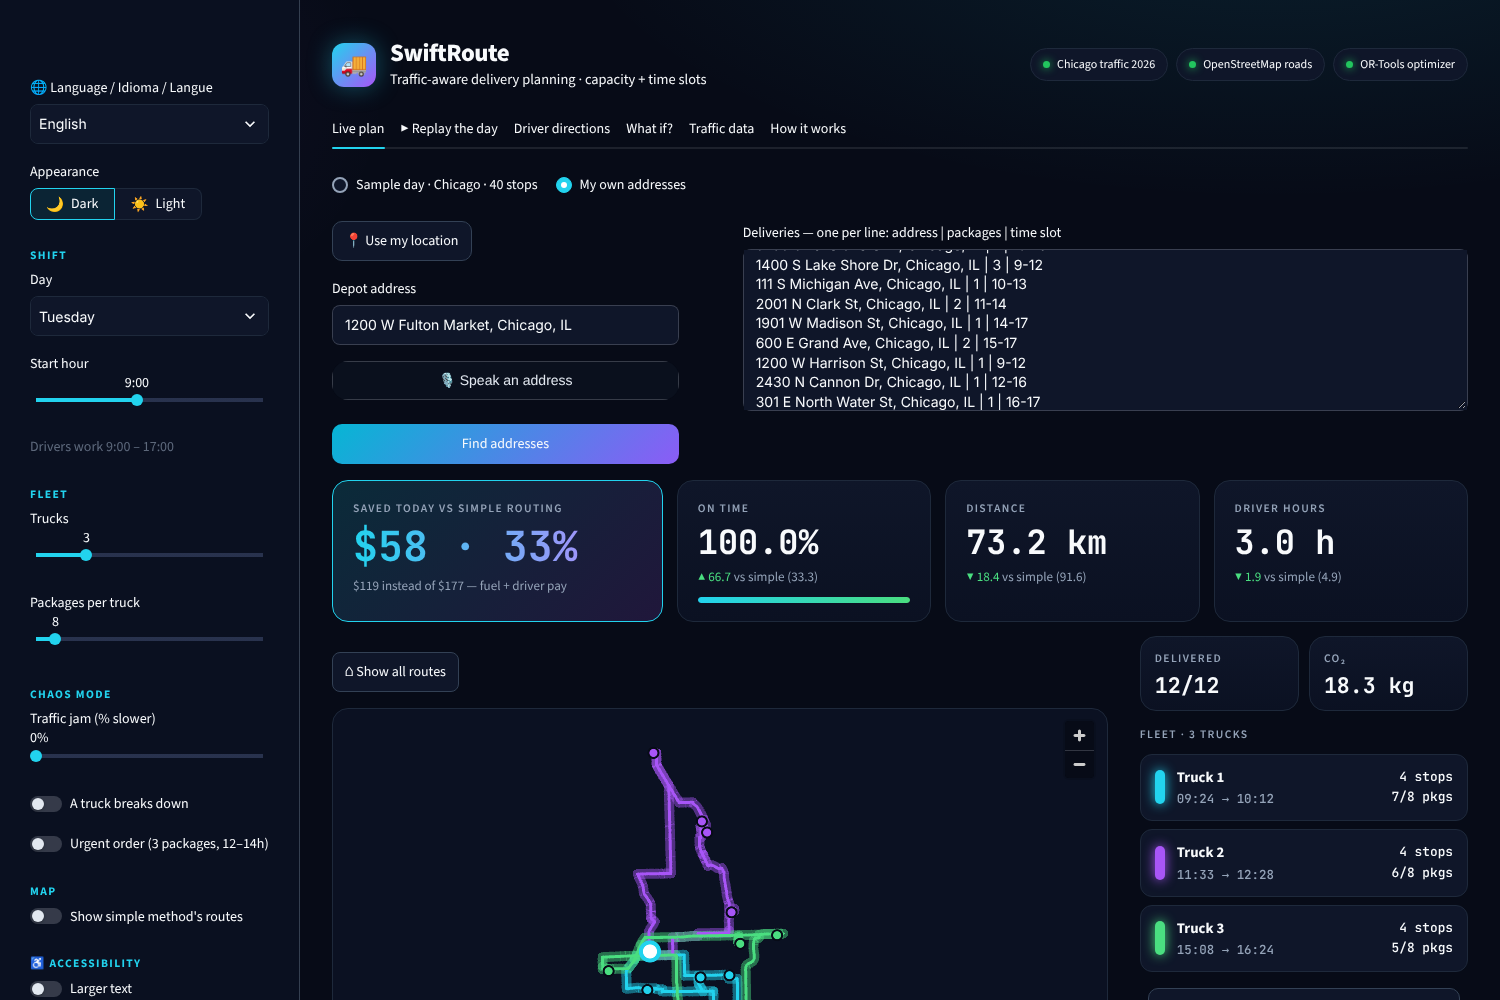
SwiftRoute plans every van's route around capacity, customer time slots and real hourly traffic, then replays the whole day against real traffic to prove the plan holds.
- 🗺️ Live plan: optimized routes on real Chicago streets, with cost, on-time %, distance, driver hours, CO₂ and deliveries compared against the simple method
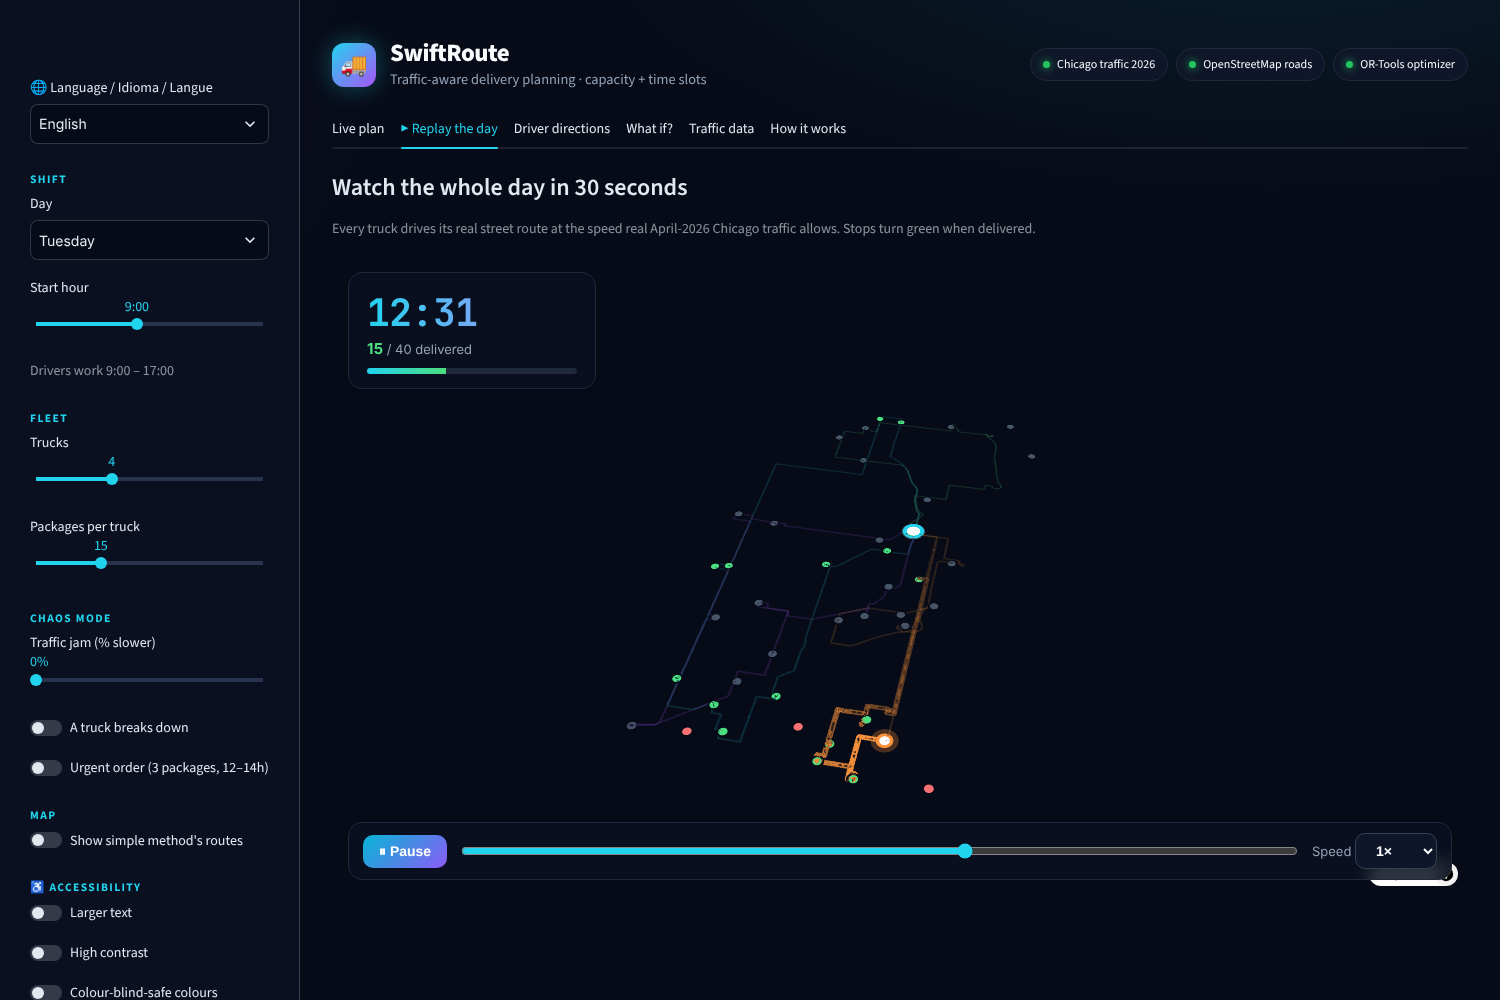
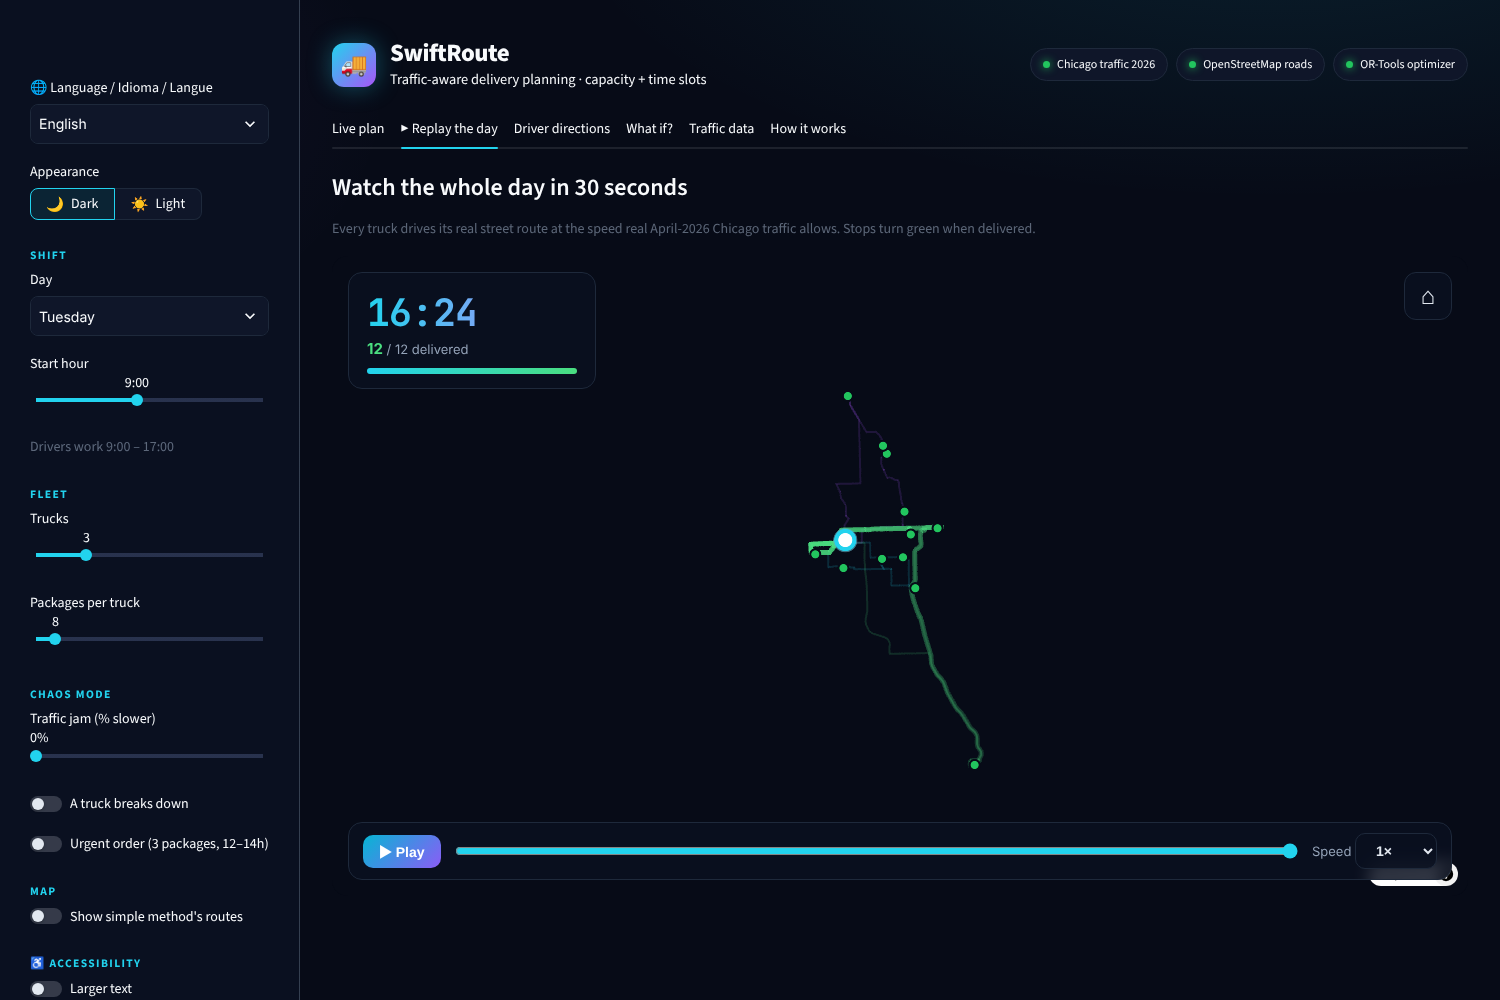
- ▶️ Replay the day: an animated map of every van driving its real route at real traffic speed; stops turn green when delivered
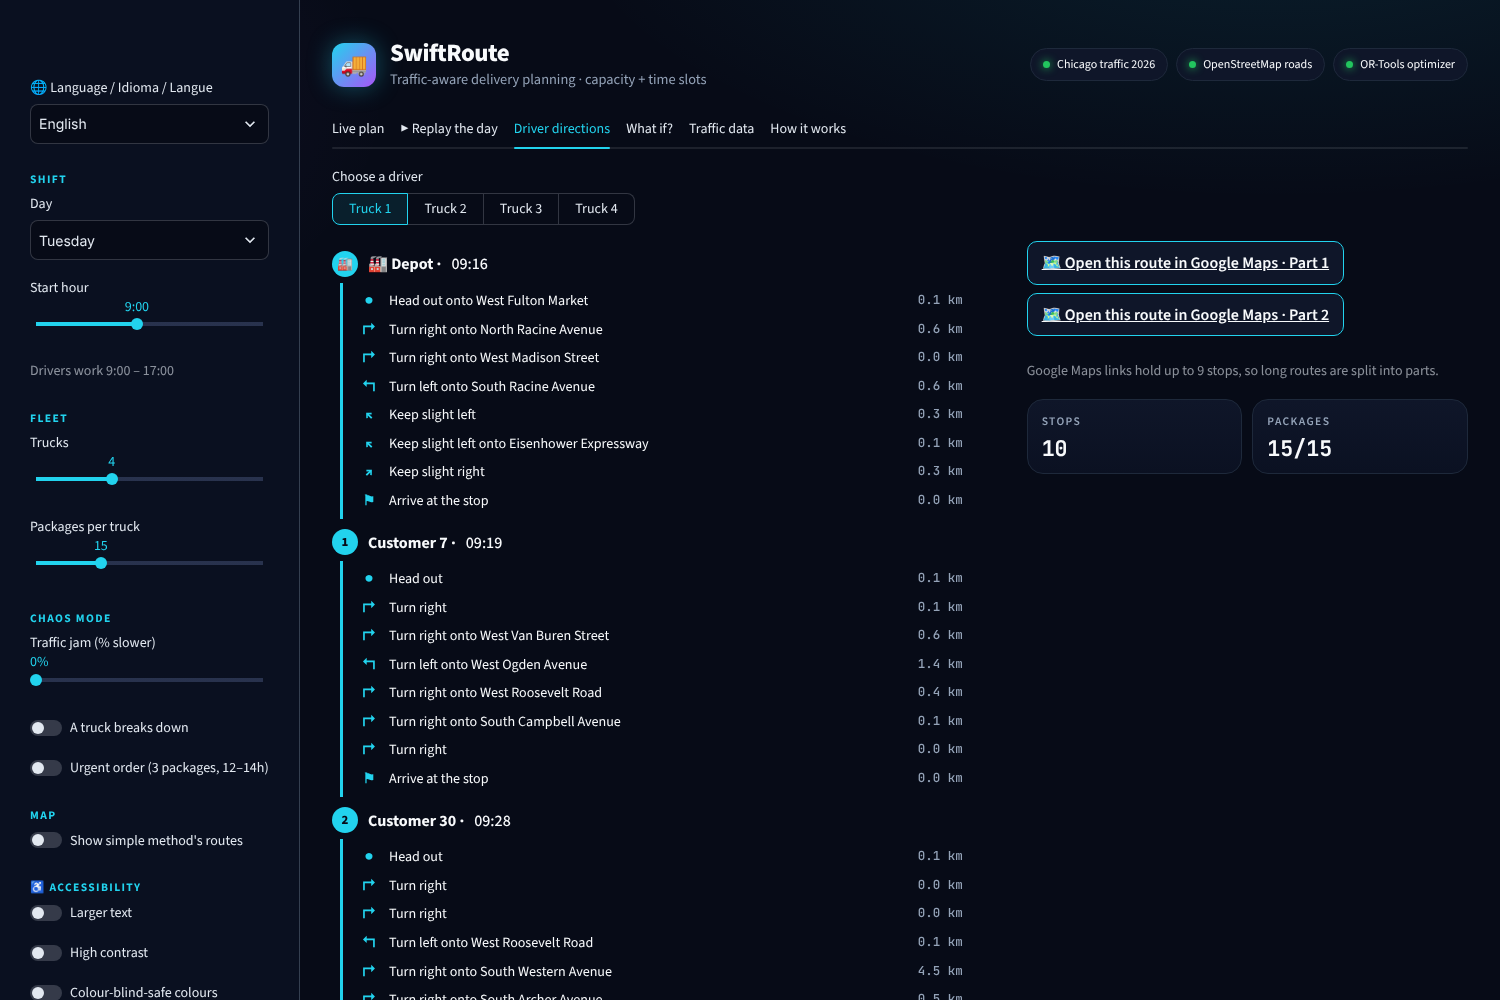
- 🧭 Driver directions: turn-by-turn steps plus one tap to open the route in Google Maps
- 🔥 Chaos mode: traffic jam, van breakdown or urgent order, re-planned in seconds
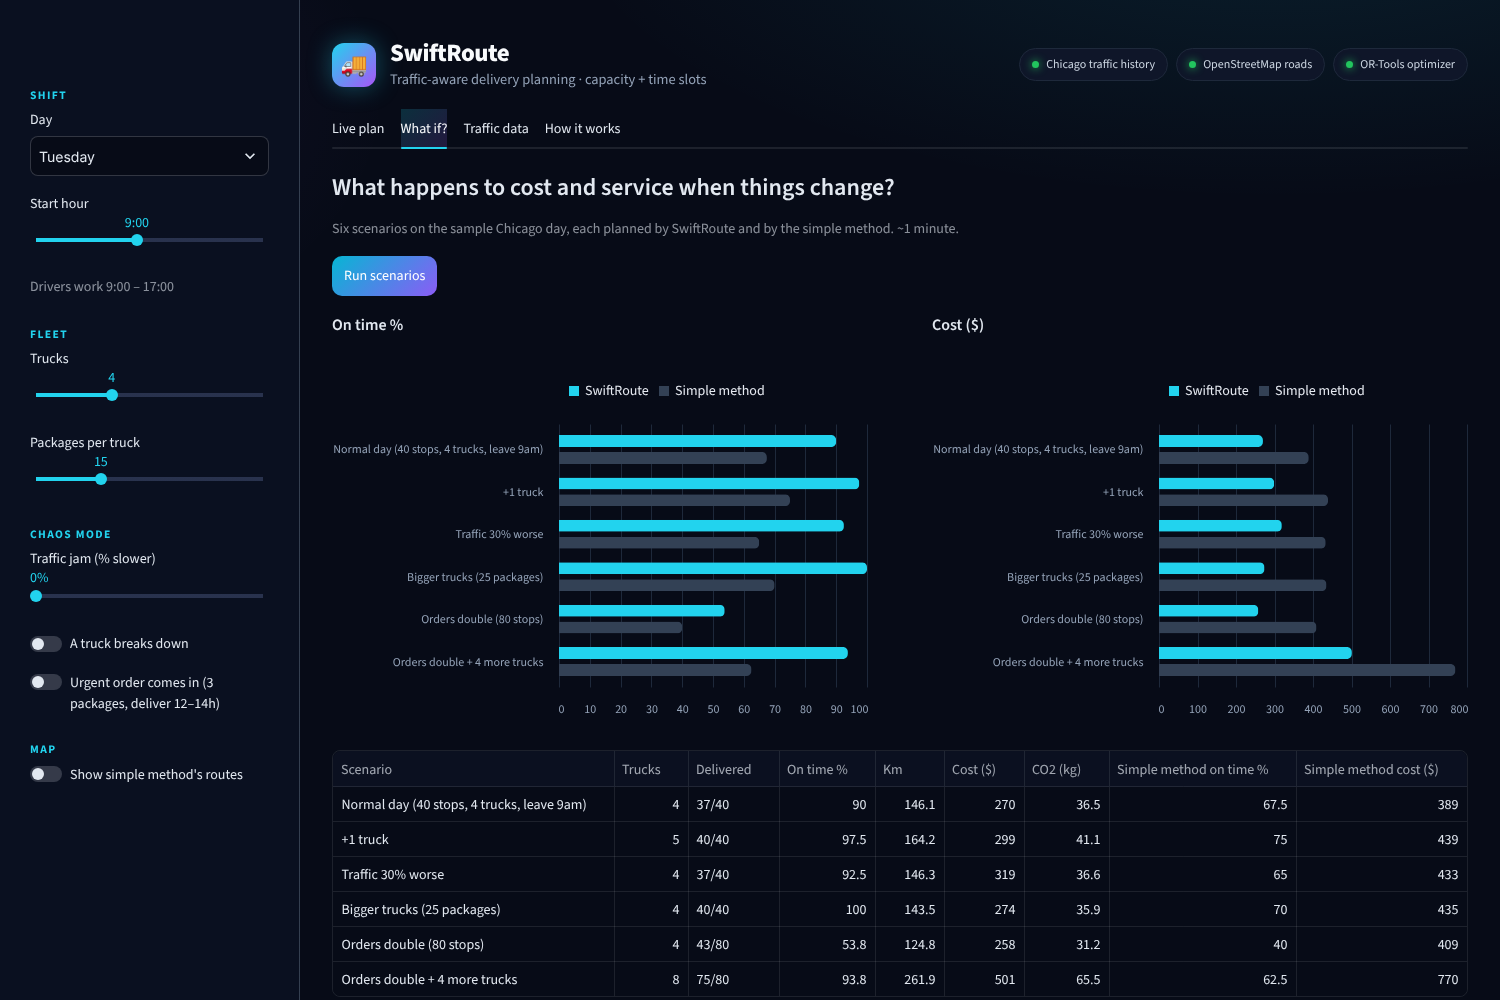
- 🔮 What if?: six scenarios (more vans, bigger vans, worse traffic, double orders)
- 🎙️📍 Voice typing and "use my location" for addresses
- ♿ Larger text, high contrast, colour-blind-safe colours, reduce motion, read-aloud summary
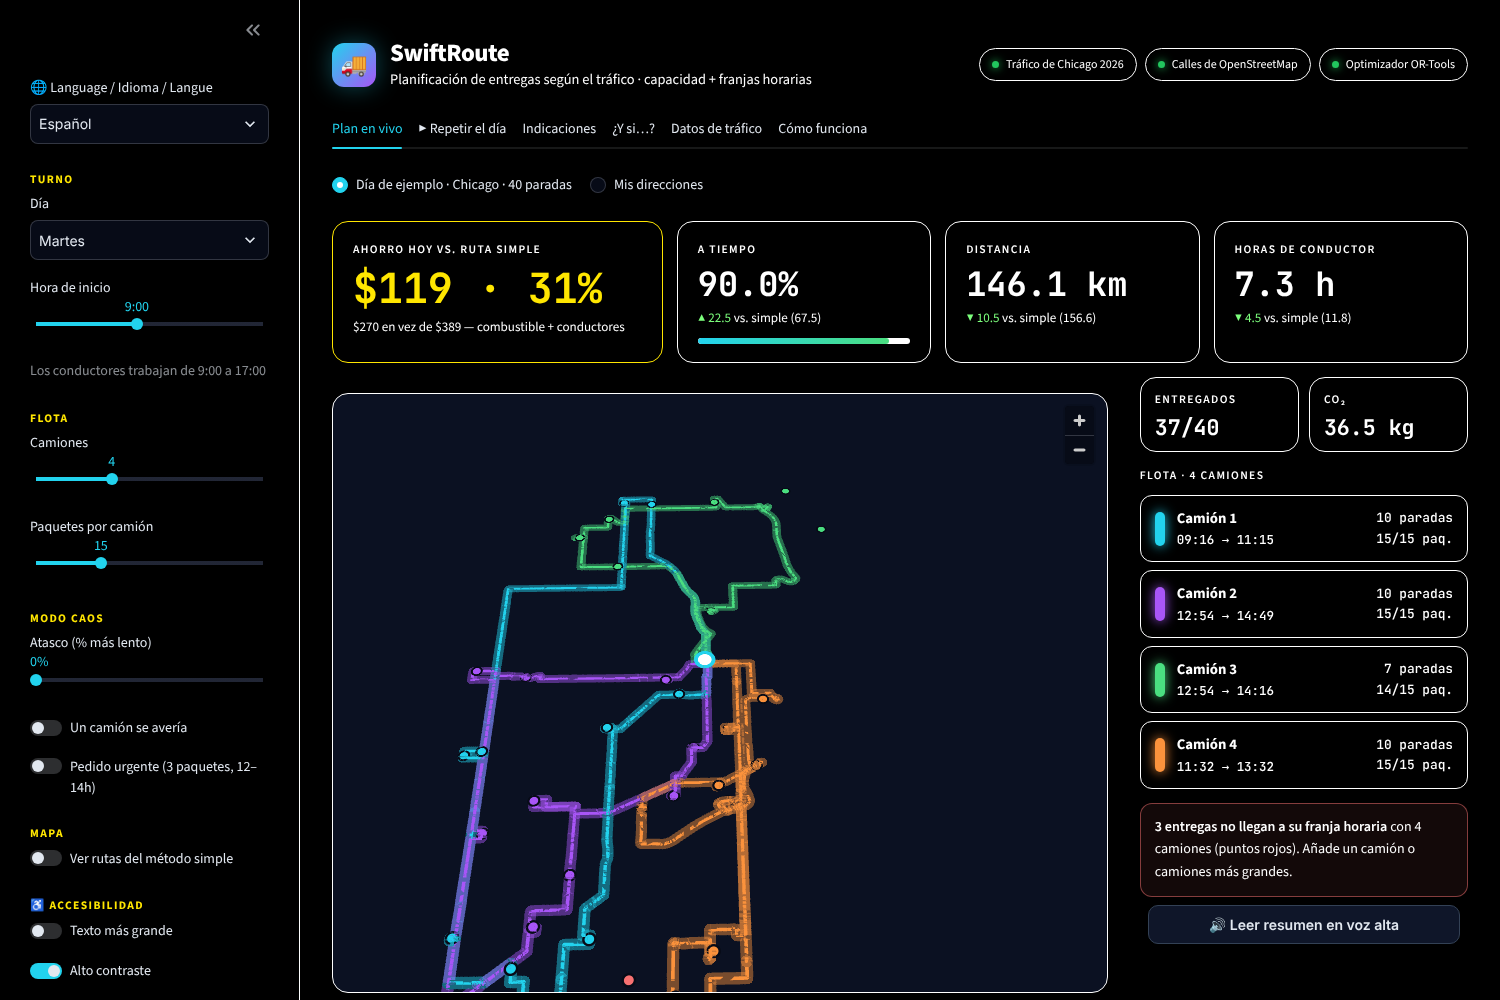
- 🌐 English, Español, Français · 🌗 light and dark mode
How we built it
- Addresses → map points with OpenStreetMap (Nominatim).
- Real roads: distance and empty-road drive time for every pair of stops from OSRM.
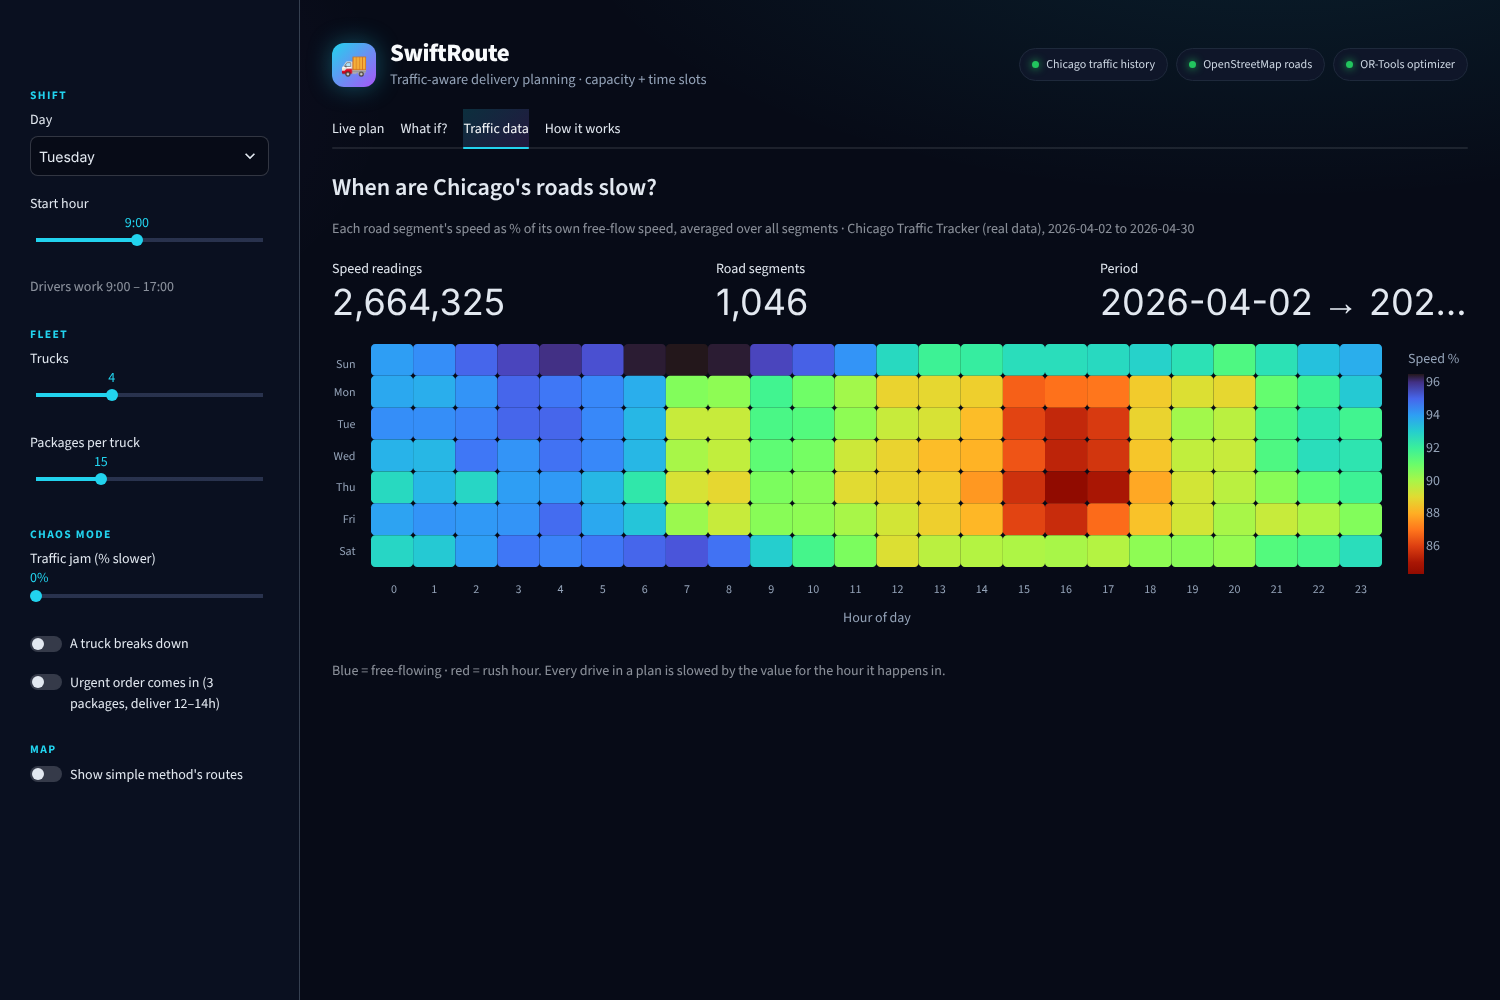
- Real traffic: City of Chicago Traffic Tracker data, 2.66 million speed readings from 1,046 road segments (April 2026). We compare each segment with its own free-flow speed, so highways and side streets are judged fairly, giving a slowdown factor for every hour of the week.
- Optimization: a vehicle routing problem with capacity and time windows, solved with Google OR-Tools.
- Honest check: the optimizer plans with the traffic of the hour each drive is expected to happen; then every route, ours and the benchmark's, is replayed minute by minute with the traffic of the hour it actually happens. All reported numbers come from the replay.
The model. Minimize daily cost
$$\min \; 0.60 \sum_{\text{legs}} d_{ij} \;+\; 25 \sum_{\text{vans}} T_k \;+\; 10{,}000 \cdot (\text{undelivered orders})$$
where \(d_{ij}\) is km driven and \(T_k\) is each van's hours on the road, subject to: each order served at most once, packages per van \(\le Q\), \(\text{open}i \le t_i \le \text{close}_i\), and \(t_j \ge t_i + 5 + \tau{ij}(h)\) with \(\tau_{ij}(h) = \text{free-flow time}_{ij} / f(\text{day}, h)\). OR-Tools uses a path-cheapest-arc start and guided local search: a strong heuristic, not a proof of optimality.
Built in Python (OR-Tools, pandas), with a Streamlit front end, deck.gl / pydeck maps and Altair charts.
Results
We compared SwiftRoute with the "nearest stop next" benchmark (a deliberately simple stand-in for hand-planning) on 10 random days (40 orders, 4 vans × 15 packages, real roads and traffic):
- Cheaper on 10/10 days: −32.6% average cost (range −15.7% to −51.1%)
- More on time on 10/10 days: +23.8 points on average
- Delivered at least as many orders every day (36.5 vs 35.2 of 40), so the savings don't come from skipping work
- Scenario insight: the fleet is limited by van size more than time; bigger vans reach 40/40 delivered, 100% on time, at almost the same cost
Everything is reproducible: fixed seeds, cached road data, committed traffic data and a fixed solver budget give byte-identical results on any computer (python validate.py). 11 automated tests check capacity, time windows, no repeated stops, infeasible orders and the replay. An end-to-end test with a real florist's day (12 real Chicago addresses) passed 19/19 independent checks.
Challenges we ran into
- Reproducibility: our first validation gave slightly different numbers on each run, because the solver stopped after a number of seconds. Switching to a fixed number of solutions, and caching road data, made results identical everywhere.
- Traffic data at scale: the city's servers timed out on years of history, so we download only the columns we need and aggregate locally.
- Honesty about the plan: a plan can look perfect on paper and still be late in real traffic. That's why we built the replay, and why every number we report comes from it.
- Bugs that tests caught: a map zoom formula off by a factor of 2 (deck.gl uses 512-pixel tiles), a dot-size setting that painted over the whole map, and our own wrong first explanation for why a test day needed three vans.
What we learned
- Real data beats assumptions: rush hour in Chicago is 3–6 pm on weekdays, not the morning.
- A good benchmark comparison needs the same inputs, the same scoring and honest reporting of misses.
- Optimization is only useful if people can use it, which is why we added driver directions, languages and accessibility.
What's next
- Multi-trip routing: vans returning to the depot to reload mid-day
- Live traffic feeds and more cities
- A driver phone app with live re-routing
- Real order data from partner fleets
Team
[Haricharan Parna] – [Developer/ Frontend, Backend, and UI] [Lavanya1 Omtri] – [Tester/ Tested and Critiqued The App]
Built With
- altair
- chicago-open-data
- css
- data-science
- deck.gl
- git
- github
- html
- javascript
- maplibre
- nominatim
- openstreetmap
- operations-research
- optimization
- or-tools
- osrm
- pandas
- pydeck
- pytest
- python
- streamlit
- vehicle-routing
