-
-
-
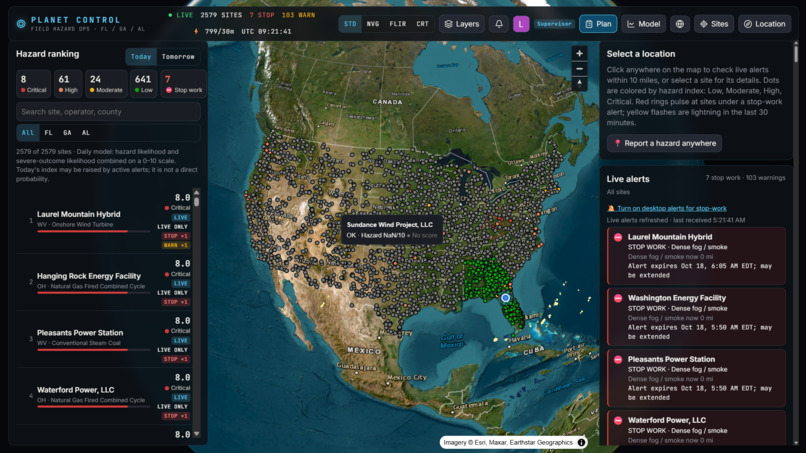
Map of all the locations present
Inspiration
We all deal with bad weather, and most of us have gotten good at just getting through it. We rarely think about what it does behind the scenes: to supply, to businesses, and especially to the crews who keep power plants running. A lightning strike 4 miles away, a heat index of 108°F, or a river at flood stage can put a field crew in danger in minutes. After hearing about this problem from Sperry Tech, our team decided to build the tool a crew supervisor would actually want open on their screen.
What it does
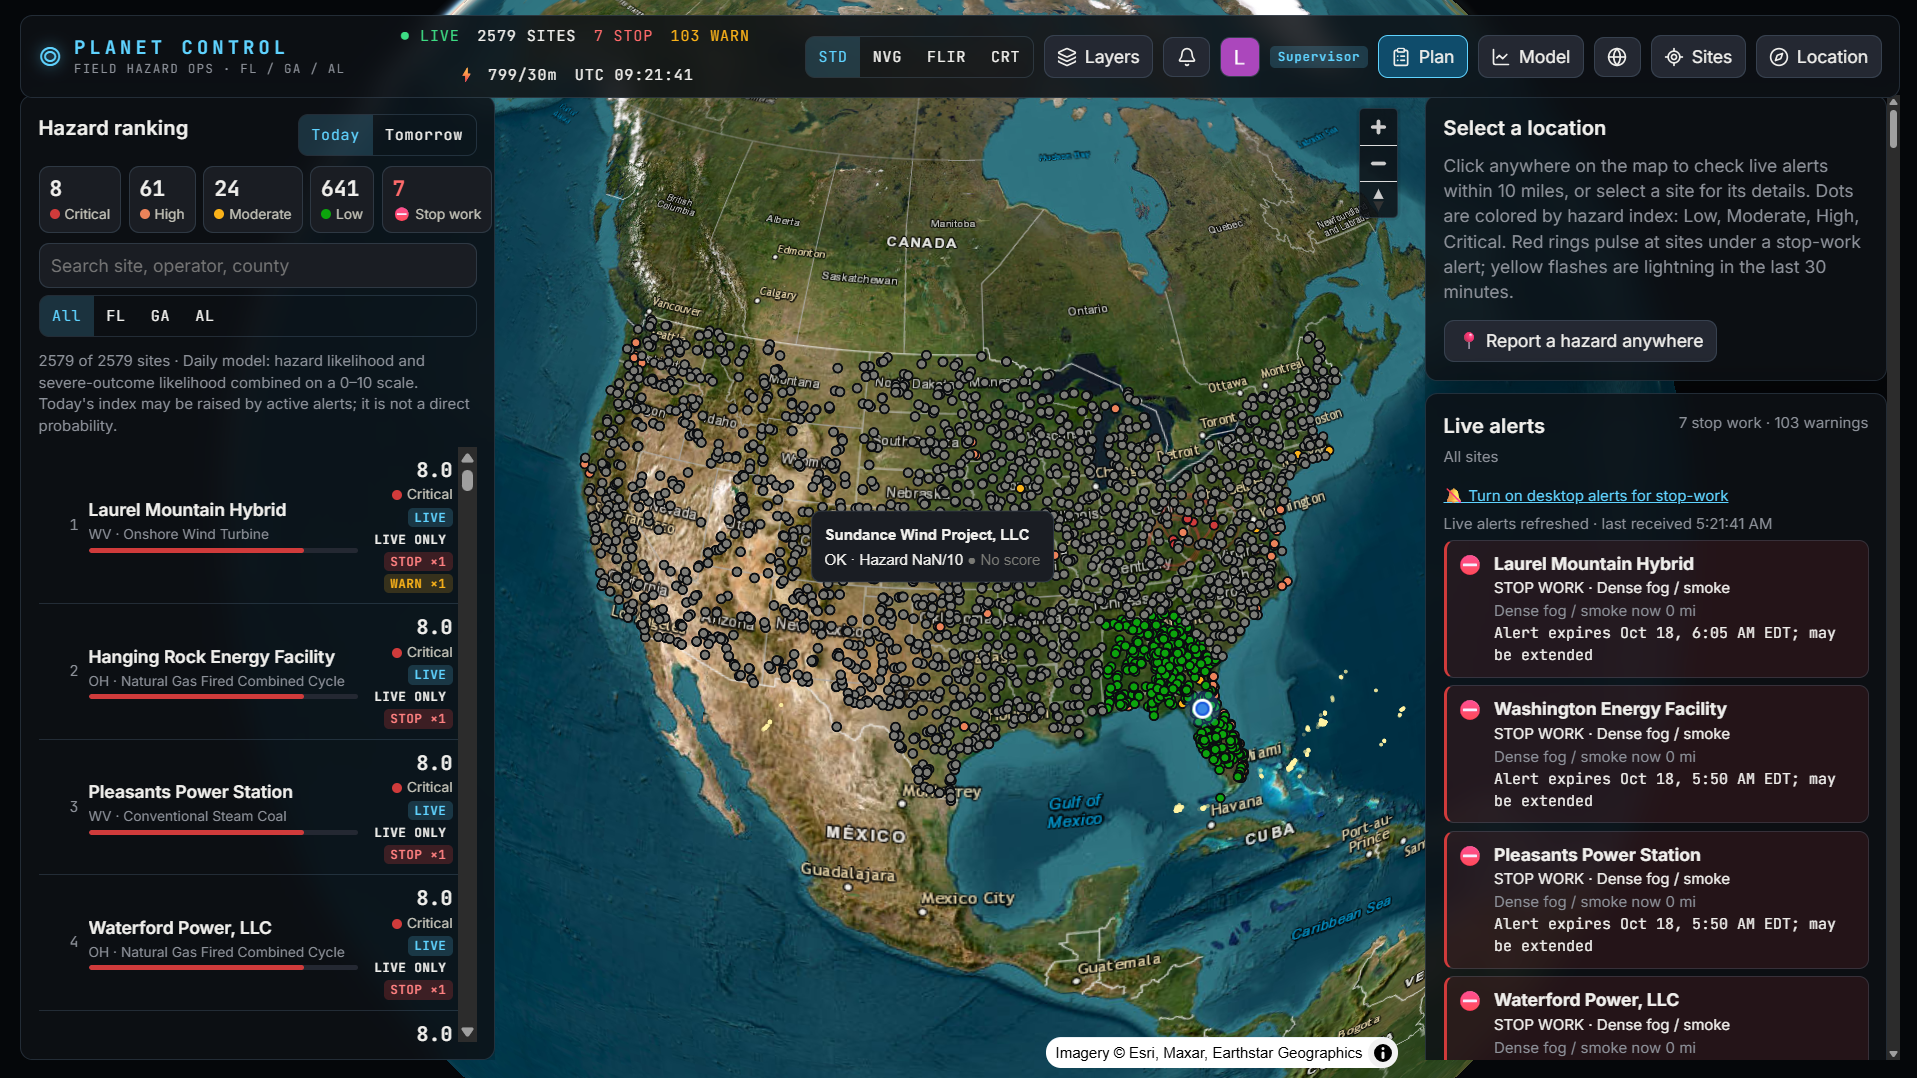
Plan It By The Planet watches 694 real power plants across Florida, Georgia and Alabama and tells crews and supervisors what to do about the weather, what it will cost, and how sure we are.
- Hazard Index (0–10) for every plant, today and tomorrow, from a machine-learning model trained on 11 years of real storms and worker injuries, with the weather drivers behind each score.
- Instant stop-work alerts:
- Lightning within 10 miles triggers a full-screen STOP WORK countdown. The 30-minute all-clear restarts with every new strike.
- Flood risk after heavy rain, rivers at flood stage, coastal tides above NOAA flood levels, soft ground after a wet week, NWS warnings, wildfires and wildlife sightings.
- A 6 PM next-day briefing for every site. For supervisors, it's a full-screen summary with ready-to-send Discord/Slack messages for each crew.
- Crew hazard reports with a photo and a map pin. They alert the site instantly and work offline: they send when the phone gets signal back.
- A supervisor Plan view:
- Act now: what to do and what to bring.
- This week: what to stage before heat, storms and rain.
- Invest: which plants lose the most to weather each year, the fix, and its payback.
- Economics: dollars at risk this week, losses by utility, and our findings.
- Flood context for each site: the FEMA flood zone, whether it sits behind a levee (USACE National Levee Database), and the nearest tide gauge.
- AI safety reports (Gemini) that explain each score and give a GO / CAUTION / NO-GO call, with sources cited. Every number Gemini writes is checked against the data.
How we built it
We split into frontend and backend teams, planned in short Scrum-style check-ins, and used Anthropic's Claude to speed up development.
- Data:
- Plants: EIA-860M, cross-checked against OpenStreetMap (14 locations corrected).
- History and model labels: NOAA Storm Events, OSHA Severe Injury Reports, CDC WONDER.
- Weather: Iowa Environmental Mesonet station history, NWS forecasts, alerts and readings; GOES-19 satellite lightning; NOAA river gauges and Tides & Currents.
- Flood exposure: FEMA flood maps and the USACE levee database.
- Economics: EIA sales and demand, DOE EAGLE-I outages, BLS labor costs; USAspending, SEC and OpenFEMA for the experiments.
- Backend: Python/FastAPI with a scheduled worker that pulls live feeds every 1–60 minutes, on Tiger Data (TimescaleDB + PostGIS) for time-series and geospatial queries.
- ML: XGBoost, one model per hazard type, trained on about 1.1 million plant-days.
- AI: Google Gemini, constrained to the facts we compute, with a template fallback.
- Frontend: React + MapLibre GL globe; works on phones.
- Security: Auth0 sign-in (RS256 JWT), separate crew and supervisor identities, encrypted webhook URLs, a least-privilege database user.
- Hosting: a Vultr server behind Caddy (automatic https) at plan-it-by-the-planet.us.
Methodology
1. Hazard Index (machine learning)
- One row per plant per day. The inputs are only what's known by 6 PM the night before, so training matches live use:
- the NWS forecast: high and low, heat index, hours at heat index 103°F or more, rain, chance of thunder, gusts;
- NWS watches and warnings issued by then;
- the past 6 days of rain;
- season and location.
- Labels: whether a NOAA storm event or an OSHA weather injury happened within the hazard's radius that day. A separate "severe" label marks days with a death, an injury, \$1M+ damage or a worker injury.
- One XGBoost classifier per hazard
c(severe storm, tropical, flooding, lightning, heat, cold, high wind) gives its probabilityp_c, and a severe-outcome model givesP_severe. Trained on 2021–2024, tested on 2025–26, which the model never saw.
$$ P_{\text{any}} = 1 - \prod_{c} \left(1 - p_c\right) $$
$$ \text{Hazard Index} = 10 \left[ 1 - \left(1 - P_{\text{any}}\right)\left(1 - P_{\text{severe}}\right)^{4} \right] $$
- Severe outcomes count 4×, a weight we chose and state openly.
- Why each score is high: the top weather drivers come from SHAP contributions.
- Live floor: today's index
Ican't drop below what's happening right now, where the floorFis:- 8 for an active stop-work alert;
- 5 + 2r for an active warning, with
rits intensity from 0 to 1; - 4 for an open crew report;
- 3.5 for a river at action stage.
$$ I_{\text{today}} = \max\left(I_{\text{model}},\ F\right) $$
2. Live alert rules (stored as data, not hard-coded)
| Hazard | Warning | Stop work |
|---|---|---|
| Lightning (GOES-19, checked every minute) | strike within 20 mi | strike within 10 mi; 30-min all-clear that restarts on every strike |
| Heavy rain | ≥ 2 in in 12 h (≥ 1.5 in in a FEMA floodplain) | ≥ 4 in in 12 h |
| Rivers (NOAA gauges) | action stage or worse within 5 mi | minor flooding or worse within 1 mi |
| Coastal tides (NOAA) | at or above minor flood level within 10 mi | moderate or worse |
| Soil saturation | ≥ 4 in in 7 days | ≥ 8 in in 7 days |
3. Expected crew impact and investment planning
The symbols:
E: expected crew-hours lostK: their costh_c: hours lost per stop-work day for hazardcN: crew sizeH: one shiftw: the state's labor rate (BLS: FL \$58.33/h, GA \$56.26, AL \$56.65)D_c: stop-work days per year for hazardcat the siteC_fix: the fix's costρ: the share of lost time the fix avoids
$$ E_{\text{day}} = \min\left( \sum_{c} p_c\, h_c,\ H \right) \times N $$
$$ K_{\text{day}} = E_{\text{day}} \times w $$
$$ L_{\text{year}} = \sum_{c} D_c\, h_c\, N\, w $$
$$ \text{Payback (years)} = \frac{C_{\text{fix}}}{L_{\text{top hazard}} \times \rho} $$
4. Weather in real sales: the same degree-day method utilities use for the "weather" line in their SEC filings, applied to EIA's reported monthly sales S_t. The symbols:
T: each day's mean temperature at the stations of each utility's plants, summed over the days of monthtn_t: the days in monthtp̄_t: that month's average retail price- a bar over CDD or HDD: that calendar month's normal (its average across the years)
$$ \text{CDD}_t = \sum \max\left(0,\ T - 65^\circ\text{F}\right) $$
$$ \text{HDD}_t = \sum \max\left(0,\ 65^\circ\text{F} - T\right) $$
$$ S_t = a + b\,t + c\,n_t + d\,\text{CDD}_t + e\,\text{HDD}_t $$
$$ \text{Weather effect} = \left[ d\left(\text{CDD}_t - \overline{\text{CDD}}\right) + e\left(\text{HDD}_t - \overline{\text{HDD}}\right) \right] \times \bar{p}_t $$
5. Trust in the AI text
- Code makes every decision: the GO / CAUTION / NO-GO call, the scores and the alerts. Gemini only explains them.
- Each fact has a source ID that Gemini must cite.
- An audit flags any number in Gemini's text that isn't in the facts.
- Reports and briefings are cached until the next 6 PM.
Results
- The model beats a no-weather baseline (each site's usual rate for that month), over three test years:
| Ranks hazard days (AUC) | Ranks death days | Severe days in top 10% | |
|---|---|---|---|
| Baseline | 0.659 | 0.646 | 34% |
| Plan It By The Planet | 0.870 | 0.919 | 46% |
- Per-hazard test AUC (2025–26): cold 0.98, flooding 0.94, heat 0.92, lightning 0.91, severe storm 0.90, high wind 0.85.
- Weather drives crew workload: weeks with more stop-work weather have more customer-hours without power at all 11 grid operators tested, with seasons removed (r = 0.28–0.71, p < 0.001).
- Weather moves real sales: adding degree days raises Alabama Power's model fit from R² 0.13 to 0.98. It priced Georgia Power's mild 2023 at about −$147M, consistent with what Southern Company reported to investors.
- We tested two hypotheses and rejected both:
- Storms don't explain failed contracts. Only 4.6% of contracts disrupted near a tornado cite weather, and with controls the odds ratio is 1.12 (95% interval 0.98–1.27).
- There's no "restoration boom" after storms: 0 of 15 tests found one.
- Flood exposure: 106 plants are in FEMA's 100-year floodplain. 27 sit behind a levee and 112 are within 10 miles of one.
Challenges we ran into
- Scope. We wanted everything, so we had to decide what was core to crew safety and what was optional.
- Real data is messy. Three examples of what we found and fixed:
- Weather sensors reporting "sustained winds" of 200–959 knots, which sent our investment ranking to the wrong plants.
- Wrong alerts: a captive alligator at the Georgia Aquarium triggering wildlife alerts in downtown Atlanta; NWS cancellation notices showing up as new warnings; a broken coastal gauge claiming 16-foot "major flooding."
- Gaps at night: Navy airfield weather stations go quiet overnight. We now fall back to the nearest station that's still reporting.
- Honest numbers. Raw correlations looked like support for our first hypothesis, but they disappeared once we controlled for contract length. We reported the honest result.
Accomplishments that we're proud of
- This is the most technical project any of us has built, from vision board to a deployed, working app on our own domain in under 36 hours.
- A model that beats its baseline, alerts built on live federal data, and an AI layer we can audit.
- Economic findings that include the hypotheses we rejected, because that's what the data said.
What we learned
We used a lot of what we've learned in our CISE classes at UF: database design, Scrum planning, and solid programming fundamentals. It felt like a real milestone to bring years of coursework together. We also learned new things outside the classroom:
- machine learning and model evaluation (baselines, backtests, calibration);
- time-series and geospatial databases;
- authentication and security;
- deploying and running a live web app.
Limitations
- Study area: history, the model and the economics cover Florida, Georgia and Alabama only. The model isn't applied outside the region it was trained on.
- Weather comes from the nearest station, not the site: 20–50 miles away for some plants. Lightning is accurate to about 5 miles.
- Hard-to-test hazards: tropical storms can't be tested on new data, because none hit these plants in 2025–26. Cold and high-wind probabilities run low (the ranking is still strong), because 2025–26 had more of those events than the training years.
- Dollar figures depend on labeled assumptions: crew size, hours lost per hazard and fix costs. Supervisors can replace them with company numbers in the app.
- Public stand-ins: no public data set has crew trip logs, so we use outage hours and live utility outage maps instead. Correlation isn't causation.
- Zone-wide NWS alerts can include plants near the edge of an alert area.
What's next for Plan It By The Planet
- Nationwide coverage: we've already prepared 1,885 more plants across the lower 48 for live alerts, and the next step is training the model on each region's own history.
- Company data: load a utility's real crew logs, sales and project costs. Our loaders are ready, and that would turn our estimates into measurements.
- A tool for both sides: with the right support, this can become a real tool that keeps field crews safe and helps managers plan, starting in the U.S. and, with the right data sources, beyond.
Built With
- auth0
- caddy
- claude
- discord
- fastapi
- gemini
- javascript
- machine-learning
- map-libre
- national-weather-service-ndfd
- noaa
- numpy
- openstreetmap
- pandas
- postgresql
- python
- react
- scikit-learn
- slack
- tiger-data
- timescaledb
- vultr
- xgboost

Log in or sign up for Devpost to join the conversation.