Unlocking Sustainable Solutions: A Data-Driven Journey
Inspiration
As I watched the news reports of the devastating floods in Nairobi, Kenya, the current flood situation in Nairobi have sparked my interest. The images of submerged streets, displaced families, and the disruption to the city's infrastructure were a stark reminder of the pressing environmental challenges we face. It was in that moment that I knew I had to do something.
What it does
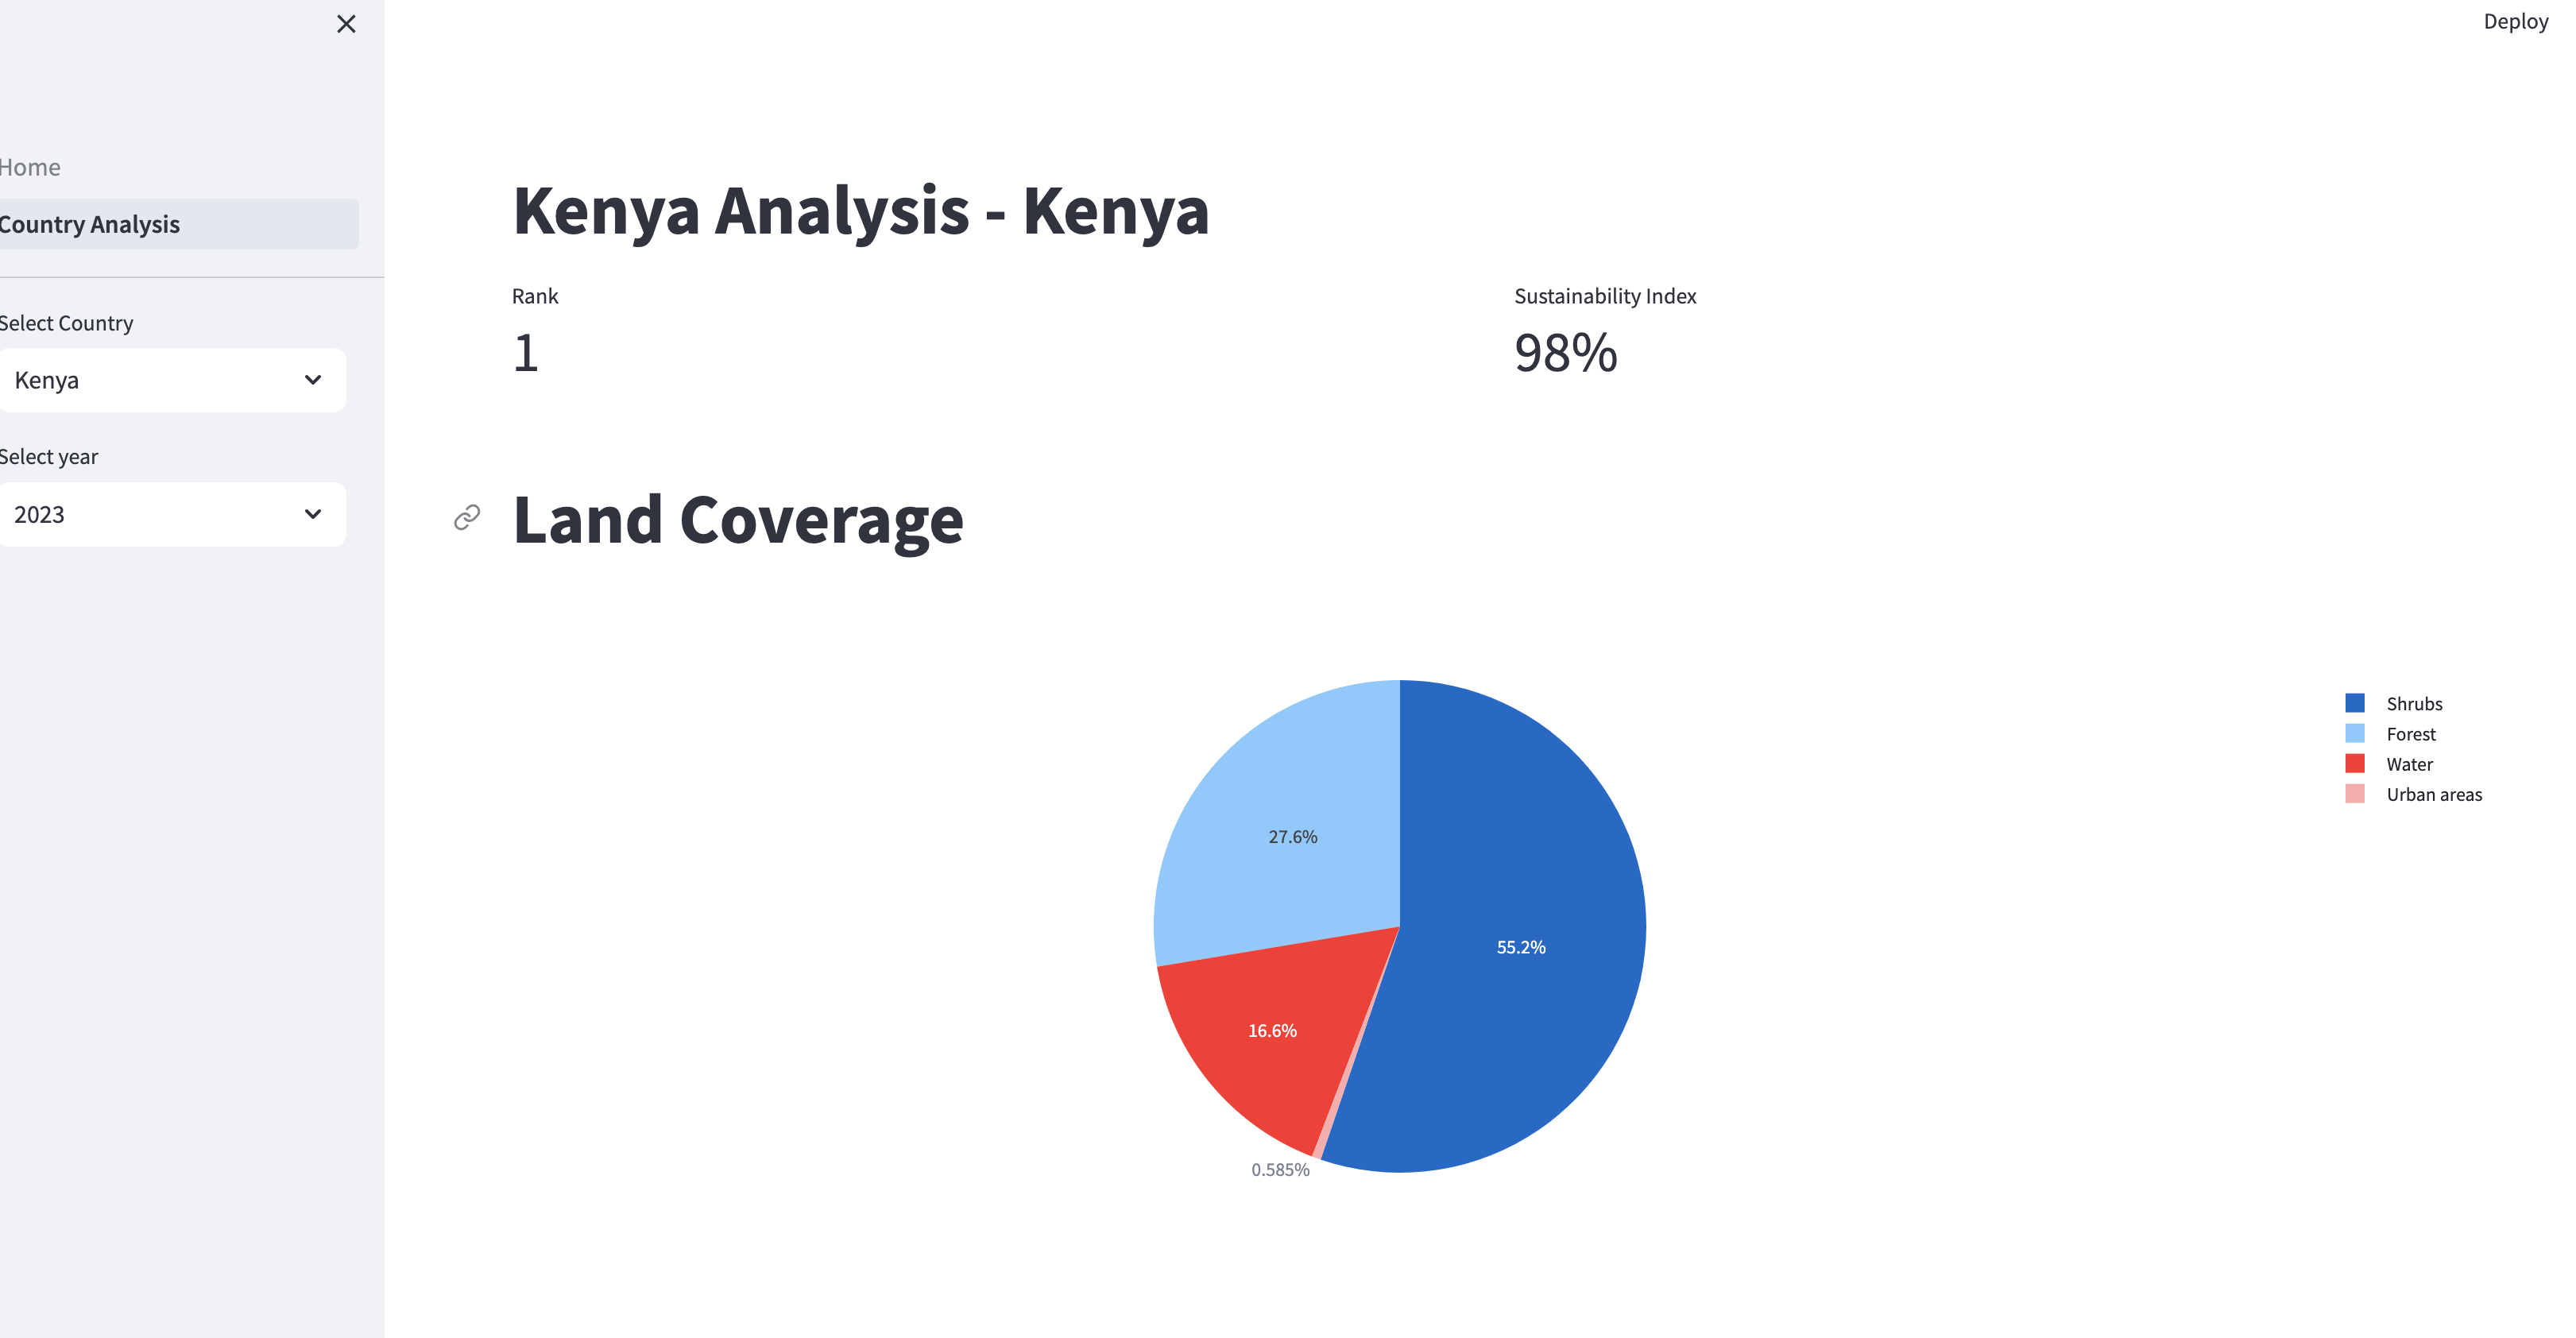
This project aims to create a comprehensive data visualization tool that showcases the interconnected relationships between various environmental metrics, including land mass changes, greenhouse gas emissions, precipitation patterns, air pollution, and surface temperature. By leveraging the power of Google Earth Engine's datasets, the dashboard provides data-driven insights to inform sustainable decision-making and enable the identification of targeted interventions. The dashboard is useful for gevernment and policy makers to make sustainable decisions about our planet.
How we built it
Driven by a desire to understand the underlying factors contributing to these extreme weather events, I began to delve into the complex web of environmental data. Through my research, I discovered the intricate relationships between these elements and set out to create a Streamlit dashboard that would visualize these interconnections.
I utilized the Google Earth Engine Python API to retrieve and process the necessary data, including land cover and land use datasets, greenhouse gas emissions inventories, precipitation records, air quality measurements, and land surface temperature observations. The dashboard features multiple visualizations, such as line charts and heatmaps, to effectively communicate the correlations between the different environmental metrics.
Challenges we ran into
Integrating and harmonizing the diverse datasets proved to be a significant challenge, as each data source had its own unique format, resolution, and temporal coverage. Overcoming these technical obstacles required a deep understanding of the underlying data structures and the development of robust data processing pipelines.
Accomplishments that we're proud of
The insights gleaned from the dashboard have the potential to inform and empower decision-makers, policymakers, and the general public. By highlighting the interdependencies between these environmental metrics, the project aims to foster a more holistic and collaborative approach to addressing sustainability challenges.
What we learned
Through this project, I gained a deeper understanding of the complex systems at play and the cascading effects that can lead to devastating events like the Nairobi floods. The journey has evolved into a broader exploration of the interconnected nature of our environment and the importance of data-driven solutions to drive meaningful change towards a more sustainable future.
What's next for Sustainability Index
Moving forward, I am committed to expanding the reach of this project, collaborating with diverse stakeholders, and continuously refining the tools and insights to drive meaningful change towards a more sustainable future. By empowering decision-makers and the public with data-driven knowledge, we can work together to address the pressing environmental challenges we face and build a more resilient and sustainable world.
Built With
- google-earth
- numpy
- plotly
- python
- streamlit


Log in or sign up for Devpost to join the conversation.