-
-
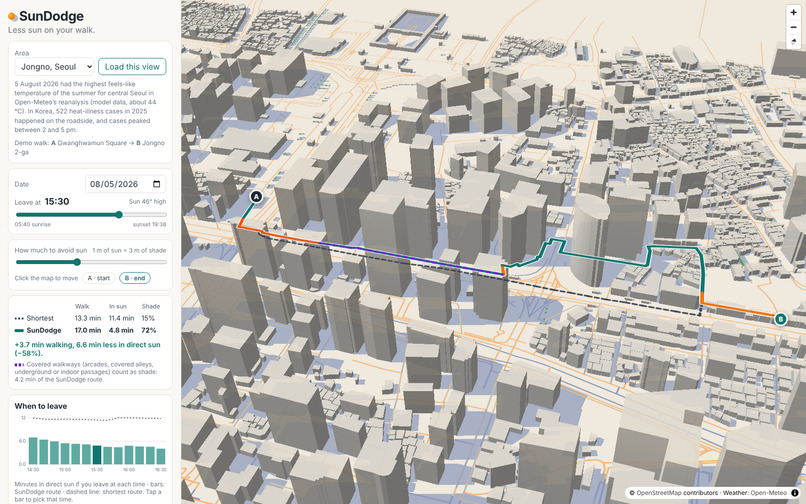
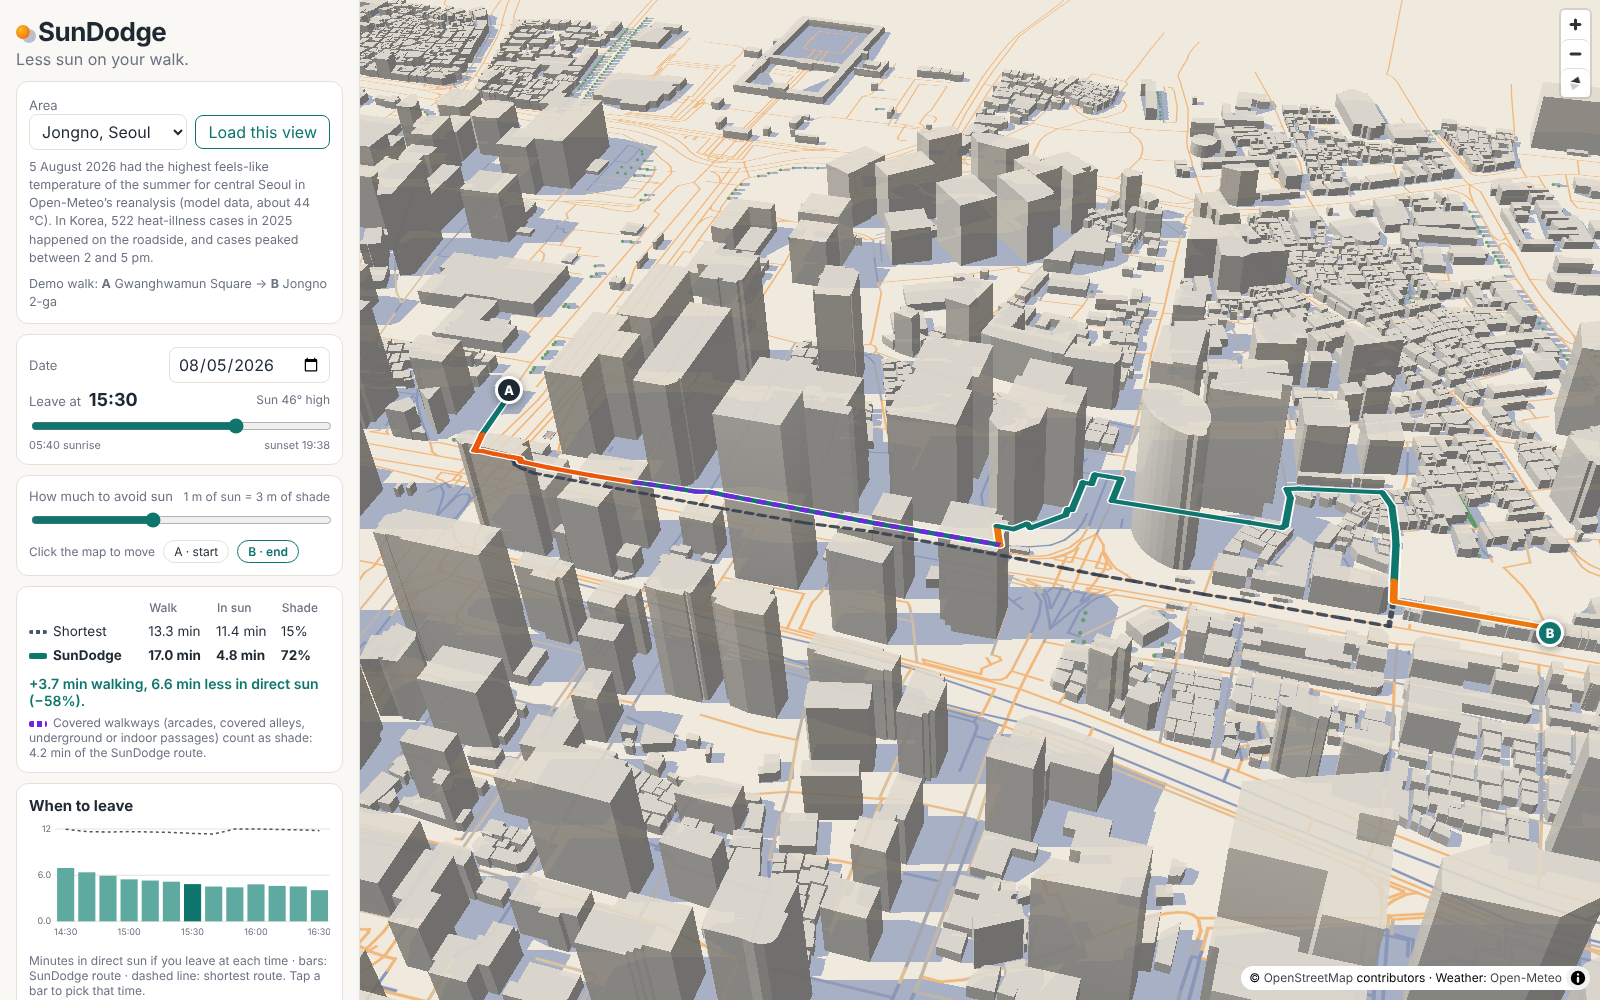
Jongno, Seoul, 5 August 2026 at 15:30: the route uses Pimatgol, a covered historic alley (purple), 11.4 to 4.8 min in sun.
-
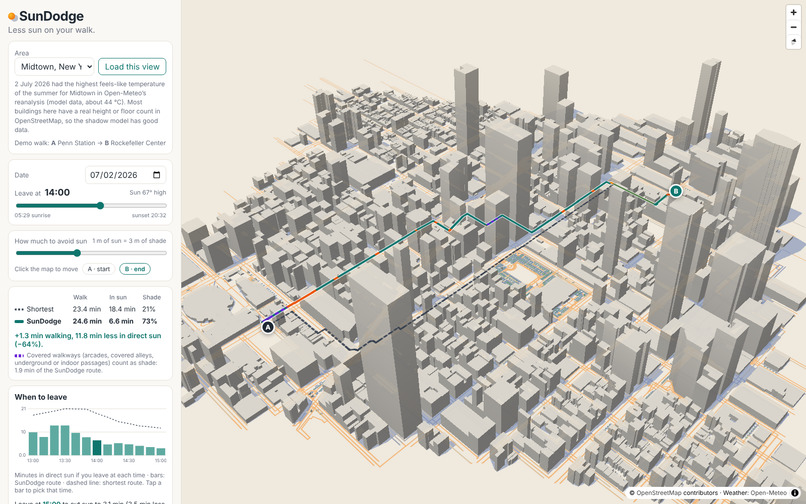
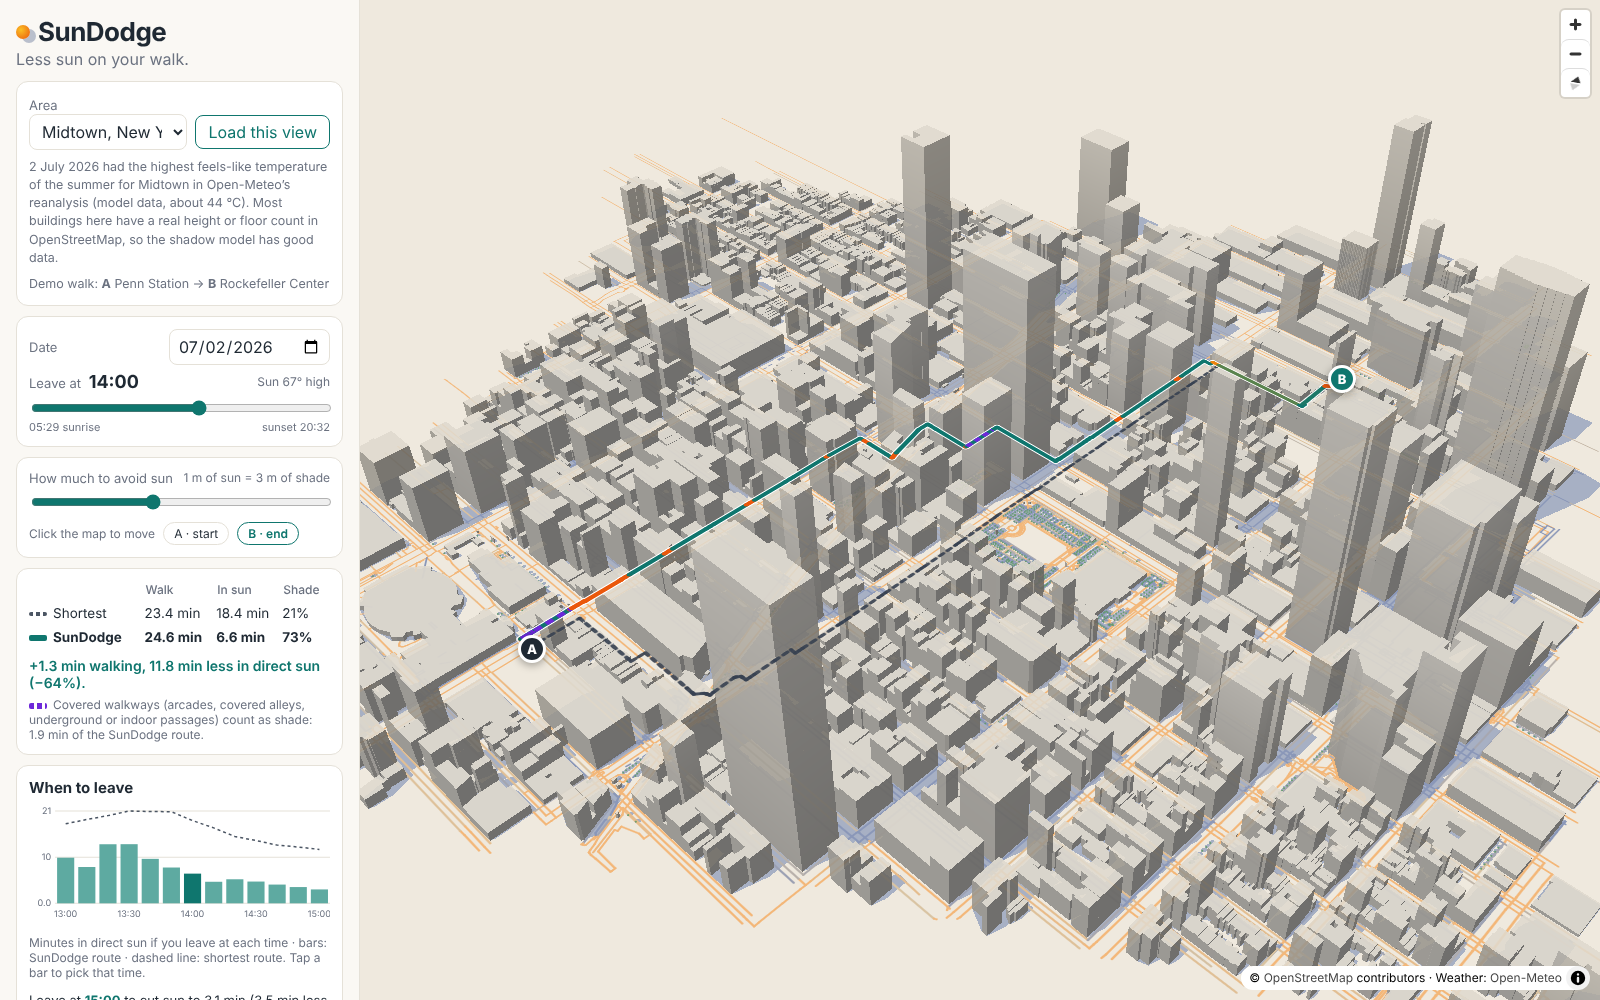
Midtown, New York, 2 July 2026 at 14:00: the SunDodge route (teal) vs the shortest route (dashed), 18.4 to 6.6 min in direct sun.
Inspiration
Summer heat is getting more dangerous, and much of it is met on foot, outdoors, in the afternoon.
- Worldwide. WHO, reporting the 2025 Lancet Countdown: the heat-related death rate has risen 23% since the 1990s. That is an average of about 546,000 deaths a year (2012–2021).
- In Korea. Emergency departments recorded 4,460 heat-illness cases in 2025. 79.2% happened outdoors, 522 of them on the roadside. 30% of patients were 65 or older. Cases clustered between 2 and 5 pm.
Shade matters more than the forecast suggests. In Tempe, Arizona, on clear days, shade from buildings and other structures cut mean radiant temperature by about 20–31 °C, while the air temperature differed by less than 1.3 °C (Middel et al., 2021). Mean radiant temperature is the radiant heat load on a person.
Mainstream navigation apps route by distance or time. A few new apps and research tools route by shade. The goal of this project is an open version that anyone can run, check and take to their own city: a map that shows how much sun a walk puts on you and finds a way with less of it.
What it does
- Two routes, compared. SunDodge finds the shortest route and a SunDodge route that trades a little distance for less direct sun.
- For each you see walking time, minutes in direct sun and the share of the walk in shade.
- On the map, the SunDodge route is teal in shade, amber when partly sunny and orange in sun. The shortest route is dashed.
- Covered walkways, shown openly. Arcades, covered alleys, building passages and underground passages count as shade.
- They are drawn in dashed purple.
- The results say how many minutes of the route use them.
- Moving shadows. 3D buildings and mapped trees cast shadows that move with the time slider.
- Your trade-off. "1 m of sun = 3 m of shade" means the route will walk up to 3 m further to avoid 1 m of sun. This is the α parameter of the CoolWalks model.
- When to leave (secondary). Both routes are recomputed for every 10-minute departure, one hour either side, and charted.
- If timing makes less than a minute of difference, the app says the route matters more.
- Example: in Midtown on 2 July 2026, leaving at 15:00 instead of 14:00 cuts the demo walk's sun from 6.6 to 3.1 minutes.
- Honest data. It shows what share of building heights comes from OSM tags, and can colour buildings by data quality.
- Weather. Hourly feels-like and air temperature and direct radiation from Open-Meteo (reanalysis for past dates).
- Areas. Jongno (Seoul) and Midtown (New York) are pre-cached. "Go to another city…" or "My location" moves the map, and "Load this view" fetches that area (up to 2.5 km²) in the place's own time zone. Tested live in London, Tempe and Daejeon.
How I built it
- Stack. TypeScript, React and Vite.
- MapLibre GL JS draws the 3D map straight from OSM features, with no base-map tiles.
- SunCalc gives the sun position, Flatbush the spatial index and Vitest the tests.
- Everything runs in a Web Worker.
- Shadows. This is standard shadow-ray casting, reduced to 2-D segment queries.
- On flat ground, a point P is shaded when the ray from P toward the sun passes through a building.
- For height h, the ray is under the roof for the first L = h / tan(altitude) metres. So P is shaded when the segment from P toward the sun, of length L, touches the footprint.
- It is exact for that model (straight-sided buildings, concave footprints included) and needs no polygon unions.
- Raised parts (
min_height) only block the part of the segment between their underside and top. - Trees are canopy discs between a base and a top height.
- Routing. Every walkway is sampled every 4 m. Dijkstra minimises shade metres + α × sun metres, with shadows at the middle of the walk.
- Data rules.
- Underground buildings (subway stations) cast no shadow.
- Road tunnels are not walkable unless pedestrians are allowed or the street runs under a mapped building.
- Covered and below-ground footways count as shade.
- Checks.
- 23 unit tests.
- Sun positions match NREL's Solar Position Algorithm within 0.13° in the test cases.
- A seeded evaluation on 200 random walks per area (
npm run evaluate).
Results
Median results for 200 random walks per area (0.5–1.5 km, leaving at 15:00). These are model output on OSM data.
| Area | Shortest route: min in sun | SunDodge route: min in sun | Sun saved | Extra walking |
|---|---|---|---|---|
| Midtown, New York, 2 Jul 2026 | 4.9 | 1.2 | 3.6 min (73%) | 0.4 min |
| Jongno, Seoul, 5 Aug 2026 | 10.3 | 7.8 | 2.1 min (21%) | 0.8 min |
What the numbers mean:
- Seoul gains less. Only 13% of its building heights are tagged in OSM (90% in Midtown), and its streets are irregular.
- Timing gains are small. The best departure within an hour saves a median of 0.6 min. The route matters more.
- The demo walks are chosen to illustrate, and are better than typical.
- Penn Station → Rockefeller Center at 14:00: 18.4 → 6.6 min of sun (−64%) for 1.3 min more walking, including 1.9 min on covered ways.
- Gwanghwamun → Jongno 2-ga at 15:30: 11.4 → 4.8 min (−58%), including 4.2 min in Pimatgol, a covered historic alley.
Challenges I ran into
- An AI review found real bugs. Before submitting, I had an AI "red team" attack the project, then checked each claim against OSM and the sources. It found:
- Three subway stations in the New York data drawn as 12 m buildings over Times Square and Park Avenue. My first trimming step had dropped the
layerandlocationtags. - Car tunnels counted as walkable, fully shaded paths.
- Areas loaded live used the viewer's time zone instead of the place's.
- Wrong claims in my first draft: "map apps never consider the sun" and "nobody suggests when to leave" were not true, and a statistic was misattributed.
- Three subway stations in the New York data drawn as 12 m buildings over Times Square and Park Avenue. My first trimming step had dropped the
I fixed all of these. I restored the tags with a tags-only Overpass query, added tunnel and underground rules, added a time-zone lookup, and rewrote the claims.
- Missing building heights. Only 13% of buildings in the Jongno area have a height or floor count in OSM (90% in Midtown). Instead of hiding this, the app shows it.
- Respecting free services. The Overpass API is volunteer-run. The demo areas are pre-cached, and live loading is one confirmed request at a time with a cooldown.
- Recording the demo. The 3D map rendered slowly in a software-only browser, and normal screen recording dropped frames. The video is captured on a virtual clock instead: one frame is taken after each computation finishes.
Accomplishments that I'm proud of
- A shade router that runs entirely in the browser with no backend of its own, and can load any OSM area of up to 2.5 km².
- Data-quality transparency and a reproducible evaluation, including where SunDodge does not help much.
- An exact (for its model) and simple shadow test, backed by tests.
What I learned
- Radiant heat, not air temperature, is what makes a sunny street harsh.
- Open data is powerful but uneven: one missing tag can put a phantom building over Times Square.
- Measuring typical results is more honest, and more useful, than showing the best example.
What's next
- Building heights for Korea from the official building register.
- Sampling sidewalks at the building line instead of the road centre line.
- Shadows that move during the walk (time-dependent routing).
- A school-commute mode that suggests the least-sun routes for a school's catchment.
How this was built (AI use)
I built SunDodge with heavy help from Claude (Anthropic), an AI assistant.
- What Claude did.
- Suggested three project ideas; I chose this one.
- Wrote most of the code, the tests, the README and this text.
- Made the demo video: recording, script and editing. The narration is AI text-to-speech (Kokoro-82M).
- Ran the AI review described above.
- What I did.
- Chose the contest and the topic.
- Made the direction decisions, such as the name, what to claim and which fixes to make.
- Reviewed the results and tested the app.
Related work
그늘로 (Seoul), ShadePath, inShade, Shade Walker (NYC), Shade Walk CS (Texas A&M), HeiGIT heat-avoiding routing, ASU Cool Routes, Cool Walks (Barcelona) and the CoolWalks model. The comparison is in the README.
SunDodge was called ShadeWalk while it was being built and was renamed because other projects use that name.
References
See the README for the full list. The main sources:
- WHO news release on the 2025 Lancet Countdown, 29 Oct 2025
- Newsis, 14 May 2026, on KDCA heat-illness surveillance for 2025
- Middel et al. 2021, BAMS 102(9)
- Wolf, Vierø, Szell, CoolWalks, arXiv:2405.01225
Links
- Live demo: https://abccba100.github.io/sundodge/
- Code: https://github.com/abccba100/sundodge
- Demo video: https://youtu.be/2Zje41upTZE
Built With
- flatbush
- github
- maplibre-gl
- open-meteo
- openstreetmap
- overpass-api
- react
- suncalc
- typescript
- vite
- vitest
- web-workers

Log in or sign up for Devpost to join the conversation.