-
-

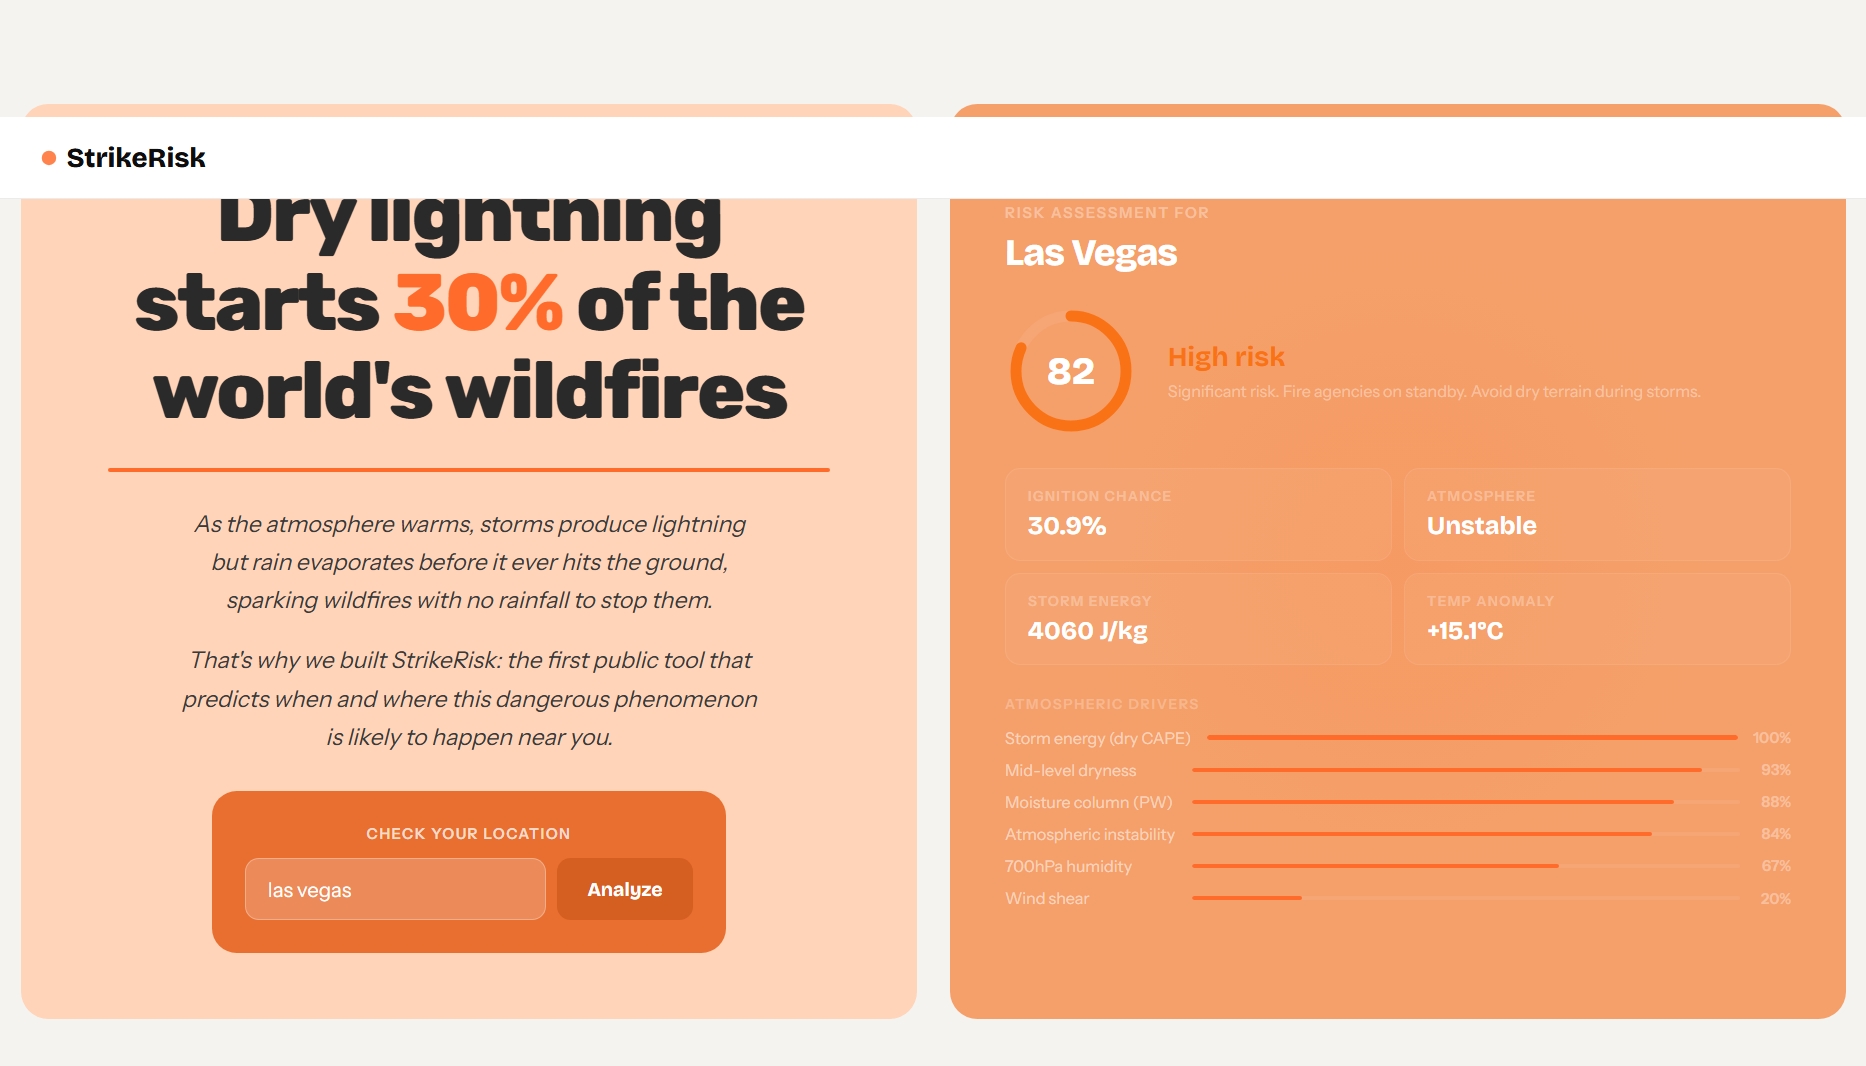
StrikeRisk Landing - Las Vegas (Results)
-
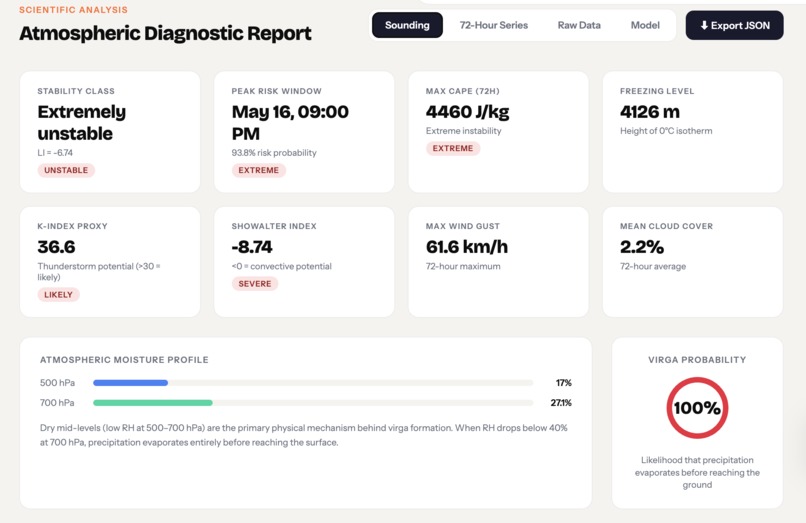
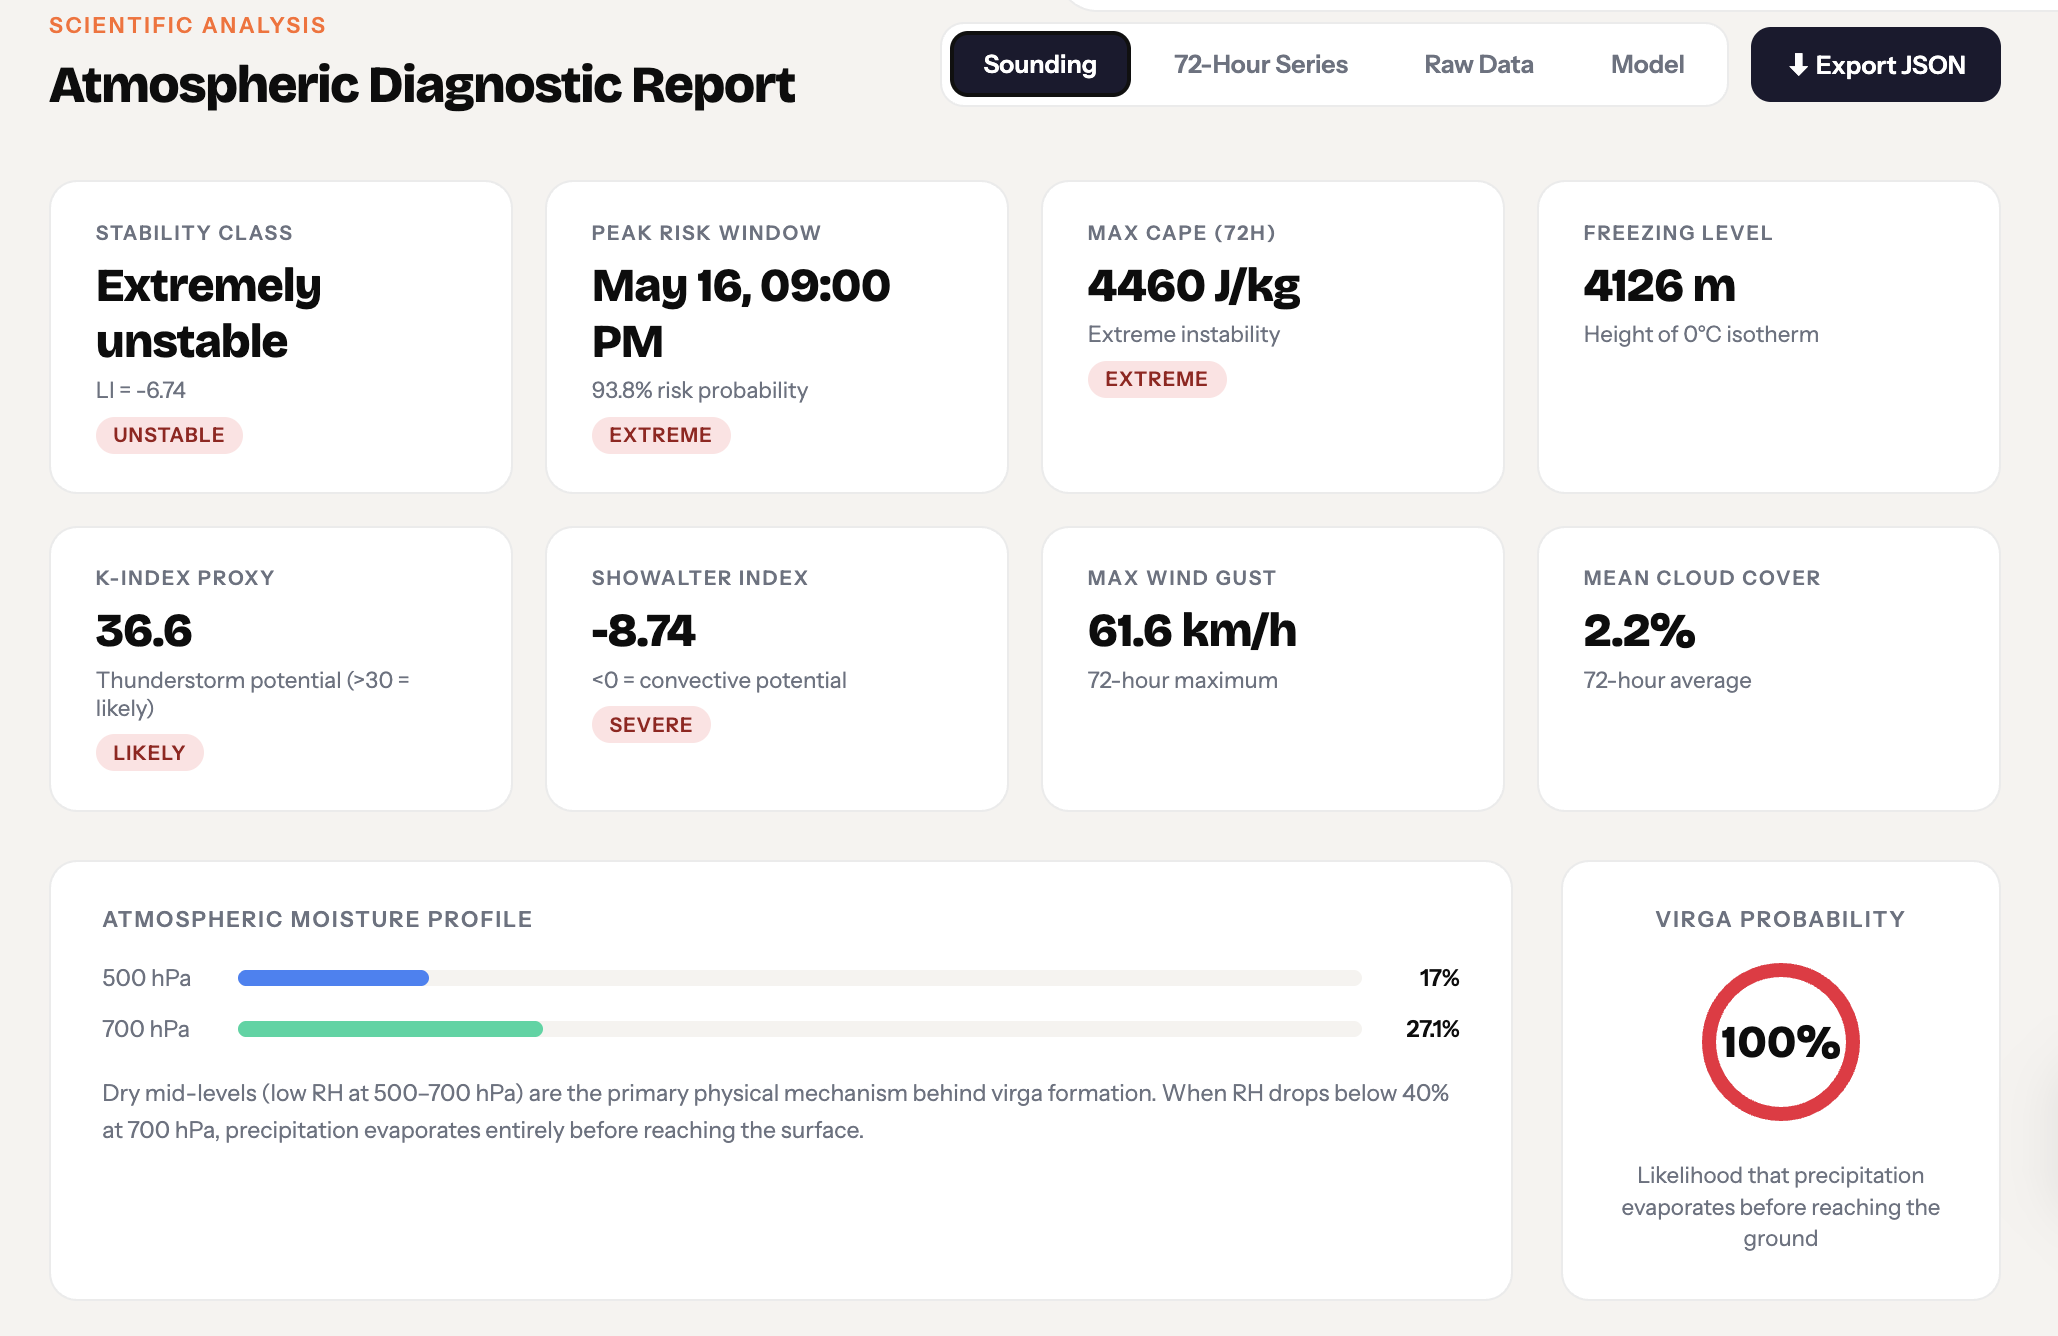
StrikeRisk Diagnostic Report 1 - Las Vegas
-
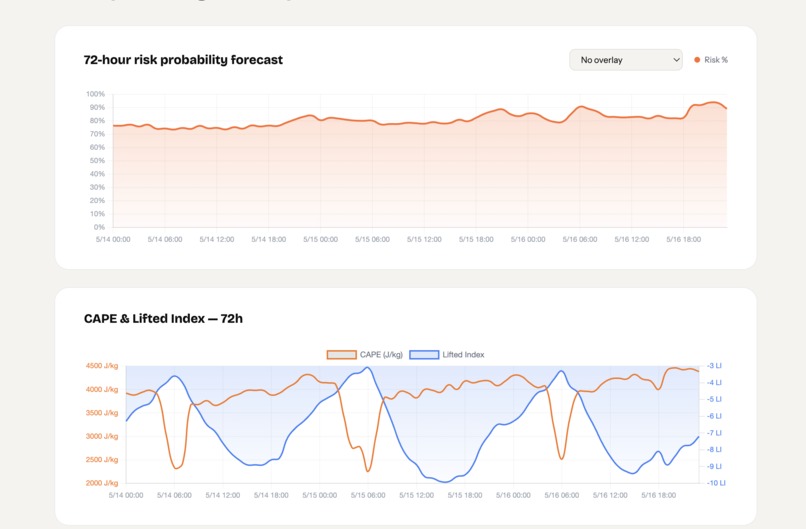
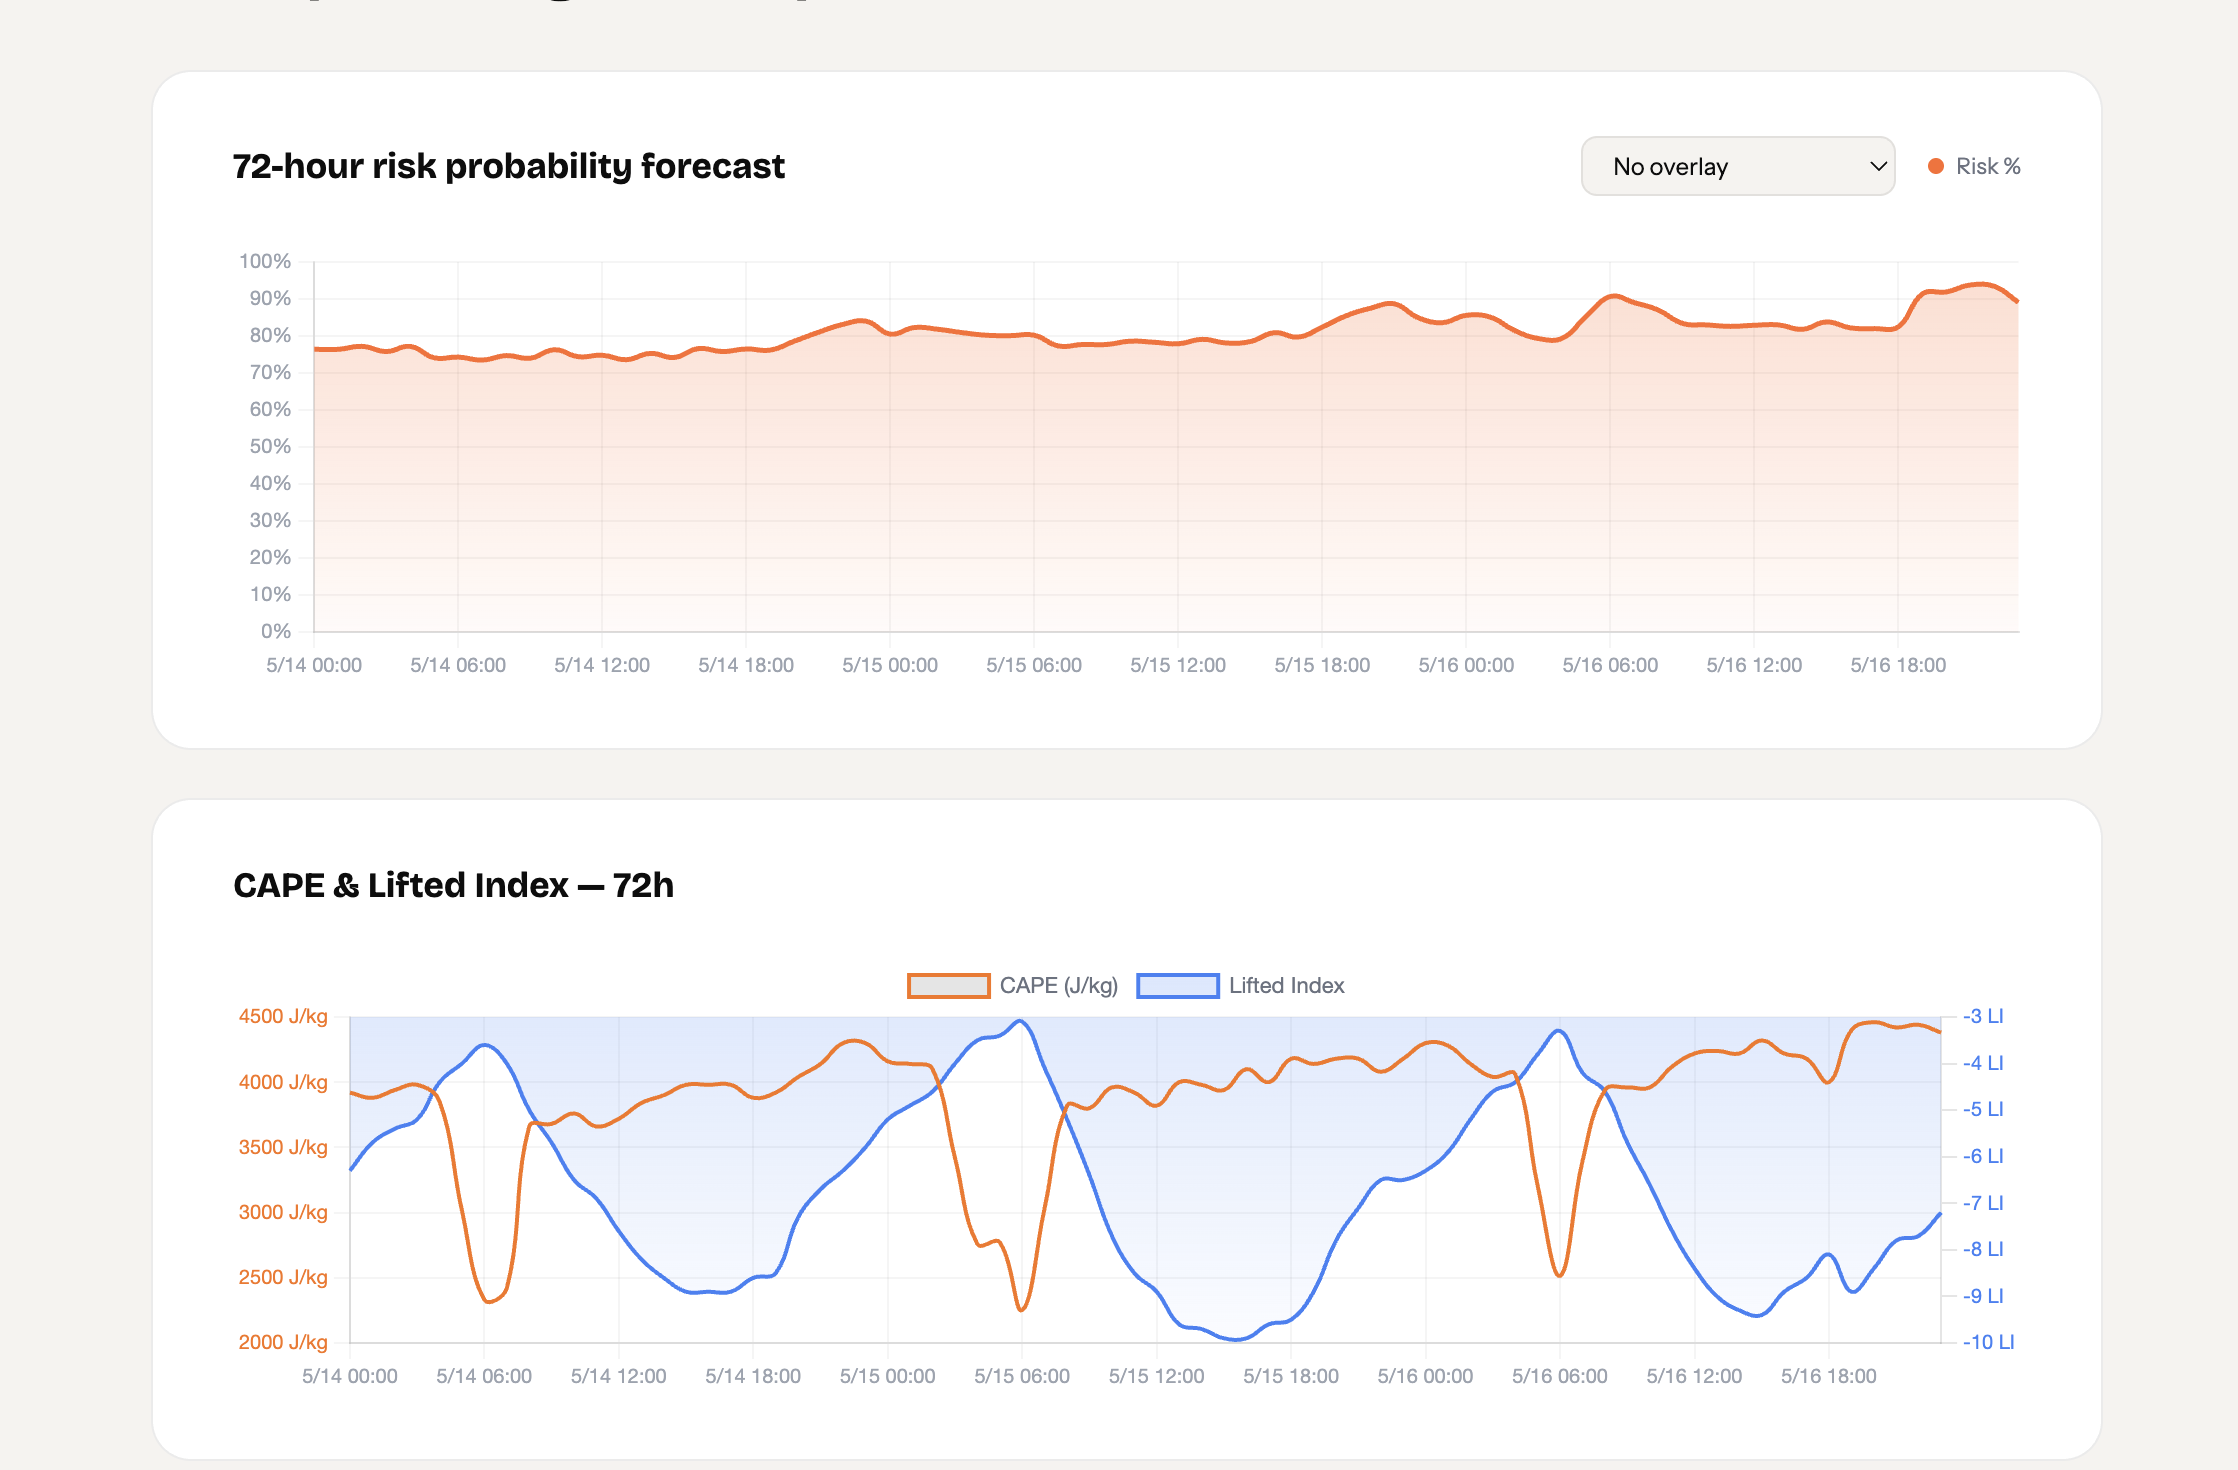
StrikeRisk Diagnostic Report 2 - Las Vegas
-
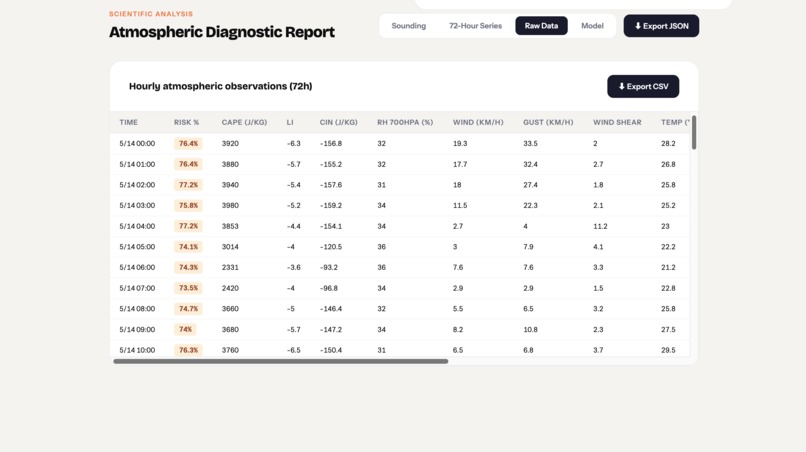
StrikeRisk Diagnostic Report 3 - Las Vegas
-
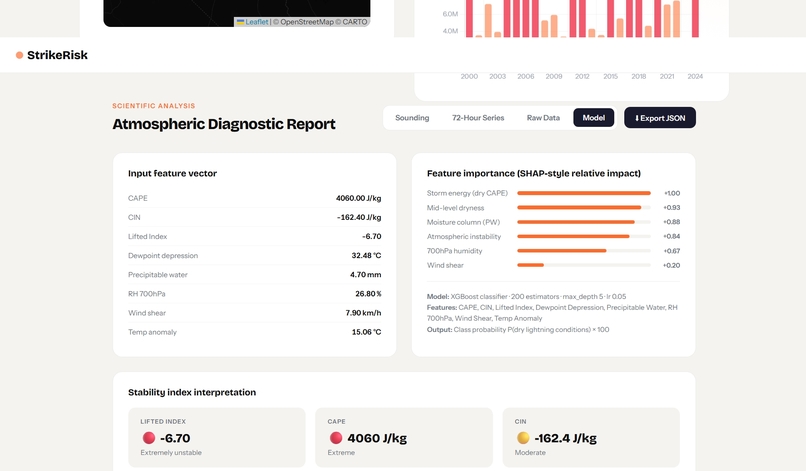
StrikeRisk Diagnostic Report 4 - Las Vegas
-
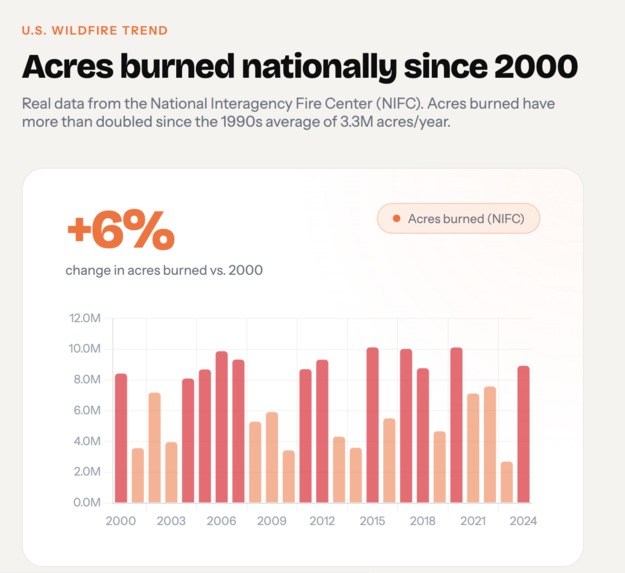
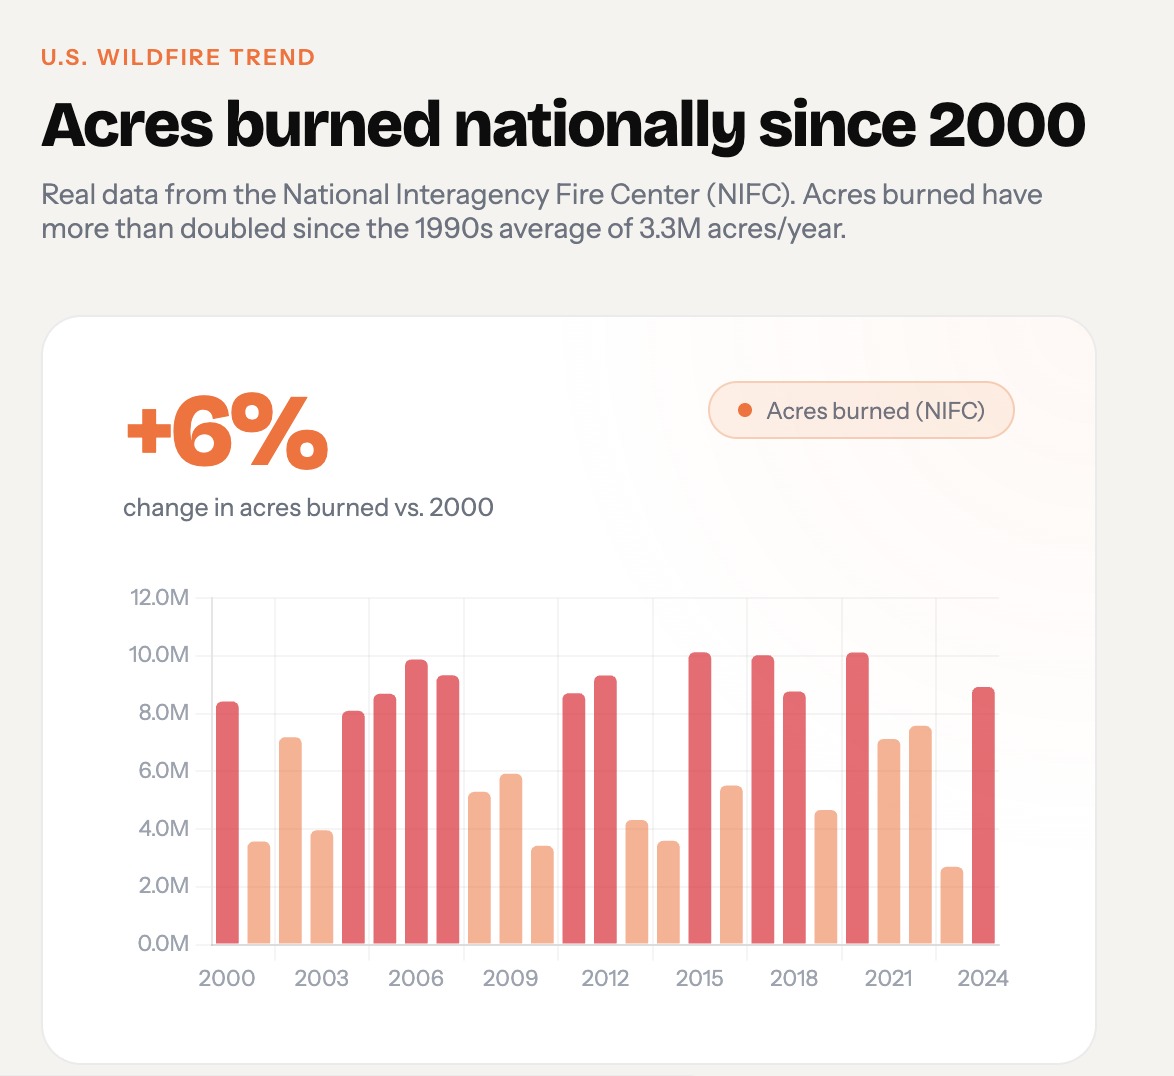
StrikeRisk Wildfire Trend Chart - Las Vegas
StrikeRisk
Inspiration
One day, we were doomscrolling on our phones. Then we stumbled onto something that changed us forever. We saw a story about someone in their house, surrounded by fire, helpless. When we investigated further, we saw that it was caused by a wildfire. Specifically, one caused by dry lightning. The weird thing was that when we looked at Google out of curiosity, we saw absolutely nothing to predict dry lightning, and more specifically, the ignition risk associated with it. Over 10,000 wildfires have started within the last 10 years because of dry lightning. We couldn’t believe that it wasn’t being tracked. That’s why we made StrikeRisk.
What it does
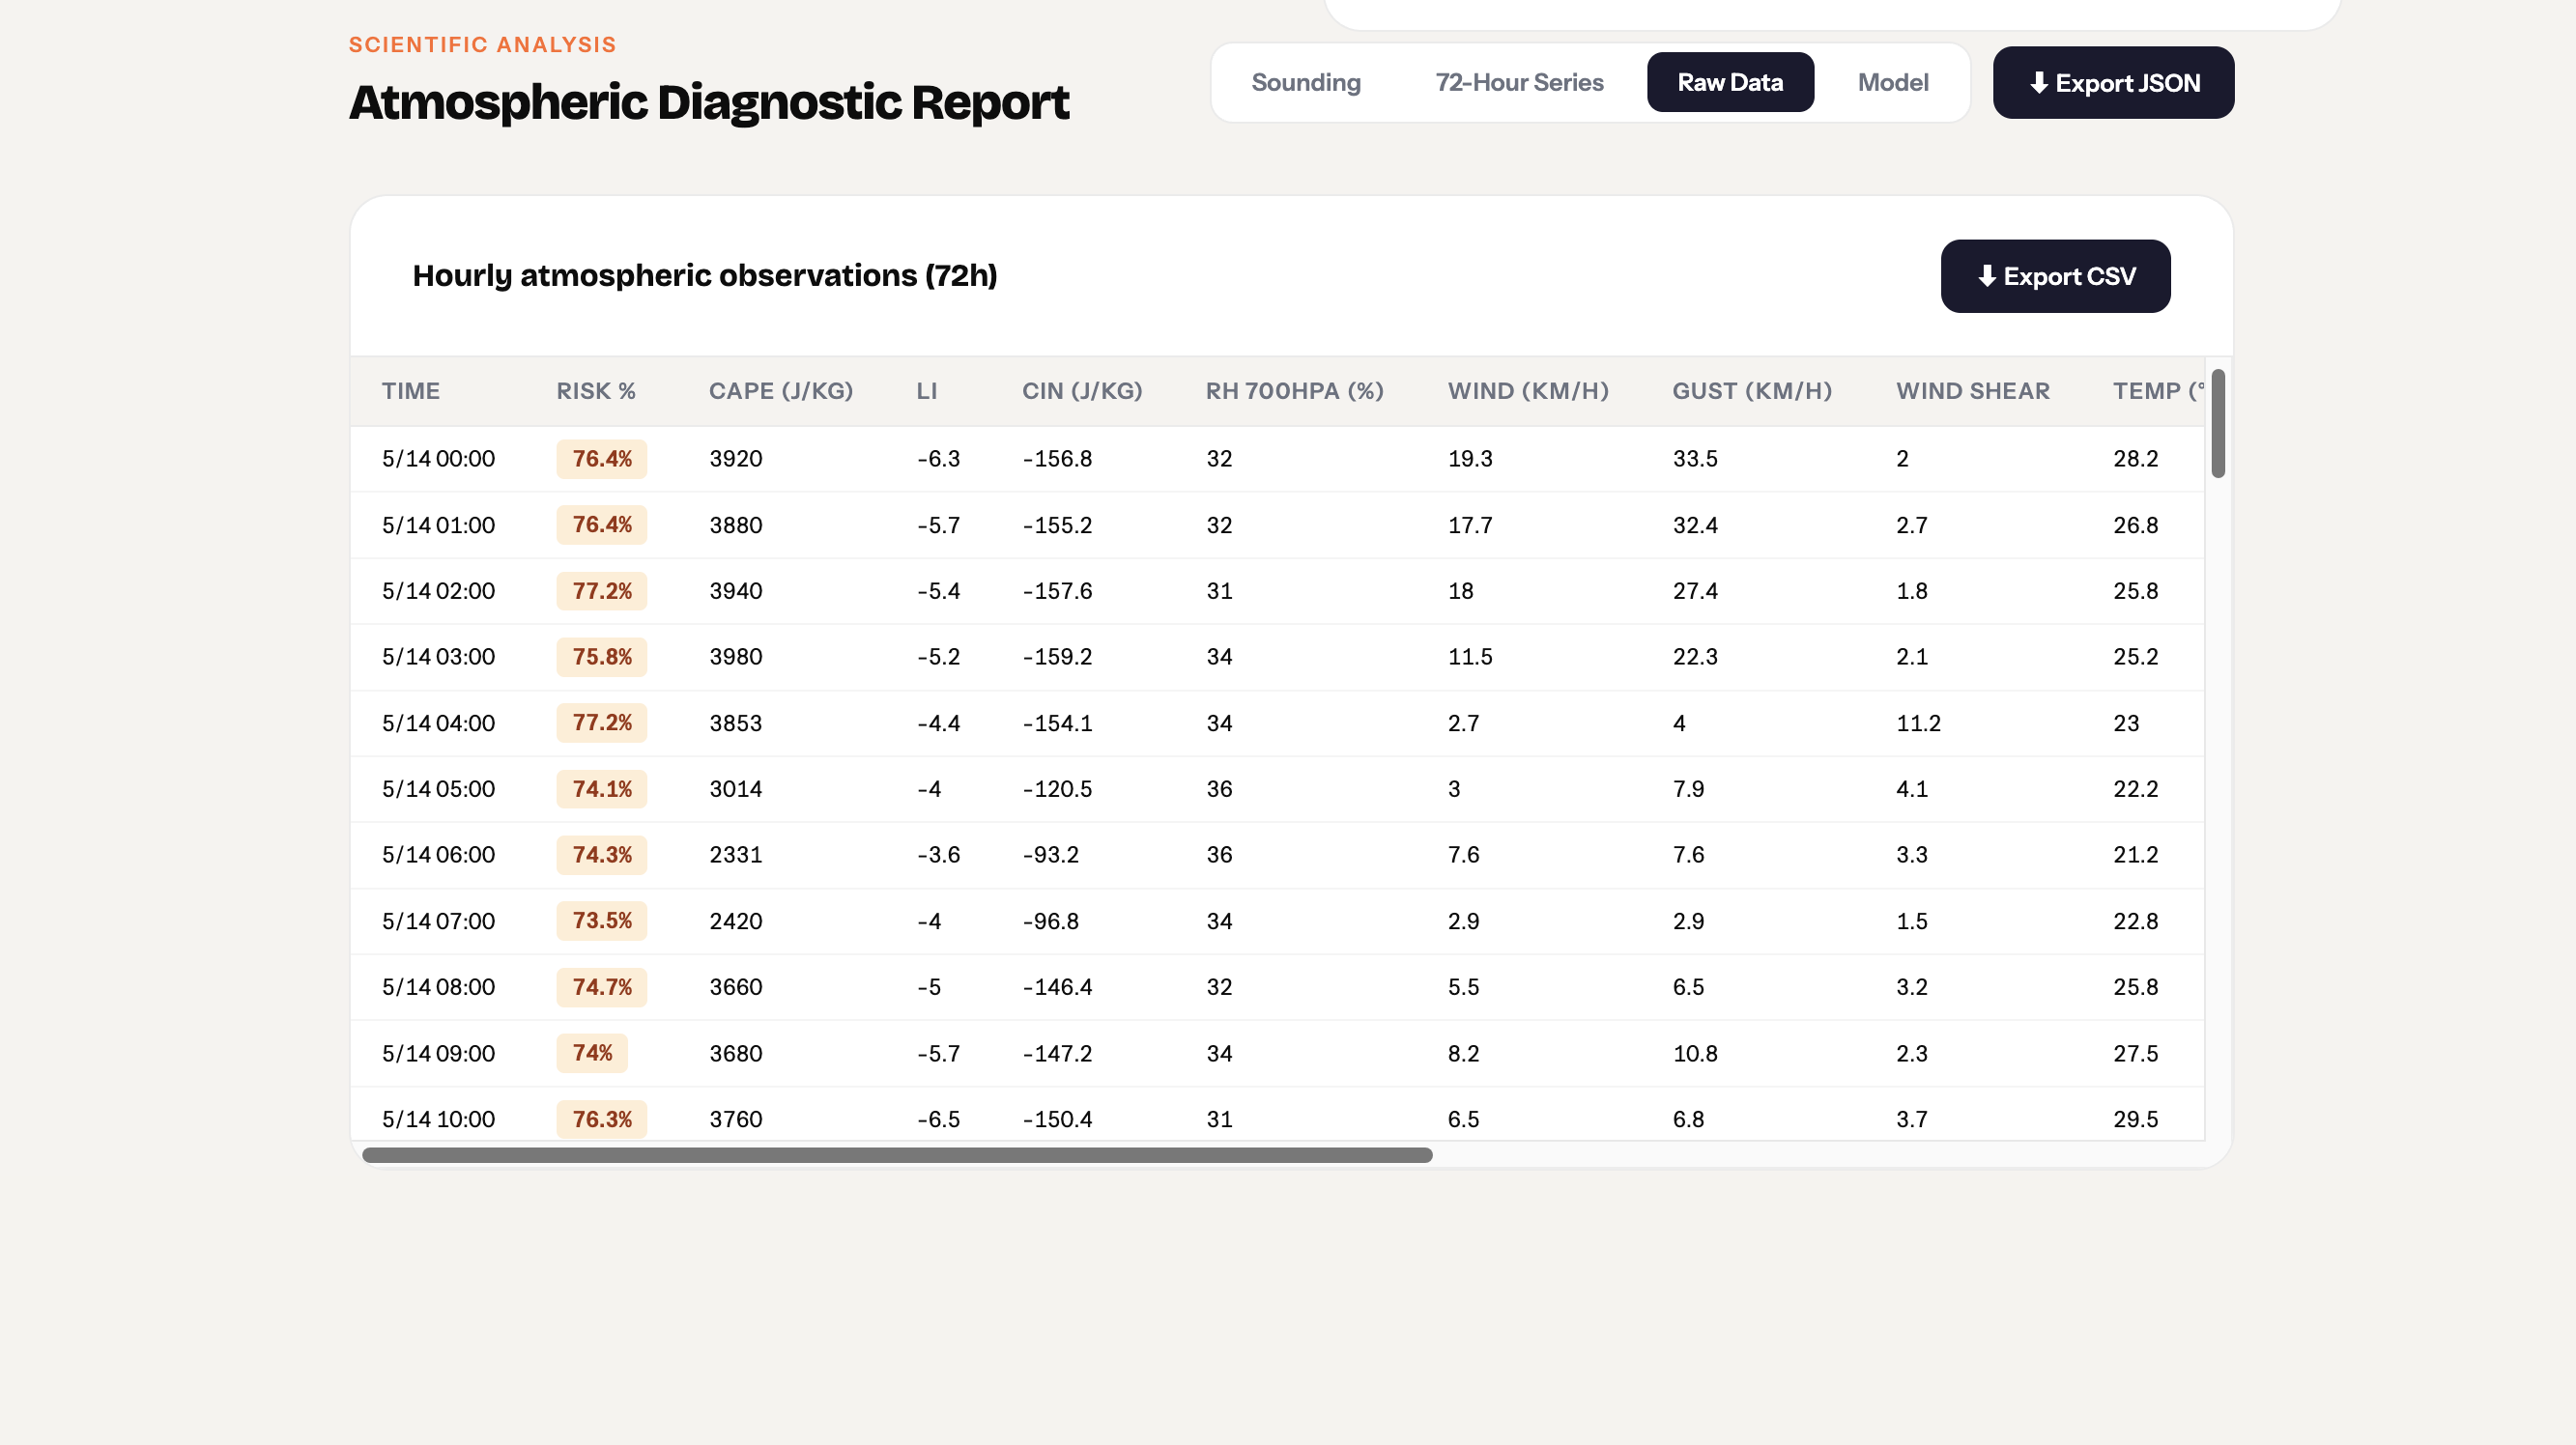
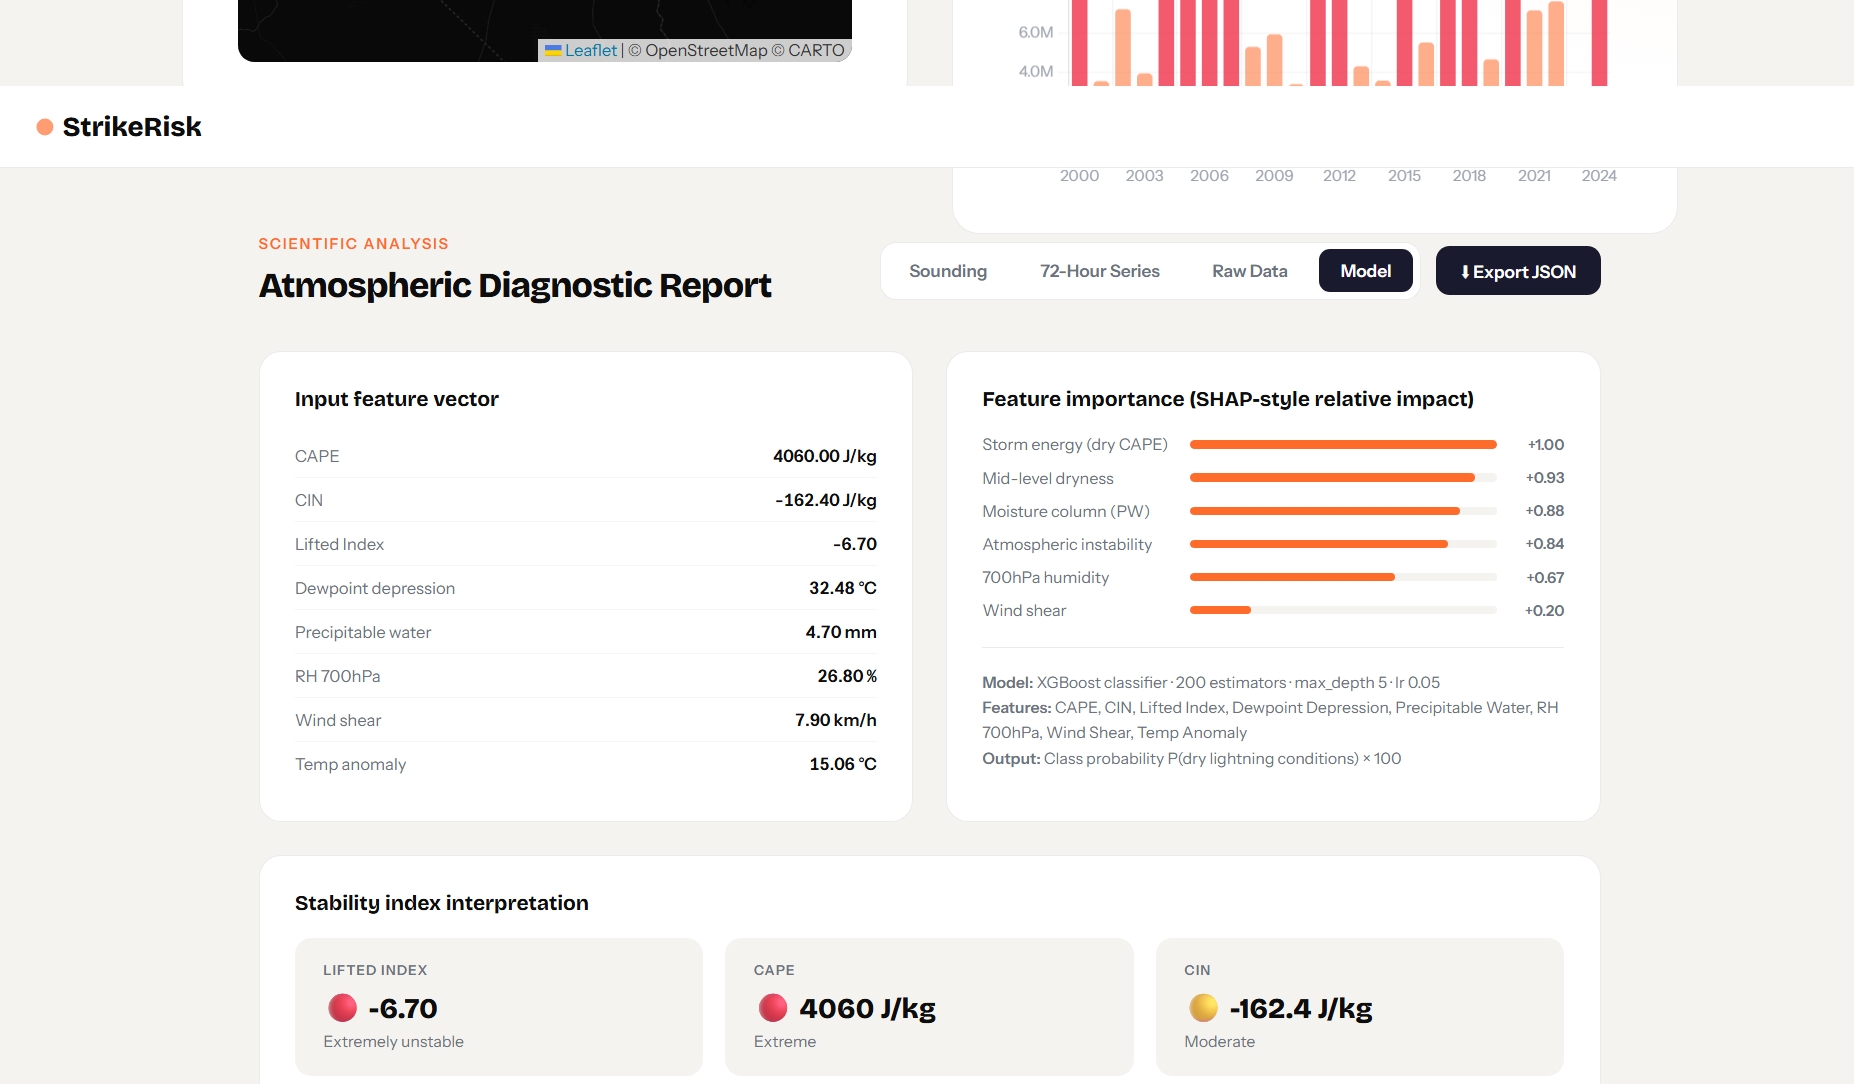
Once the user enters a city name, we pull live atmospheric data from OpenMeteo’s forecast and historical archive APIs. The XGRBoost Regressor Model uses this data to create the dry lightning ignition risk from now to 3 days in the future. Strike Risk’s machine learning model also identifies key data, including the atmospheric risk score, the atmospheric factors driving the risk, virga likelihood, and an hourly breakdown of conditions.
How we built it
Using Open-Meteo, we pulled 7 days of hourly weather data across 50 cities worldwide. For each hour, we got 9 features, including moisture-penalized CAPE, dewpoint depression, 700 hPa humidity, precipitable water, and others.
We then made a scoring formula. Dry lightning had two things in our code to be likely. The atmosphere was unstable, and the air column was dry. We made this formula multiplicative instead of additive, so if either wasn’t met, the score dropped regardless of the other one. It completely changed our model.
We then used this to train an XGRBoost model on the continuous score rather than using a binary 0 or 100. The XGRBoost model was trained on almost 50K data points. The model outputs a continuous probability distribution, which we scale using a fuel dryness factor computed from recent rainfall, soil moisture, and surface humidity. What results is ignition probability.
The backend uses Flask, and the frontend is vanilla HTML, CSS, and JS. We used OpenStreetMap to show the user where their location was as well.
Challenges we ran into
The first version of the model was a classifier trained on binary labels, and it was basically useless. It learned the threshold and predicted almost everything as either 3% or 100%. On a normal day in spring, Charlotte, NC, was at 85% risk. Phoenix in December was 100%. The model was learning about aridity rather than dry lightning risk.
We had to scrap the entire labeling approach. The original scoring formula was additive, meaning that cities that are generally dry scored high on almost every term, even when conditions weren’t actually dangerous. Switching to a multiplicative formula and training a regressor on the raw continuous score, rather than a binary label, fixed both problems at once. After that, some of the driest lightning-prone cities, like Phoenix, AZ, and Las Vegas, NV, were at 78% and 82%, respectively, and some of the least dry lightning-prone cities, like Juneau, AK, and Burlington, VT, came back at 3% and 4%, respectively. That is what the outputs should look like.
Accomplishments that we're proud of
We’re very proud of getting mid-range predictions and accurate ones at that. It took us almost 7 hours of debugging and innovation to make training data and formulas that would make predictions accurate. It’s easy to identify a city as either high- or low-risk, but it's extremely hard to get it right in the middle.
We’re also proud of being the first to make a reliable dry lightning predictor, which also predicts wildfire risk. We believe this could save lives in the future if used correctly.
We’re also proud to make this accessible to scientists, who can access advanced data and learn what’s happening behind the scenes.
What we learned
We learned
- That binary classification does not provide good or accurate data for risk classification. Wildfire and dry lightning risks are continuous, so the training target should be continuous as well. Making it go into labels throws away all the useful signals in the middle.
- The subtle flaw in additive scoring formulas. Each factor can look perfect to the human eye, but when summed, you really only get a model that’s just measuring random things with complicated steps.
- How powerful XGRBoost models are in predicting accurate real-world scenarios when fed with real-world training data.
What's next
Open-Meteo has historical data going back to 1940. Retraining on that and validating against actual NIFC ignition records would make the model much more defensible. We'd also like to add real-time active-fire overlays, push alerts for monitored locations, and regional calibration, since the thresholds that matter in the Carolinas differ from those in the Great Basin.
RENDER MIGHT TAKE AN UPWARDS OF 5 minutes TO LOAD
Last 3 Digits Of Code For WeatherWise
0V1
MADE FOR WEATHERWISE HACK 2026
Built With
- css3
- flask
- html5
- javascript
- open-meteo
- open-meteo-forecast
- openmeteo
- openstreetmap
- python
- xgrboost

Log in or sign up for Devpost to join the conversation.