Inspiration
OneAquaHealth asks whether healthier urban streams contribute to healthier people. The current citizen-science workflow can describe a stream, but it does not create a paired, visit-level record of the stream's condition and the visitor's well-being before and after being there. That makes the human side of the One Health hypothesis hard to measure.
There is a second problem: citizen science depends disproportionately on people who return. Across seven large citizen-science projects, only about 27% of volunteers returned for a second session, while returning volunteers produced 85% of all contributions (Sauermann & Franzoni, PNAS 2015).
StreamWell connects those two problems. Instead of adding points for their own sake, it gives every volunteer a useful personal answer: which streams actually restore me? The same mechanism that makes participation worth repeating also creates the missing paired dataset for OneAquaHealth.
What it does
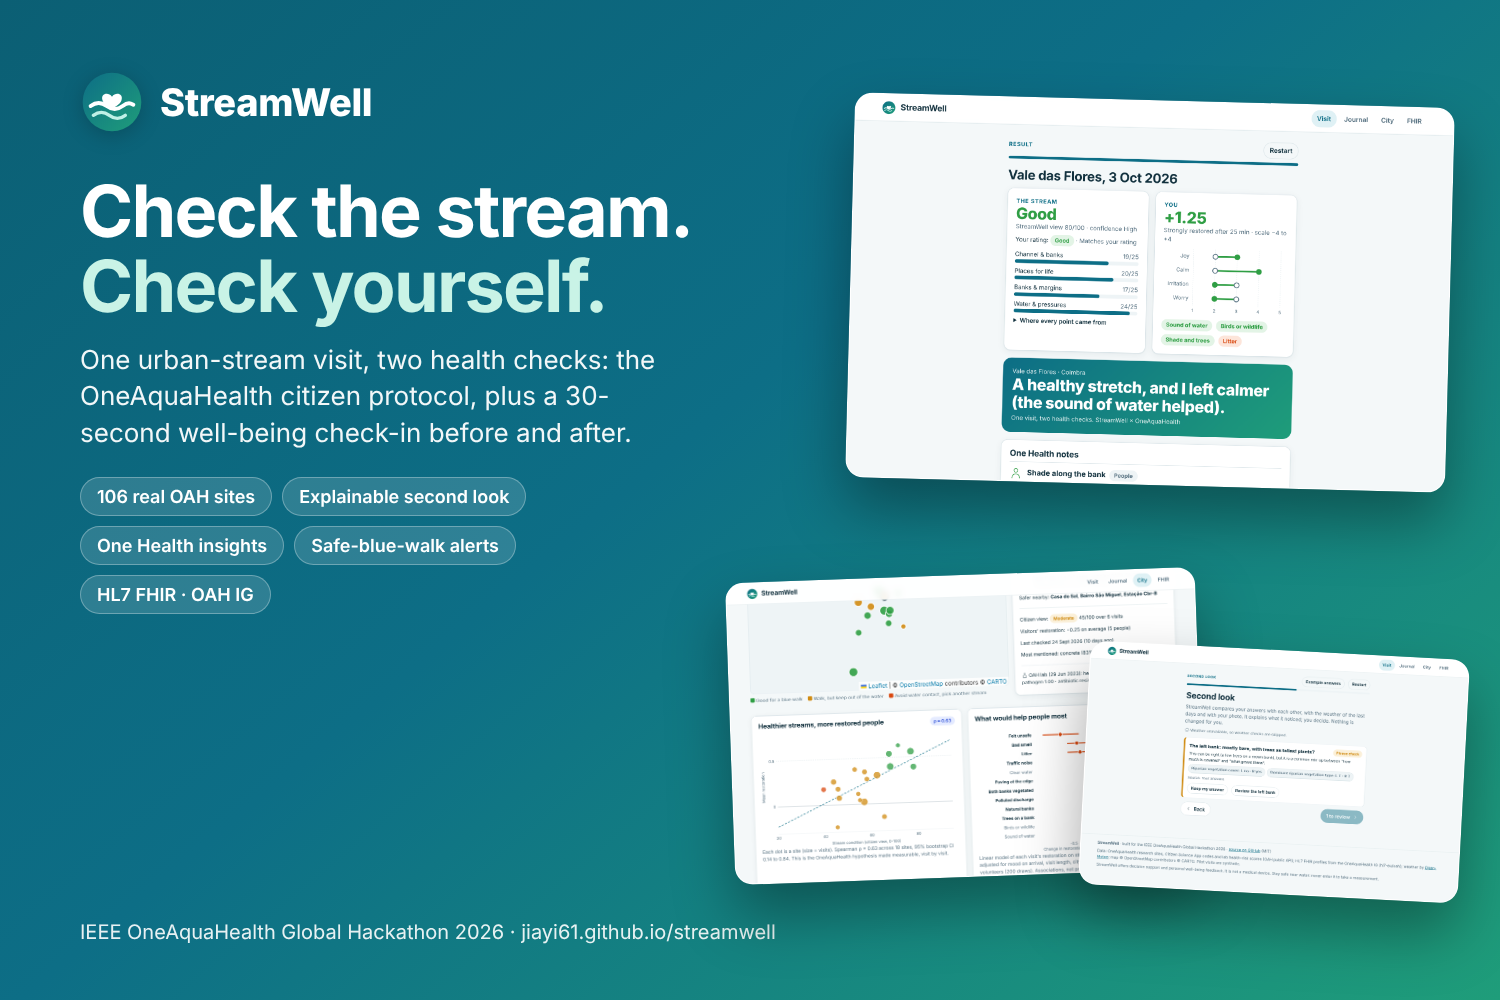
A StreamWell visit adds about one minute around the existing OAH stream assessment:
- Check in — 30 seconds. Before looking closely, rate joy, calm, irritation and worry — the same four feelings already present in the OAH Citizen Science App.
- Check the stream — about 4 minutes. The OAH citizen protocol and answer codes, rewritten in plain language with pictograms, the scientific term underneath and an honest "not sure."
- Second look — about 30 seconds. Transparent checks compare answers with each other, recent Open-Meteo weather and an optional on-device photo colour check. Every flag shows what it noticed, why it matters and which inputs it used. The volunteer decides; nothing is silently changed.
- Check out — 30 seconds. The same four feelings again, plus what shaped the experience: water sound, wildlife, litter, smell, feeling unsafe and more.
- Result. Stream condition and restoration change appear side by side, with One Health notes for ecosystem, animals and people and a clear choice about what to share.
What the volunteer gets
A private journal shows which streams restore them most, with intervals that say when a pattern is still unclear. Streaks, adopted streams and missions to sites that have not been checked recently provide a reason to return without turning ecological monitoring into a points game.
What OAH researchers and cities get
The dashboard uses all 106 real OAH research sites and 96 real OAH lab health-risk scores. It can:
- compare citizen condition with lab risk;
- measure the stream-condition / restoration relationship;
- estimate which visit and stream features are associated with the largest well-being changes;
- turn those drivers into concrete actions such as removing litter, improving lighting or planting riparian trees;
- show live storm and heat scenarios and safer nearby alternatives.
The demo visits are synthetic because no paired stream + before/after well-being dataset exists yet. They are seeded, documented and labelled as synthetic everywhere. Creating the real paired dataset is the purpose of StreamWell.
What health systems get
Stream observations use the OneAquaHealth HL7 FHIR R4 Implementation Guide. Personal well-being stays on the volunteer's device unless they opt in. Research receives only site/month aggregates with at least five distinct visitors. A blue-prescription example shows how a GP could prescribe stream walks with a FHIR CarePlan and follow WHO-5 outcomes if the patient chooses to share them.
Why it is different
1. It measures the missing link, not just another water score.
Most stream tools stop at ecosystem condition or risk. StreamWell pairs that observation with a within-person before/after well-being change at the same visit.
2. Engagement and research value reinforce each other.
The personal insight is the retention mechanism. More repeat visits mean denser ecological data and stronger within-person evidence about human well-being.
3. It is deliberately honest about uncertainty, and it proves it.
"Not sure" never becomes good or bad, personal patterns show intervals, the city model is labelled associational, simulated data is labelled, and the second look never overwrites a volunteer. Because the pilot data are simulated, the true effects are known: in 200 simulated pilots the model's 95% intervals contained the true effect 89–98% of the time, and a no-effect placebo was flagged in only 4% of pilots.
4. Privacy is part of the data model.
Environmental observations can be shared without personal data; well-being remains personal unless explicitly donated; public/research health measures are k-anonymous aggregates.
Who it is for
- Citizen scientists and residents near urban streams.
- OneAquaHealth researchers and city environment/public-health teams in Coimbra, Toulouse, Ghent, Benevento and Oslo.
- In a later clinical pathway, GPs and social-prescribing link workers.
Expected impact
Impact & OneAquaHealth alignment
- Makes the ecosystem-health ↔ human-well-being hypothesis measurable at the level of a single visit.
- Gives volunteers a concrete reason to return, improving monitoring density and continuity.
- Turns OAH citizen, laboratory and weather data into actions rather than another raw-data dashboard.
- Keeps human, animal and ecosystem consequences visible together.
Feasibility
- Reuses OAH's existing questions, answer codes, research sites and FHIR profiles.
- Adds roughly one minute to the citizen workflow.
- Runs as an offline-first static PWA with no accounts, server or API keys required for the core experience.
- Can ship as a module beside or inside the existing OAH Citizen Science App.
- A simulated power analysis suggests about 240 paired visits (40 volunteers × 6 visits) can detect a 0.25-point feature effect with about 84% power — a plausible one-city summer pilot.
How I built it
- OAH data: 106 research sites, citizen submission schema/answer codes and lab health-risk scores from the OneAquaHealth public APIs.
- Weather: live Open-Meteo forecasts for early-warning scenarios.
- App: plain ES modules, offline PWA, vendored Leaflet, local-first storage and on-device photo processing.
- Analysis: Spearman correlation with bootstrap intervals; visit-level driver model with volunteer-cluster bootstrap; uncertainty intervals for personal insights; k-anonymous health aggregates.
- FHIR: LocationOah, ObservationIndicatorsOah, ObservationHealthMeasureOah, GroupOah, Questionnaire/QuestionnaireResponse, CarePlan, Goal and Consent.
- Validation: example bundles pass StreamWell's OAH-profile structural checks and public base-FHIR R4 HAPI validation with 0 errors.
- Method check: planted-effect recovery over 200 re-simulated pilots with a placebo feature (
scripts/recovery.py). - Accessibility: axe-core WCAG 2.1 A/AA audit of all 20 screens at phone and desktop size; the 32 issues it first found are fixed, 0 remain.
- Quality: 27 unit tests (including deliberately broken FHIR records that must be rejected) plus a headless browser walk-through across the complete flow.
Challenges
- Adding the human half without creating survey fatigue. Reusing the four feelings the OAH app already asks and measuring them twice creates a within-person change score for about one extra minute.
- Improving data quality without pretending a model knows the truth. The second look explains contradictions, weather context and photo cues, but the volunteer remains the decision-maker.
- Working with an evolving standard. Where the OAH IG lacks restorative-experience and visitor-cohort concepts, StreamWell uses the IG wherever possible and documents proposed additions in FSH rather than hiding custom semantics.
- Protecting sensitive data. Well-being is treated as health data: local by default, opt-in for sharing, aggregated before research use.
Accomplishments
- Built an end-to-end product on OAH's own questions, codes, sites, lab data and FHIR IG.
- Turned the project's central ecosystem ↔ human-well-being hypothesis into a concrete paired measurement design.
- Created a working volunteer flow, personal journal, city/research dashboard, scenario-based early warning and FHIR explorer in one deployable PWA.
- Documented which data is real, which is simulated and what each model is allowed to claim.
- Produced reproducible simulation, analysis, FHIR generation, tests and demo tooling in the public repository.
- Showed the analysis is trustworthy before real data arrive: every planted effect recovered with honest intervals, and a no-effect placebo flagged in only 4% of 200 simulated pilots (5% is the expected false-positive rate).
- Passed an automated WCAG 2.1 AA audit on every screen.
- Wrote a pre-registered pilot plan (40 volunteers × 6 visits, 84% power) that an OAH city partner could file before the first visit.
What I learned
The biggest citizen-science engagement problem and the biggest One Health data problem can be the same problem. If a visit gives volunteers a meaningful personal insight, they have a reason to return; those repeated visits are exactly what researchers need to understand how ecosystem condition and human well-being move together.
What's next
Run the pre-registered summer pilot (docs/preregistration.md) with an OAH city partner, including a randomised test of whether the personal journal raises return rates; complete a GDPR data-protection impact assessment; translate the short field UI into Portuguese, French, Dutch, Italian and Norwegian; propose the documented IG additions to HL7 Europe; and replace simulated effect sizes with real paired estimates.
Built With
- axe-core
- css3
- fhir-r4
- github
- hl7-fhir
- html5
- javascript
- leaflet.js
- numpy
- open-meteo
- openstreetmap
- playwright
- pwa
- python


Log in or sign up for Devpost to join the conversation.