Inspiration
Citizen scientists are often the only people looking at urban streams and canals regularly. Through the OneAquaHealth app they report what they see and smell: how murky the water is, whether there's a sewage odour, trash, insects. That data is valuable, but it's also sparse, subjective and noisy. One person's "a bit cloudy" is another person's "murky", and most site-weeks have no report at all.
Most dashboards built on data like this end up doing one of two things: showing raw reports nobody can interpret, or showing confident traffic-light scores the data can't support. We wanted a middle path. Every insight should come with how sure we are, and when there isn't enough evidence the app should say so plainly.
What it does
For site (s) and week (t), each latent score is a site baseline plus slow AR(1) drift. In the primary model (M1) we also add a sparse, heavy-tailed contamination excursion (e_{s,t} \ge 0) that pushes water quality down and hazard up at the same time:
$$ z^{W}{s,t} = \mu^{W}{s} + f^{W}{s,t} - e{s,t}, \qquad z^{H}{s,t} = \mu^{H}{s} + f^{H}{s,t} + \lambda_H e{s,t} $$
$$ f_{s,t} = \phi f_{s,t-1} + \sigma_f \varepsilon_{s,t}, \qquad e_{s,t} = \operatorname{softplus}!\left(m_s + \sigma_x u_{s,t} + \beta_{\text{rain}}\text{rain}t\right),\quad u{s,t}\sim t_4 $$
$$ W_{s,t} = 100\,\sigma!\left(z^{W}{s,t}\right), \qquad H{s,t} = 100\,\sigma!\left(z^{H}_{s,t}\right) $$
Each report field gets its own measurement model: ordinal probit for clarity (1–5) and smell intensity (0–3), logistic for the sewage-smell flag, and ordered logit for trash and insects. Each observer gets a leniency offset. Some reports are simply wrong, so every report is a mixture of "genuine" and "junk":
$$ p(\text{report}r) = (1-\epsilon)\,p{\text{good}}(\text{report}r \mid W,H) + \epsilon\,p{\text{junk}}(\text{report}_r) $$
The detectors run once per posterior draw, so their outputs are probabilities, not yes/no calls. A change is confirmed when
$$ P\left(\Delta W_{s,t} > 10 \text{ points} \mid \text{data}\right) \ge 0.9 $$
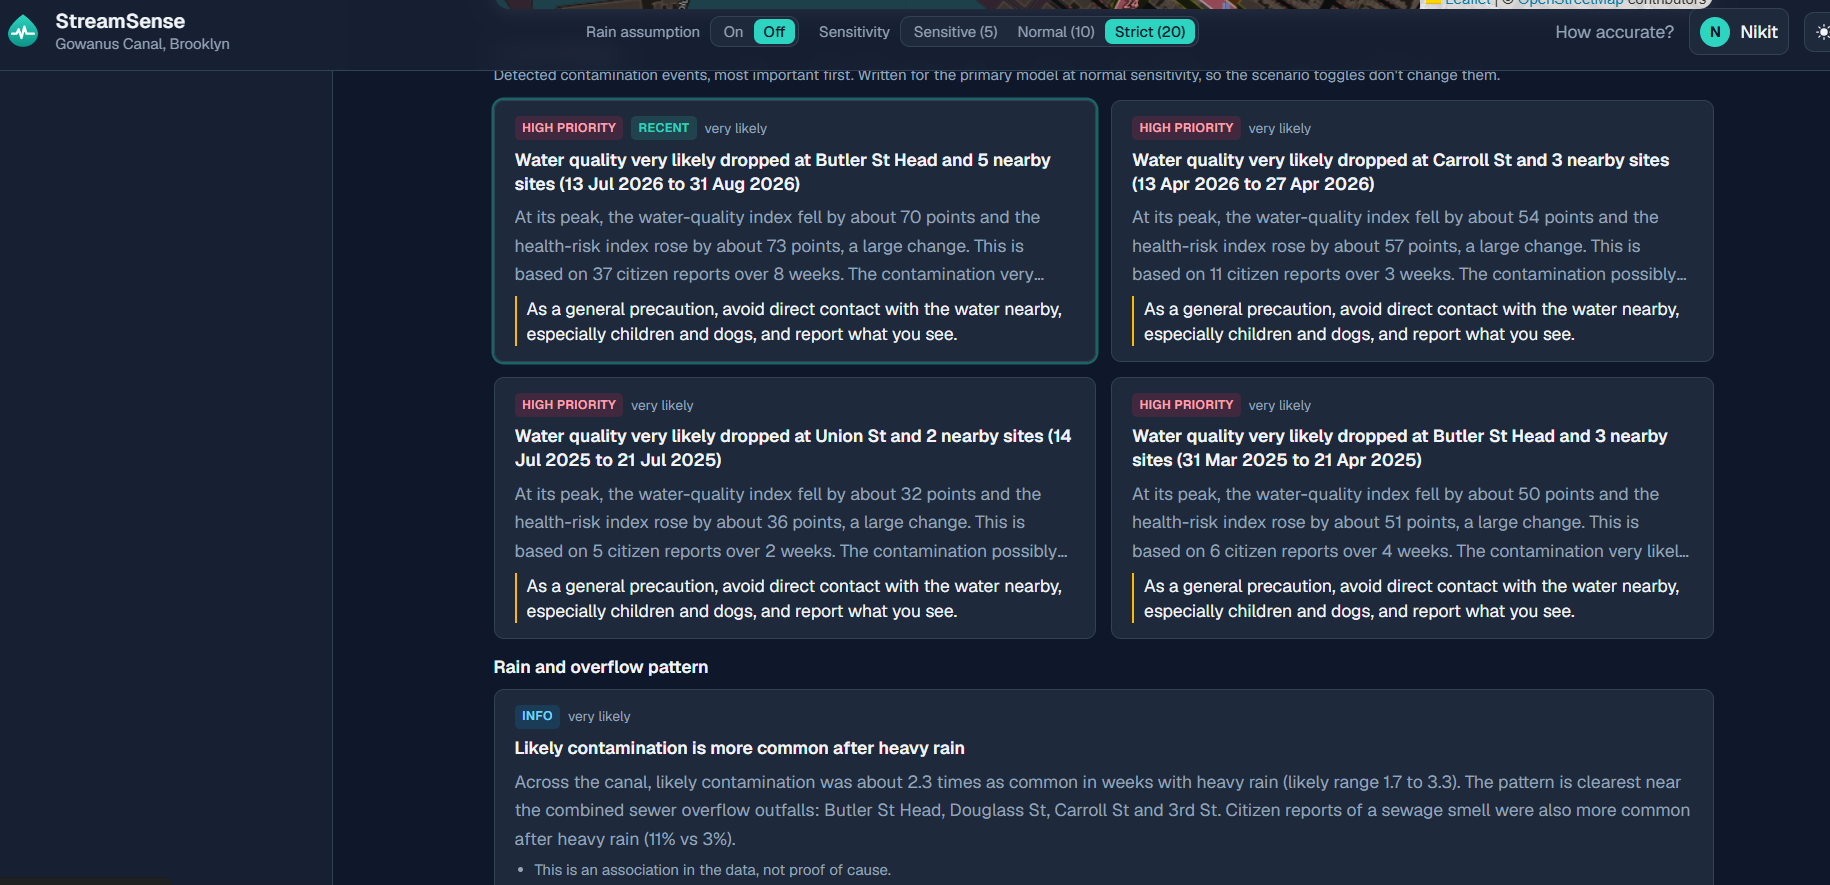
and possible at (\ge 0.5). These thresholds were fixed before we compared anything with the ground truth. To find the entry point we walk upstream through an unbroken run of dropping sites and report an 80% credible set of candidate sources. For the rain → overflow question we fit an ablation model without rain (M1_norain), so the finding isn't built into the model's assumptions. We then compare the incidence rate ratio in rain vs dry weeks and run a shifted-rain placebo test.
How we built it
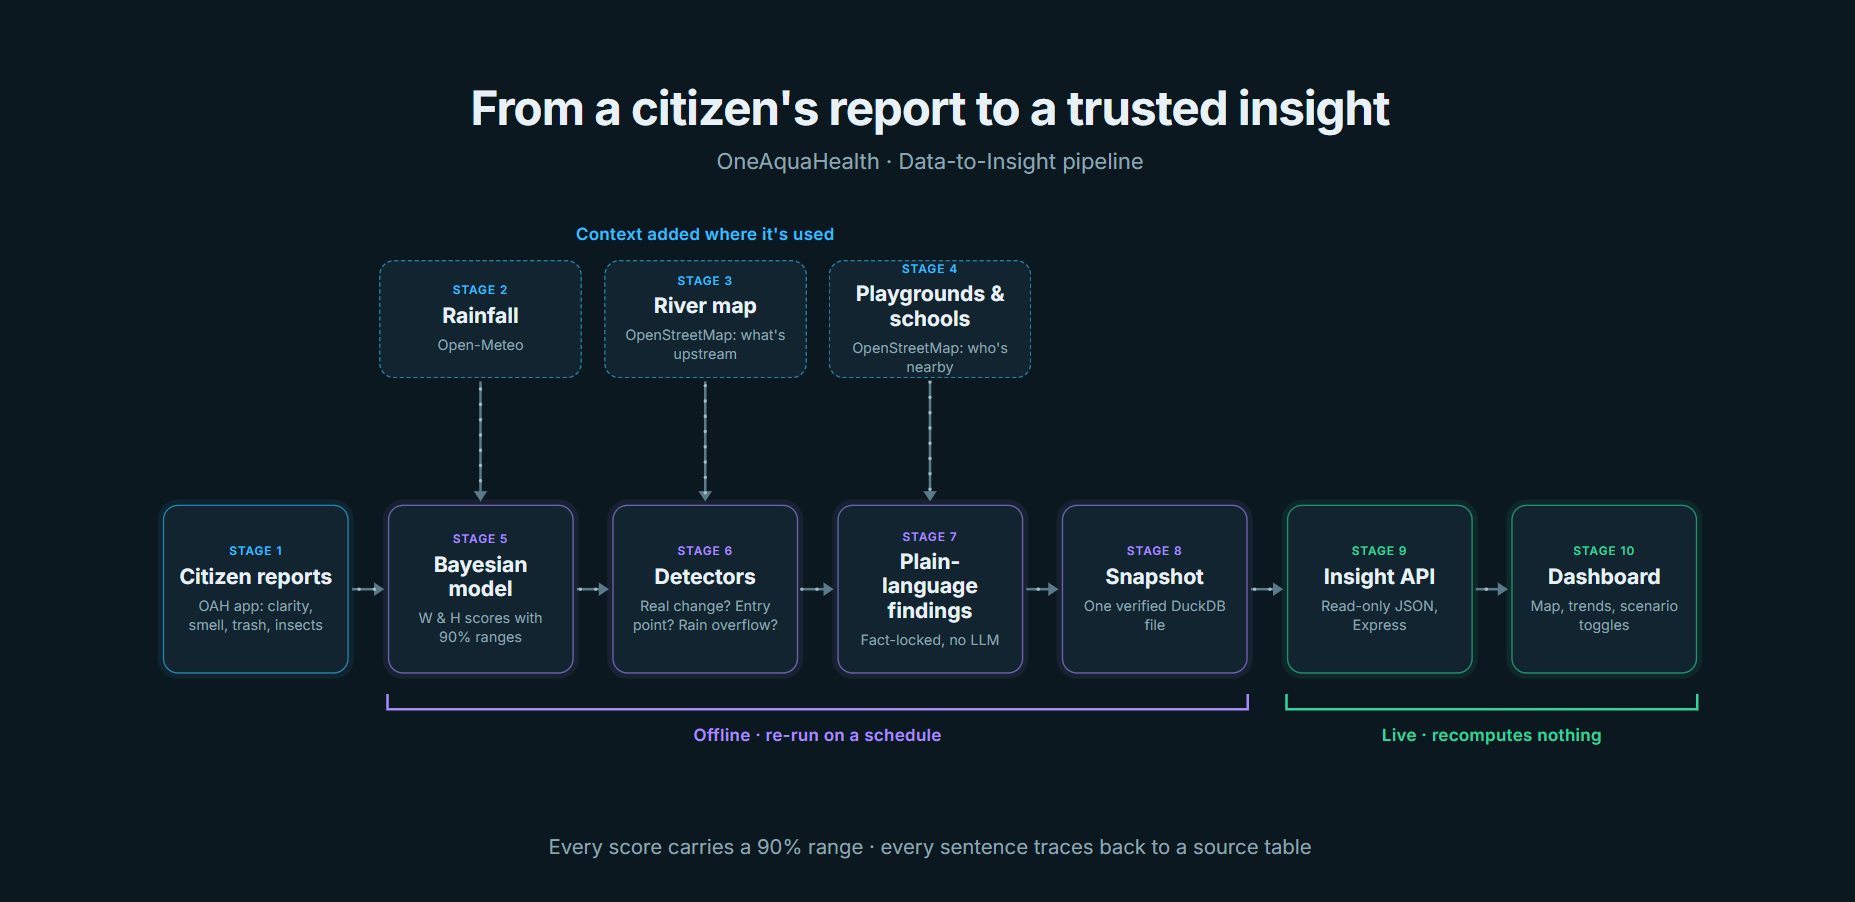
An end-to-end, 11-stage Data-to-Insight pipeline that turns raw observations into plain-language One Health findings:
- Ingest OAH citizen observations, plus a simulator that generates synthetic reports with known ground truth.
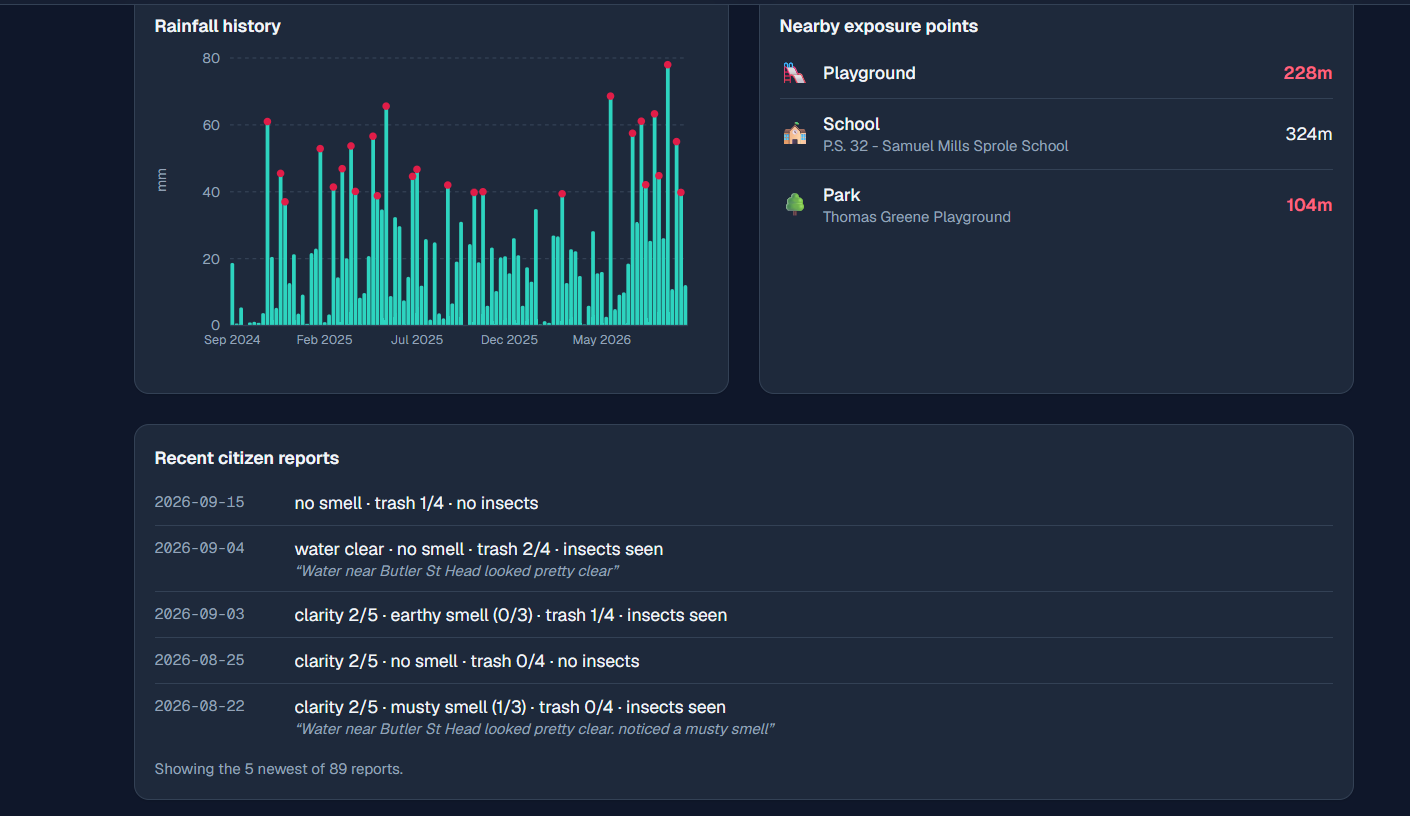
- Weather context: weekly rainfall history from Open-Meteo.
- River graph: upstream/downstream relationships between sites from OpenStreetMap.
- Exposure: nearby playgrounds, schools and parks (OSM), the places where contamination matters to people.
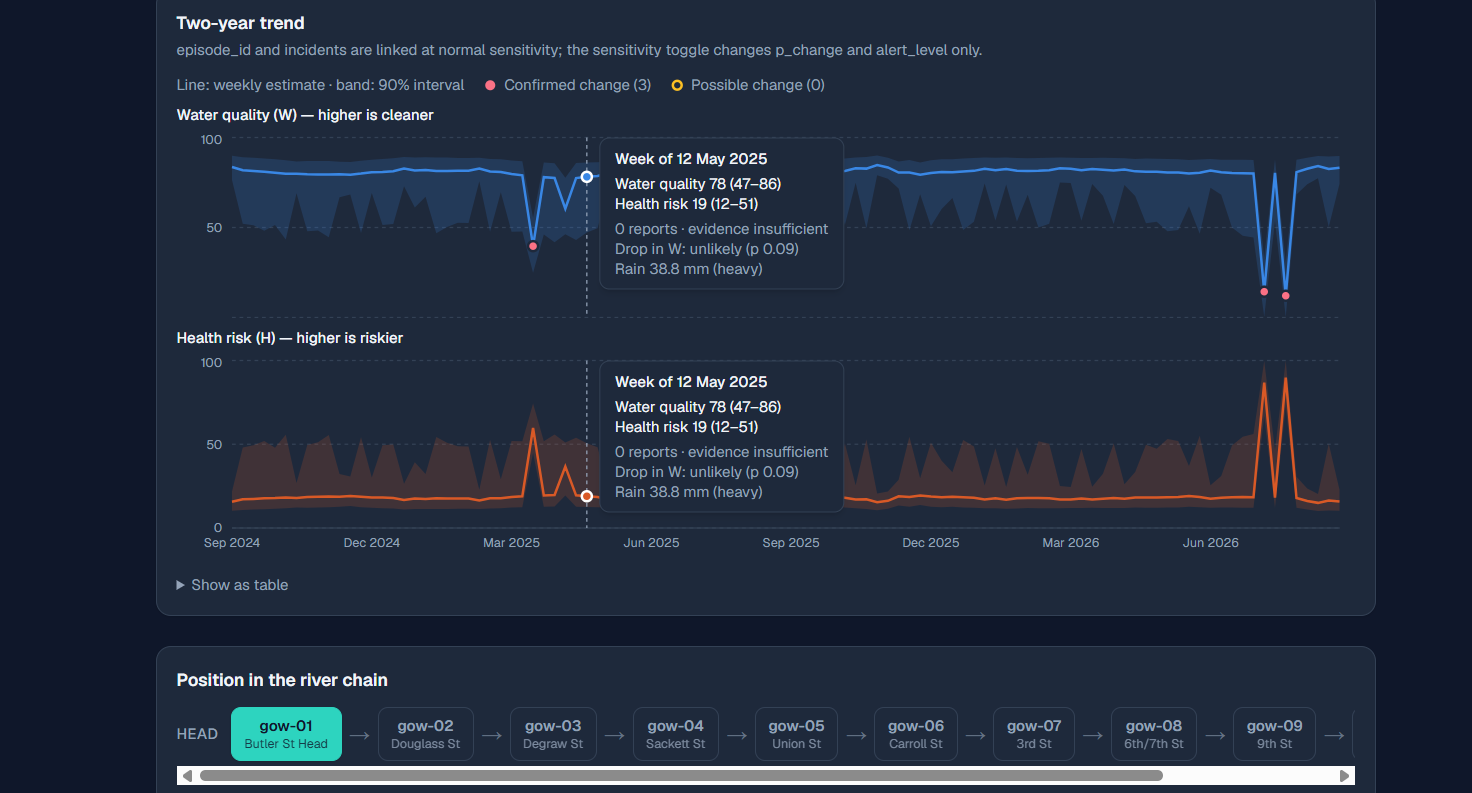
- Bayesian latent model (PyMC + NUTS) estimating two scores per site per week: (W) (water quality) and (H) (human-health hazard), each with a 90% credible interval.
- Detectors: did something really change? Where did it enter? Is there a rain → sewage overflow pattern?
- Fact-locked language generation that turns detections + exposure into findings.
- Frozen snapshot: one verified DuckDB file, so the live app recomputes nothing.
- Insight API (Express + DuckDB) that other tracks can consume.
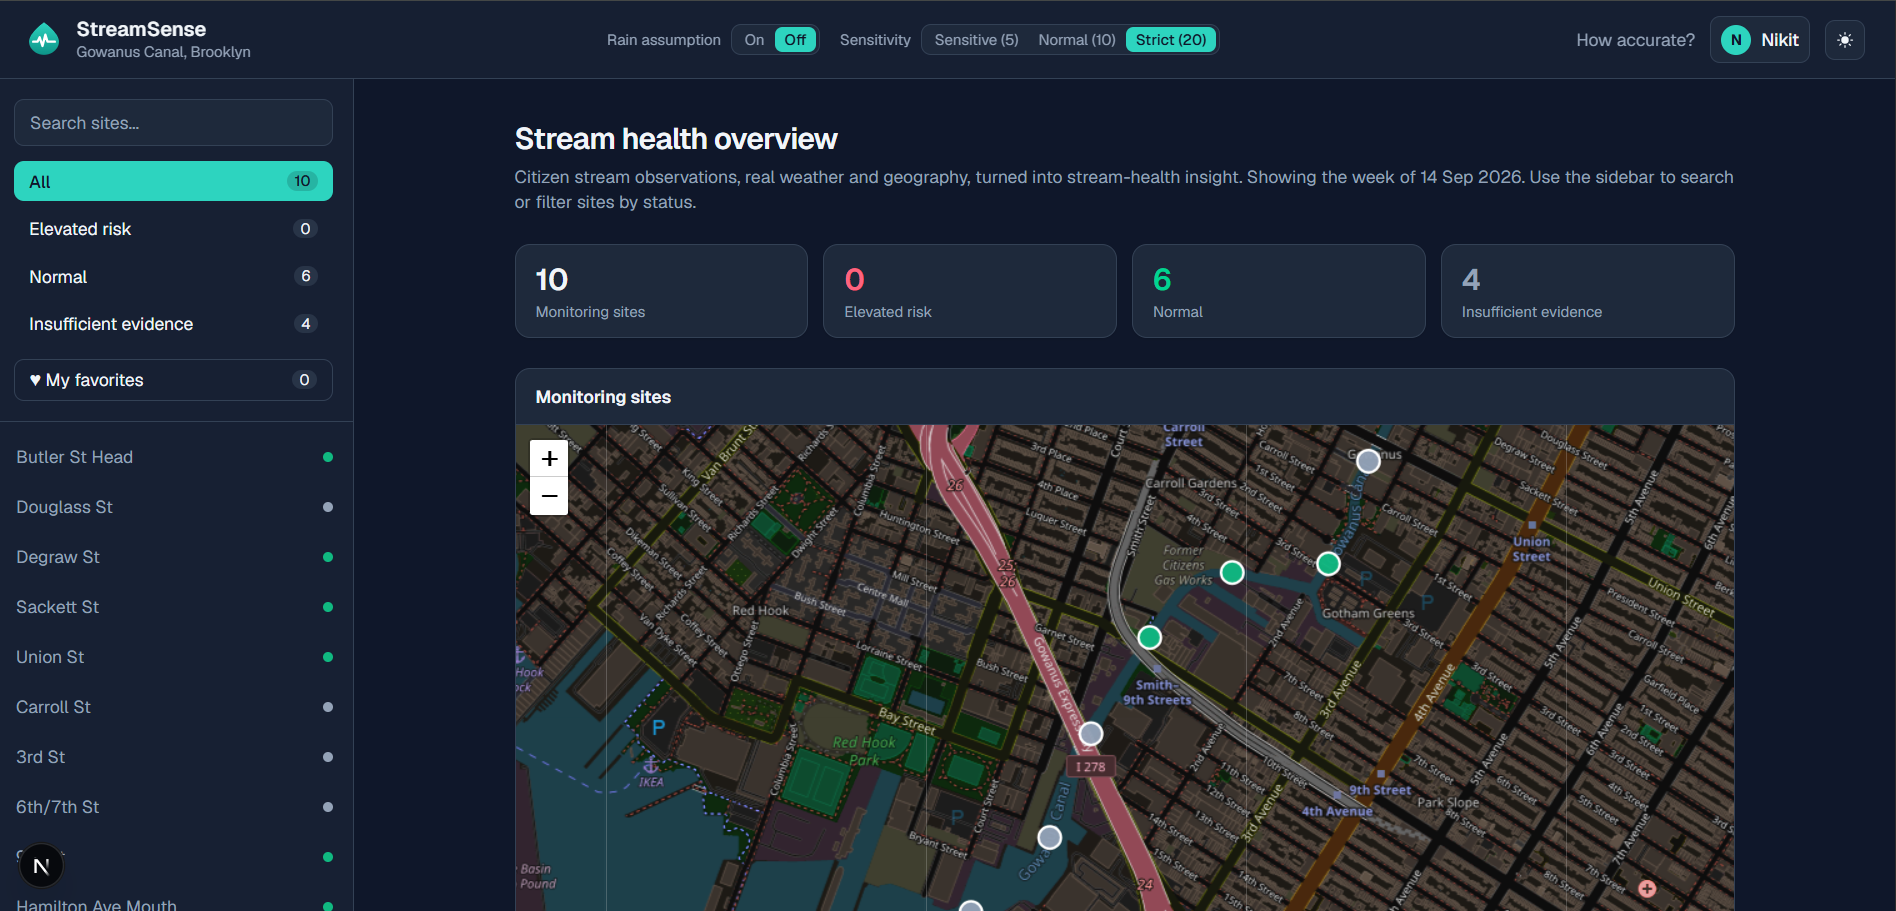
- Dashboard (Next.js) with a map, river chain, trends, scenario toggles and an honest Insufficient evidence state.
- Benchmark against the simulator's hidden truth, with misses included.
Challenges we ran into
Sparse, subjective data. Most site-weeks have no report. Getting a model that converges and stays honest about uncertainty meant non-centred parameterisations, centring loadings on reference levels, and a convergence gate that refuses to publish a failed fit.
Bimodal posteriors. Sometimes one odd report can be explained as either "contamination" or "junk report". We flag these and cap them at "possible".
Real data access. The OAH citizen-report endpoint needed credentials we didn't have during the hackathon. The public endpoints and FHIR sandbox had lab samples but no repeated citizen reporting. So we built a realistic simulator, which also gave us ground truth to benchmark against, plus a probe script that's ready for a real token.
Windows toolchains. PyTensor's C++ backend wouldn't build, so we switched to the nutpie/numba NUTS sampler. A native SQLite module needed MSVC, so we pinned an older version. We also had to write DuckDB snapshots in an older storage format so the Node driver could read them.
Live updates without downtime. The snapshot is built in a temp file, verified, then swapped in atomically. The API hot-reloads it and keeps serving the previous snapshot if the new one is broken.
Accomplishments that we're proud of
A complete pipeline from raw reports to findings. Eleven stages run in sequence: ingestion, weather, river graph, exposure, Bayesian model, detectors, findings text, snapshot, Insight API, dashboard and benchmark. Any stage can be re-run with one command, and the week grid is pinned, so a rerun reproduces the committed data.
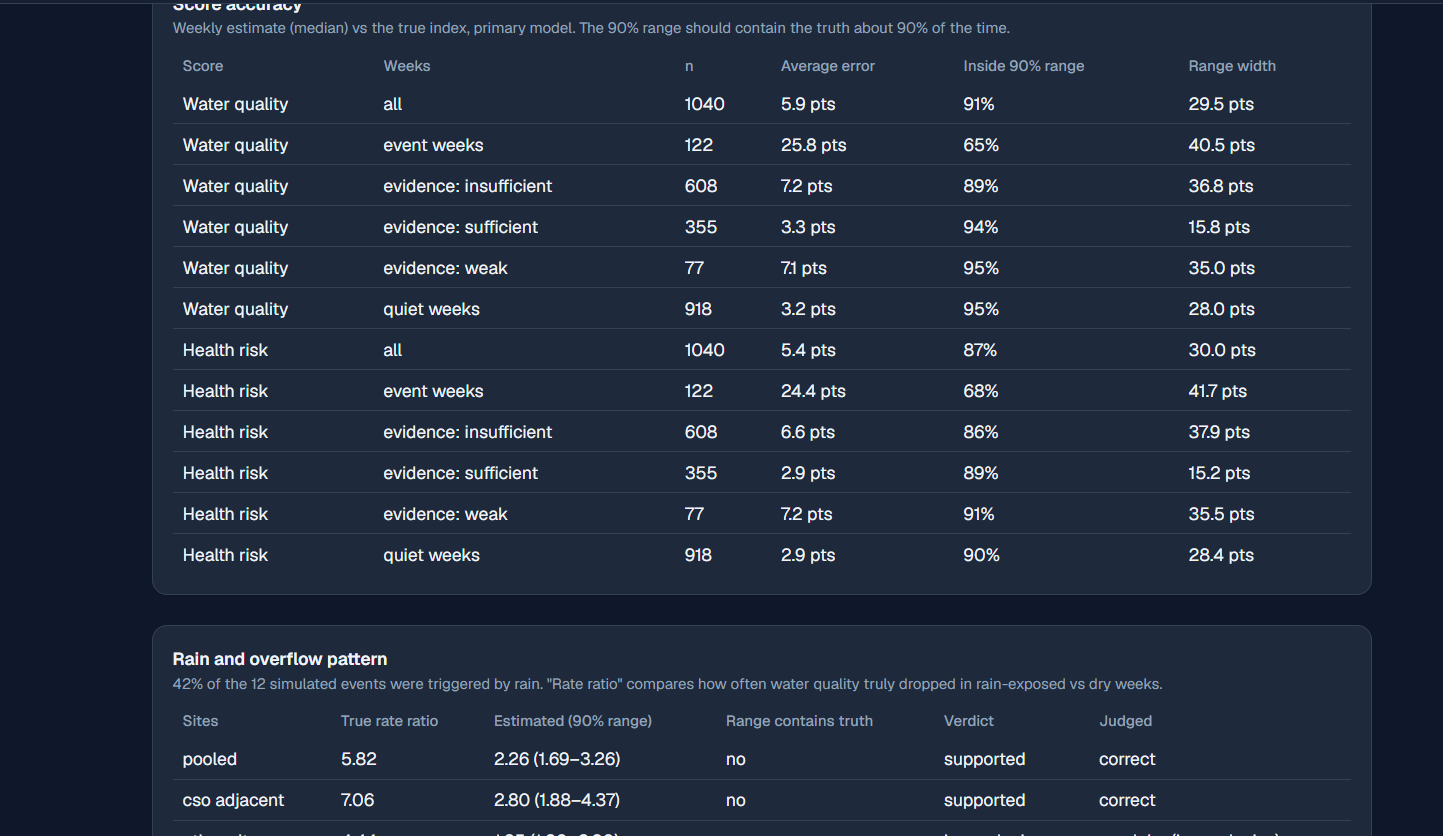
Every number comes with its uncertainty. Each site-week score ((W) for water quality, (H) for health hazard) has a 90% interval and an evidence flag. The detectors return probabilities, not yes/no calls. When the data is too thin, the dashboard says Insufficient evidence instead of guessing.
Findings text that can't overstate the data. Every number in every sentence traces back to a source table. Words like "safe" or "caused" are rejected, and the stage fails rather than publish a sentence it can't support. No LLM is involved.
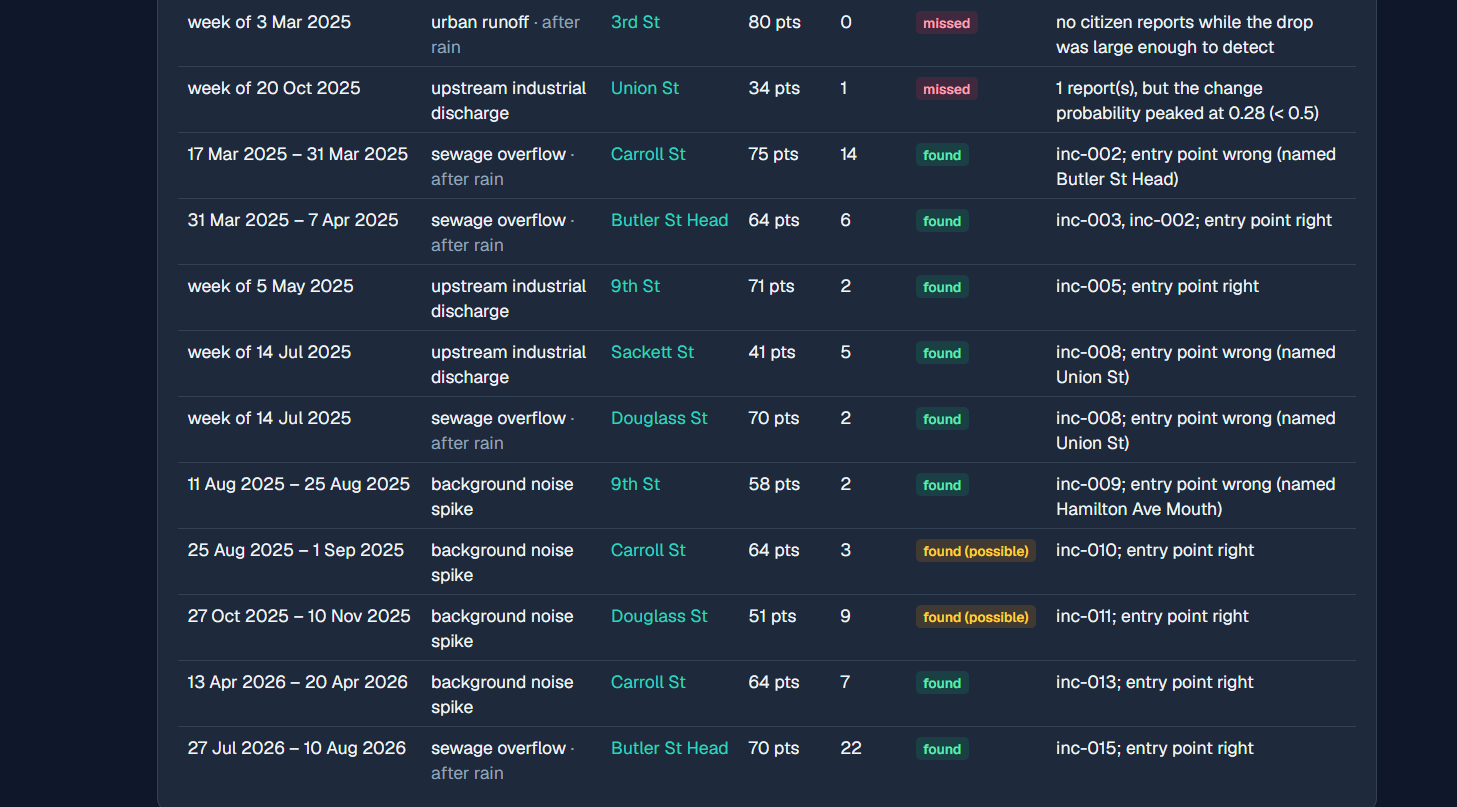
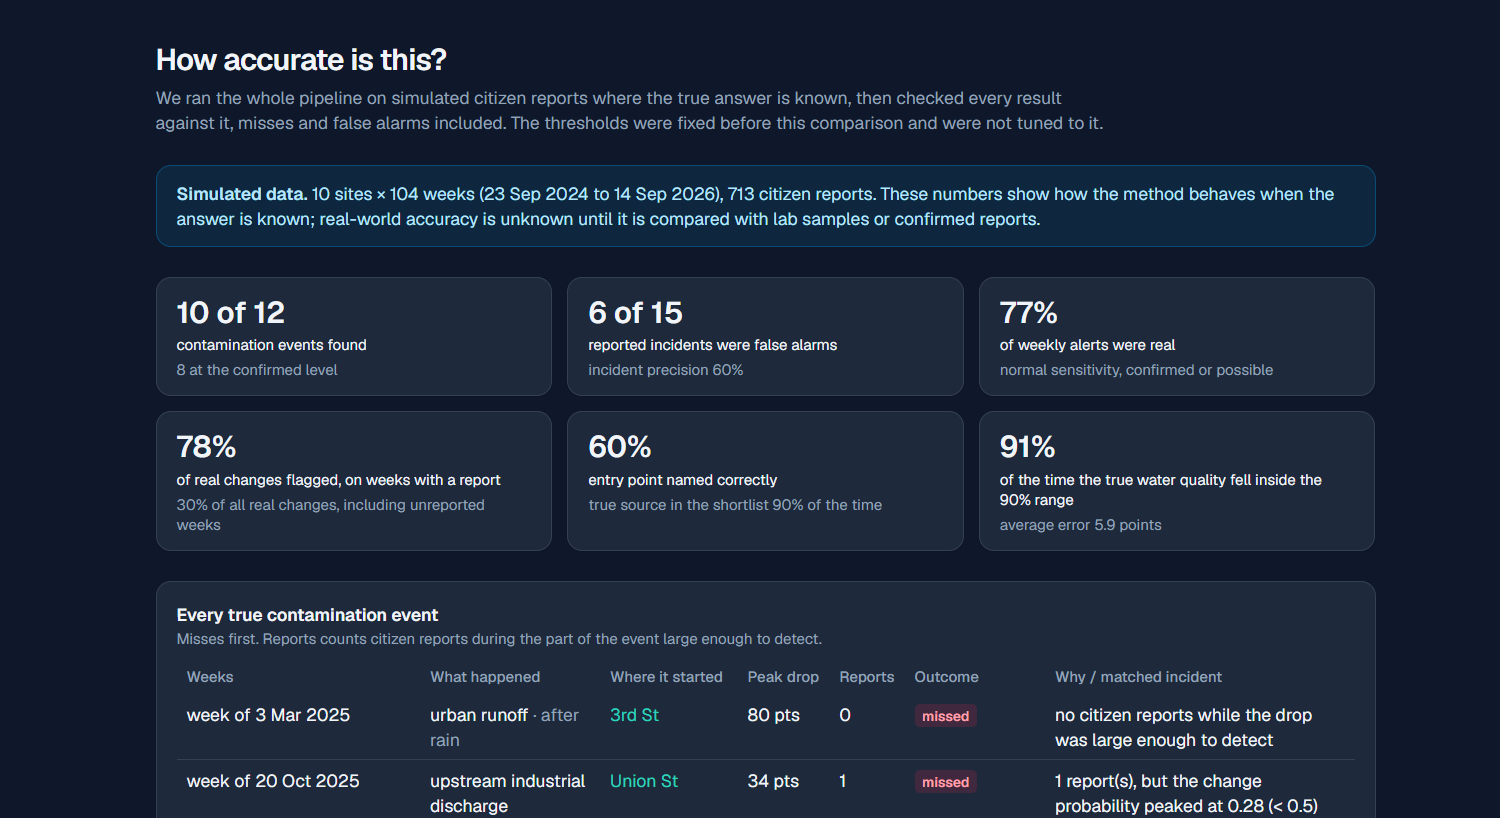
We benchmarked against known truth and published the misses. On simulated data (10 sites × 104 weeks):
- 10 of 12 contamination events were found.
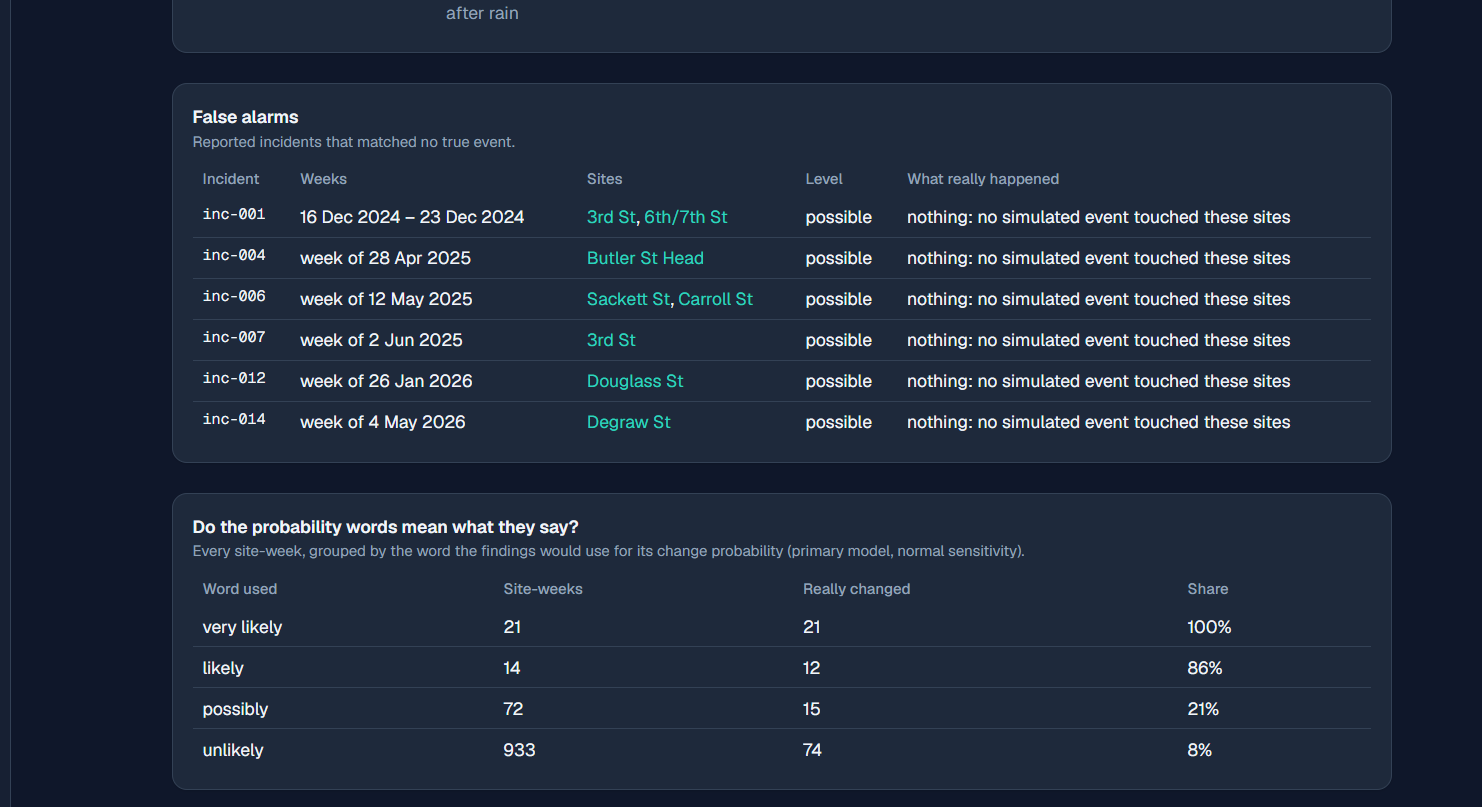
- "Confirmed" alerts had zero false positives.
- Weekly alerts reached 77% precision / 78% recall on weeks that had a report. A no-model baseline that flags murky or sewage reports directly got 67% / 57%.
- The true contamination source was inside the 80% shortlist 90% of the time.
- "Very likely" was right 21 of 21 times.
- The weak spots are shown on the dashboard's "How accurate is this?" page: the model understates large drops, and it underestimates how much rain matters (2.3× estimated vs 5.8× true).
The thresholds weren't tuned on the answers. Detection thresholds were fixed before any comparison with the simulator's truth. We also checked the rain → sewage overflow finding with a model that assumes no rain effect, plus a placebo test with shifted rain dates. Without that check, the model would only "find" the rain effect because we built it in.
Tracing contamination upstream. The pipeline combines an OpenStreetMap river graph with the model's estimates to rank likely entry points. It also warns when the site just upstream had no reports to check.
Risk shown where people are. Incidents are linked to nearby playgrounds, schools and parks, and the precaution wording appears only when it applies.
A live system that stays up. All heavy computation happens offline and is saved to one verified DuckDB snapshot. The snapshot is built separately and swapped in all at once. The API reloads it while running and keeps serving the previous version if a new one is broken. The dashboard still loads even when the API is down, and it says so.
Ready for real data. The OAH citizen-report endpoint needed credentials we didn't have. We built a realistic simulator and a probe script, so connecting the real data needs only a token.
What we learned
Uncertainty is a feature you have to design: it needs to show up in the model, the API contract, the wording and the UI.
Ablations and placebo tests matter. A model that assumes rain causes overflow will always "find" that it does.
Benchmarking against known truth, and publishing the misses, builds more trust than a polished demo.
Separating heavy offline computation from a static, read-only snapshot makes the live system simple, fast and hard to break.
What's next for StreamSense
Connecting real OAH citizen data once credentials are available, checking results against lab samples, translating the findings templates, and running the pipeline weekly on a schedule.
Built With
- arviz
- duckdb
- express.js
- geopandas
- leaflet.js
- networkx
- next.js
- node.js
- numba
- numpy
- nutpie
- open-meteo
- openstreetmap
- osmnx
- pandas
- pyarrow
- pymc
- pytensor
- python
- react
- scipy
- tailwindcss
- typescript
- xarray

Log in or sign up for Devpost to join the conversation.