-
-
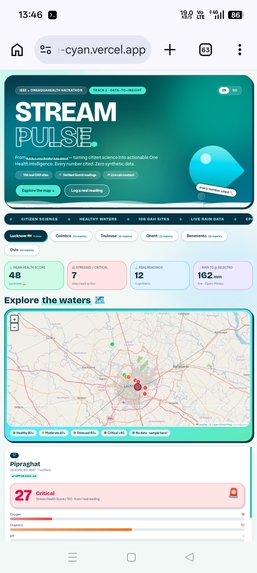
Homepage
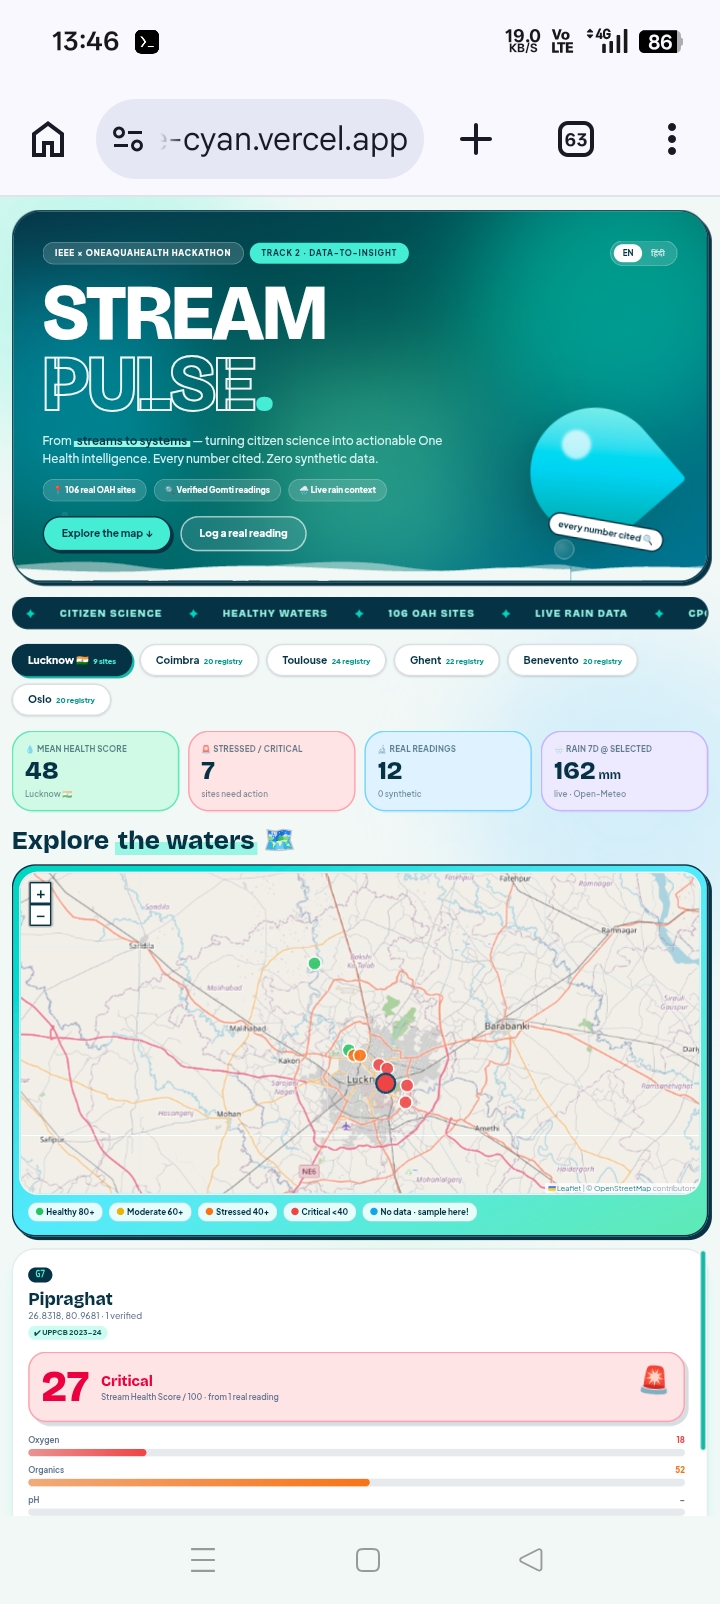
Inspiration
I live in Lucknow, and the Gomti River flows through my city — dying in plain sight. Dissolved oxygen as low as 0.9 mg/L (fish need 5+), BOD at 10× the safe limit, faecal coliform near 100,000 MPN/100mL, and only 10–15% of sewage treated before entering the river. The data proving this exists — in UPPCB advisories, peer-reviewed papers, CPCB reports — but it's scattered across PDFs and portals no citizen, officer, or researcher can use at a glance.
The OneAquaHealth mission — connecting ecosystem health, biodiversity, and human well-being through citizen science — gave me the frame: what if messy, scattered stream data became actionable One Health intelligence that a ward officer could act on and a citizen could understand?
What it does
StreamPulse is a Track 2: Data-to-Insight dashboard that turns verified water-quality data into decisions:
- 🗺️ 9 Gomti monitoring sites + 106 real OneAquaHealth registry sites (Coimbra, Ghent, Benevento, Oslo, Toulouse) on an interactive map
- 🔬 Transparent 0–100 Stream Health Score anchored to CPCB bathing-water thresholds — missing params are skipped, never guessed
- 🩺 One Health Brief per site: ecosystem 🐟 + human 🧍 + animal/vector 🐾 risks plus ✅ suggested actions, in plain language (+ Hindi summary 🇮🇳)
- 🌧️ Live 7-day rainfall context per site (storms flush sewage into rivers)
- 📈 Verified timelines — dots only, no interpolation; gaps honestly mean "no open data"
- ⚖️ Side-by-side comparison with overlay trends and an auto-generated verdict
- ⬇️ Brief export (Markdown download + copy) for officers and researchers
- 🌱 Field logging with photo evidence + 📤 CSV upload — every citizen reading scores instantly
- 🔍 Every number cited. Zero synthetic data. Each reading carries a source chip linking to its publication.
How we built it
Stack: React + Vite + Tailwind + Leaflet/OpenStreetMap + Recharts + PapaParse — 100% client-side, zero API keys, deployed static on Vercel.
Real-data pipeline (the hard part):
- Pulled all 106 OAH research sites from the public
api.enora-oah.euregistry (bundled — the API blocks browser CORS; observation endpoints need auth, so registry cities honestly show "no data yet") - Hand-extracted and cross-validated 12 verified readings from 5 published sources: UPPCB 2023–24 seven-site study, UPPCB Nov 2025 advisory, MDPI Water 2023 campaign, BioOne 2025 peer-reviewed study, UPPCB 2022 aggregates
- Rejected two papers whose data couldn't be honestly placed (one was groundwater mislabeled as river data)
- Wired Open-Meteo for live rainfall per selected site
Scoring (explainable, CPCB Class B):
$$\text{Score} = \frac{\sum w_i \cdot s_i}{\sum w_i}, \quad w = {DO: 0.30,\ BOD: 0.25,\ pH: 0.15,\ turb: 0.15,\ coli: 0.15}$$
computed only over available parameters — so a DO-only reading still scores honestly instead of being punished for missing data.
Briefs are rule-based (no black boxes): threshold crossings → risk sentences → actions, each traceable to the reading that triggered it.
Challenges we ran into
- India's open water data is a maze. CPCB download links returned 404, India-WRIS services timed out, data.gov.in water APIs need keyed requests, and GEMStat needs manual approval. I pivoted to verified published science instead of fake density.
- A paper almost fooled me. A promising site-wise table turned out to be groundwater (handpumps), not river water — I caught it in the methods section and excluded it. That save became our core principle: if it can't be honestly placed, it doesn't go in.
- Designing for sparse data. One dot per site looks "empty" — so I designed honest gap states ("Be the first to sample here 🌱"), visible dots, and made filling gaps live the demo's best moment.
- Solo + part-time + 8 days. Ruthless scoping: no backend, no login, no fake ML — everything that shipped had to earn its place. (Also: our first map provider started demanding API keys mid-build, so we migrated to OpenStreetMap.)
Accomplishments that we're proud of
- 🏆 A dashboard with zero synthetic data in a hackathon world full of mock data — and we turned that constraint into the product's identity
- 📚 9 sites, 12 readings, every one clickable back to its source publication
- 🌐 Full English/Hindi bilingual UI so Lucknow's citizens can actually use it
- ⚖️ Comparison mode whose verdict ("Pipraghat scores 73 points lower, driven by…") writes the policy argument itself
- 🎨 A poster-grade animated UI (giant display hero, bubbles, marquee, count-ups) built solo in days
What we learned
- Open data ≠ accessible data. The numbers to save a river exist but are buried; the last mile (interpretation + plain language + mobile UI) is where impact lives.
- CPCB/WHO water-quality science: what DO, BOD, COD, and coliform actually mean for fish, bathers, and livestock — and how to explain them without jargon.
- Honesty is a feature. Researchers (and judges) trust sparse-but-cited over dense-but-fake. "Insufficient evidence" states beat hallucinations.
- One Health thinking: every reading now automatically raises three questions — what does this mean for the ecosystem, for people, for animals? That lens changed how I build.
What's next for StreamPulse — One Health Stream Intelligence
- 🔌 FHIR R4 export + OneAquaHealth sandbox integration — push verified citizen readings into the OAH ecosystem (Track 7 crossover)
- 🛰️ Plug into City Dashboards, Resilience Map & GEOSSIP as an insight layer
- 🔔 Early-warning alerts: rainfall + falling-DO rules that notify ward officers (Track 6 crossover)
- 📸 Community photo verification + offline-first PWA field mode for low-connectivity ghats
- 🗣️ Hindi voice briefs for non-literate citizen scientists
- 🌍 Expand verified datasets to all 5 OAH cities with local university partners — starting with whichever city shares data first
Built With
- citizen-science
- cpcb
- csv
- data-visualization
- environmental-monitoring
- gomti-river
- india
- javascript
- leaflet.js
- localstorage
- one-health
- open-data
- open-meteo
- openstreetmap
- papaparse
- public-health
- react
- recharts
- social-good
- sustainability
- tailwind-css
- vercel
- vite
- water-quality

Log in or sign up for Devpost to join the conversation.