-
-
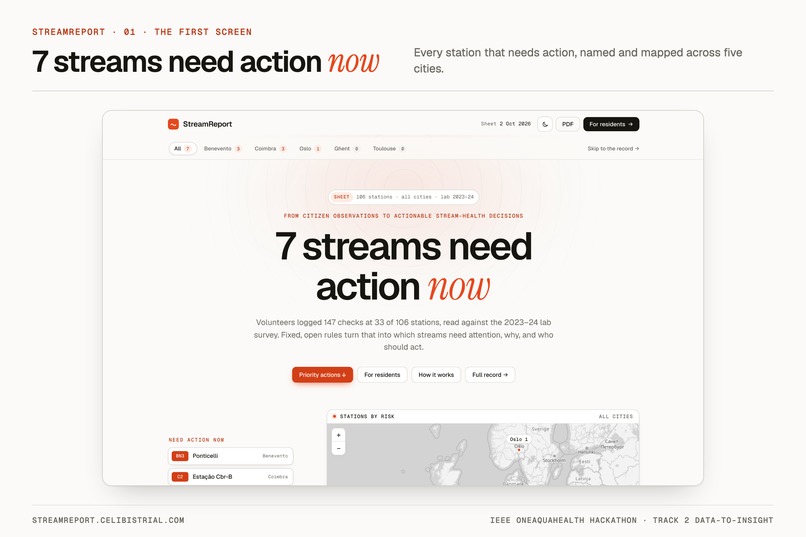
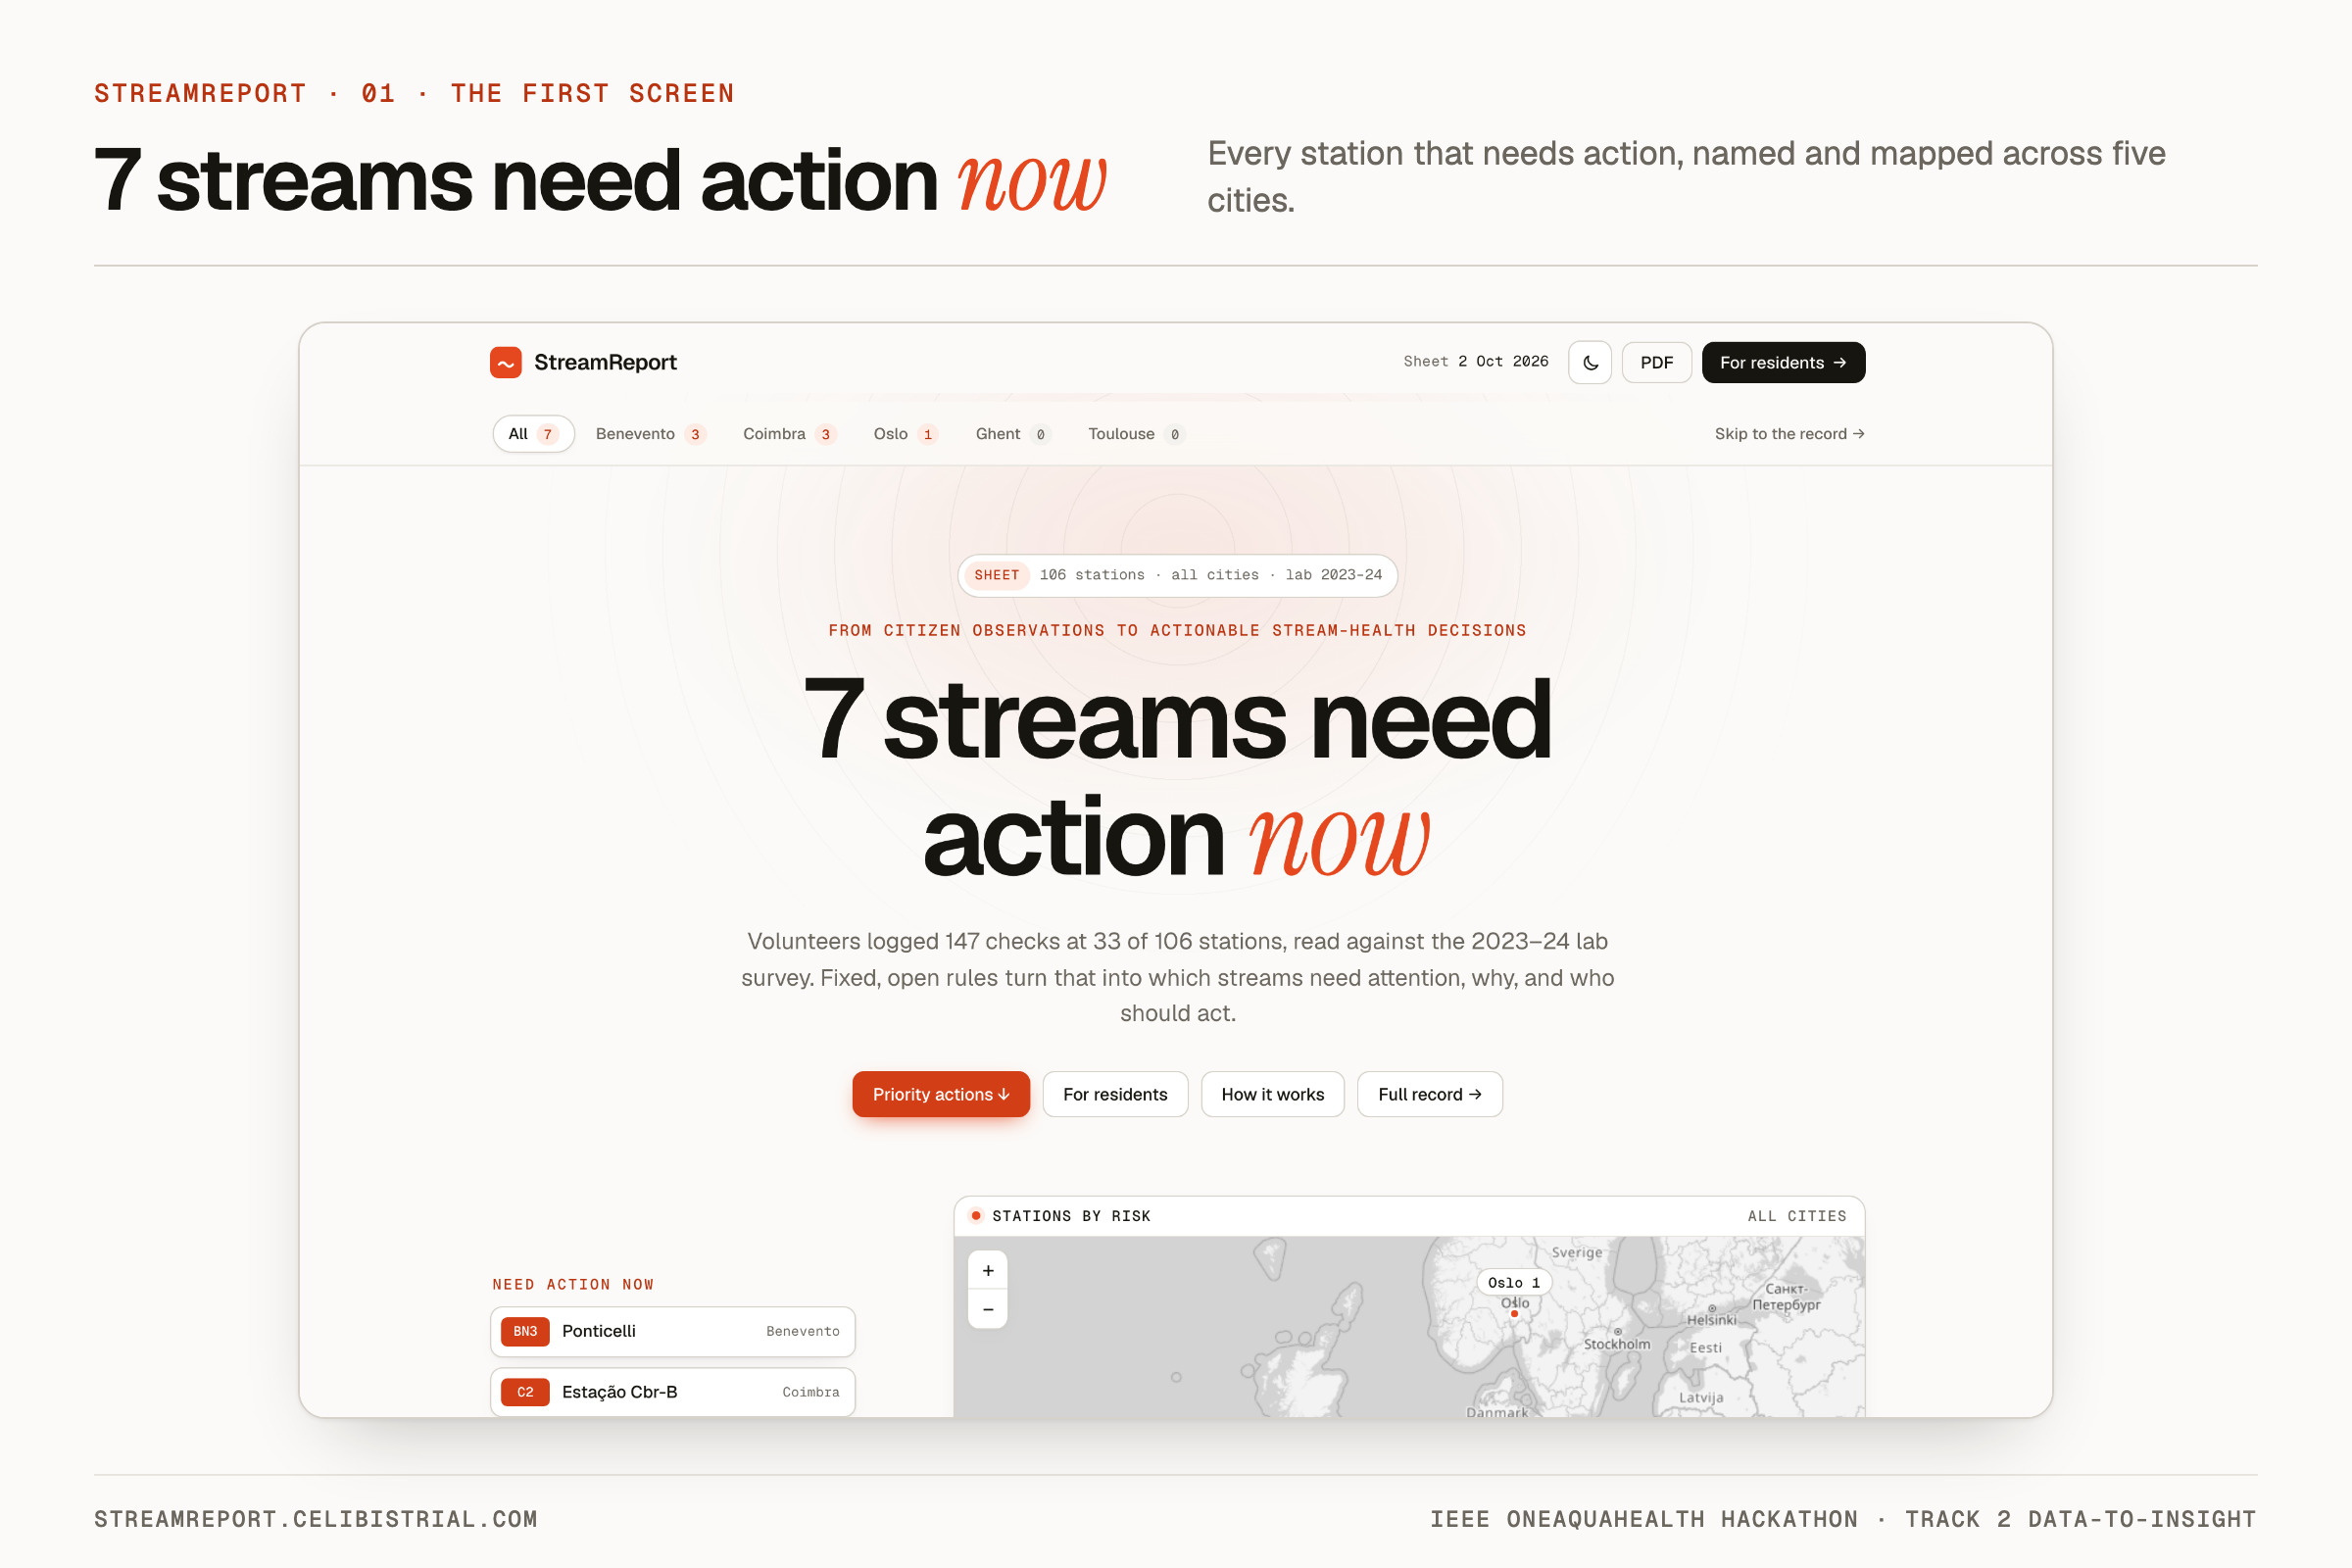
The first screen names the 7 streams that need action now and maps them across five cities.
-
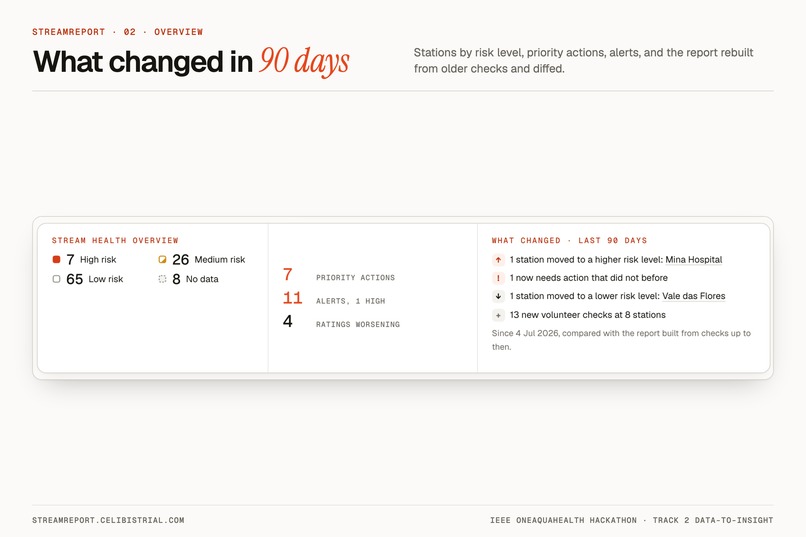
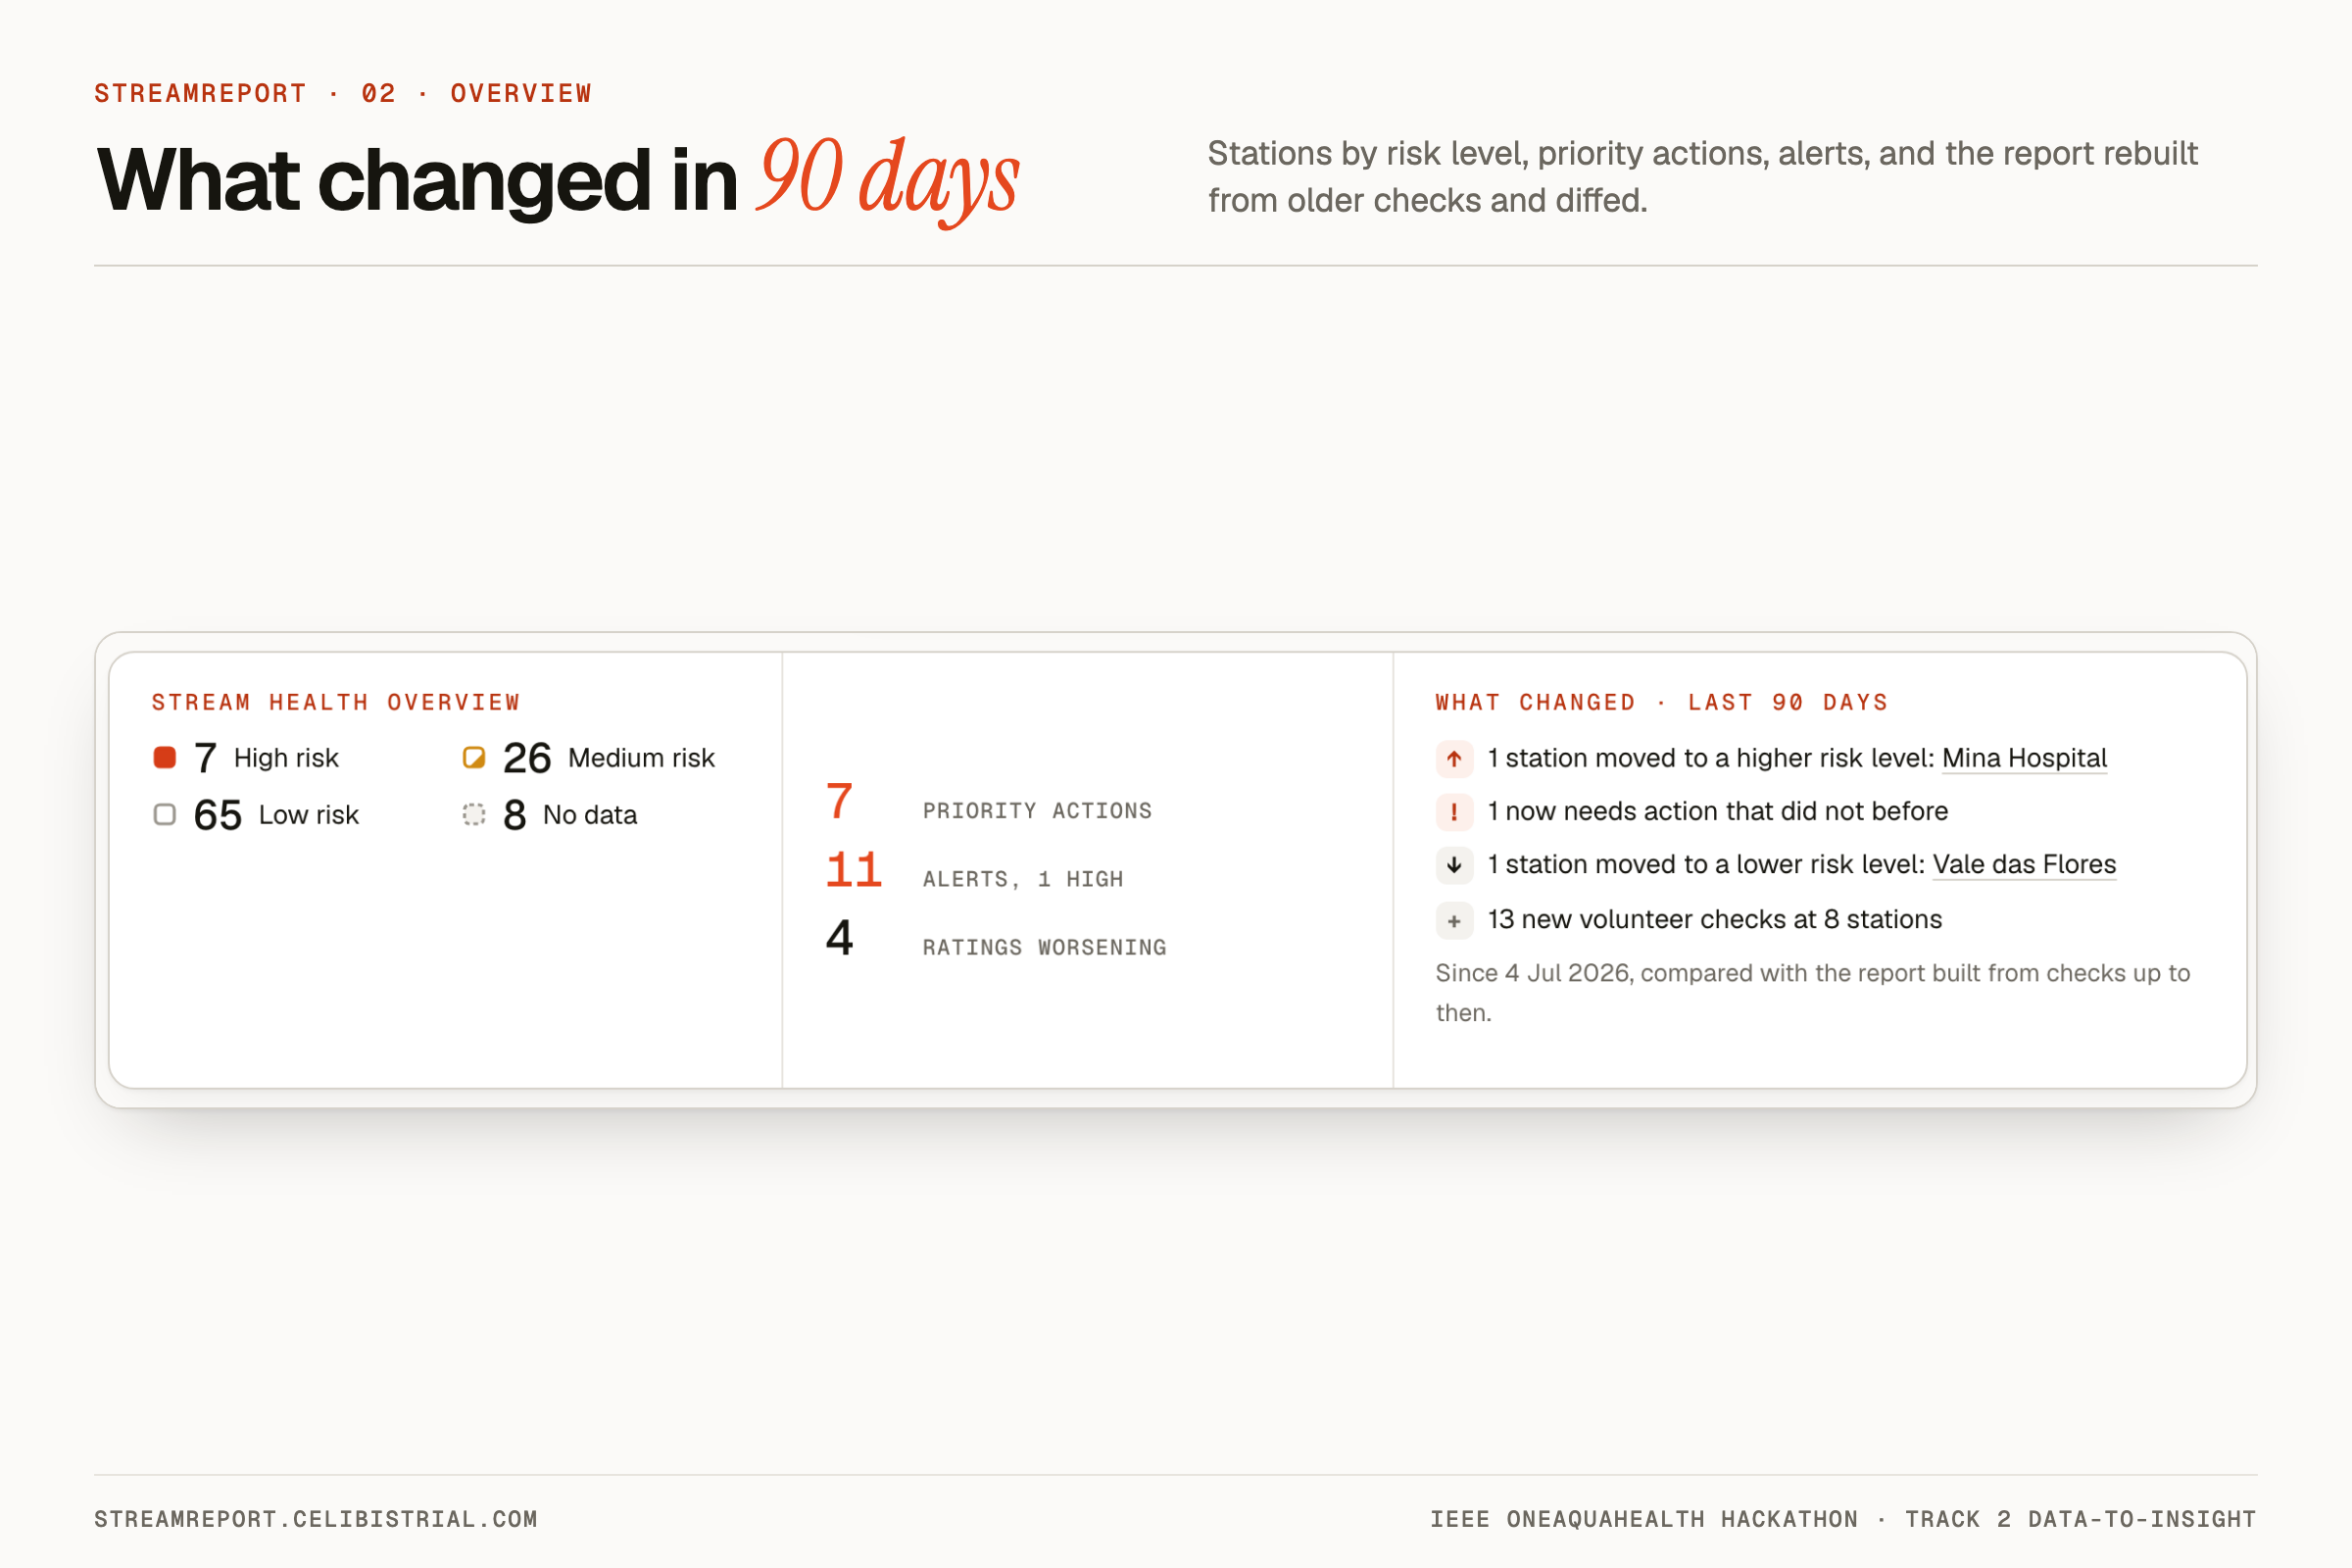
Of 106 stations, 7 are high risk, 26 medium, 65 low and 8 have no data. In 90 days, Mina Hospital moved up to High.
-
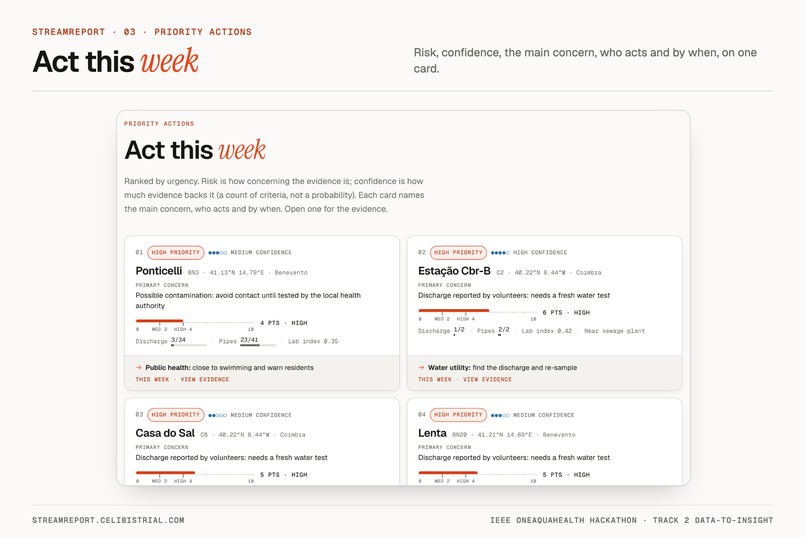
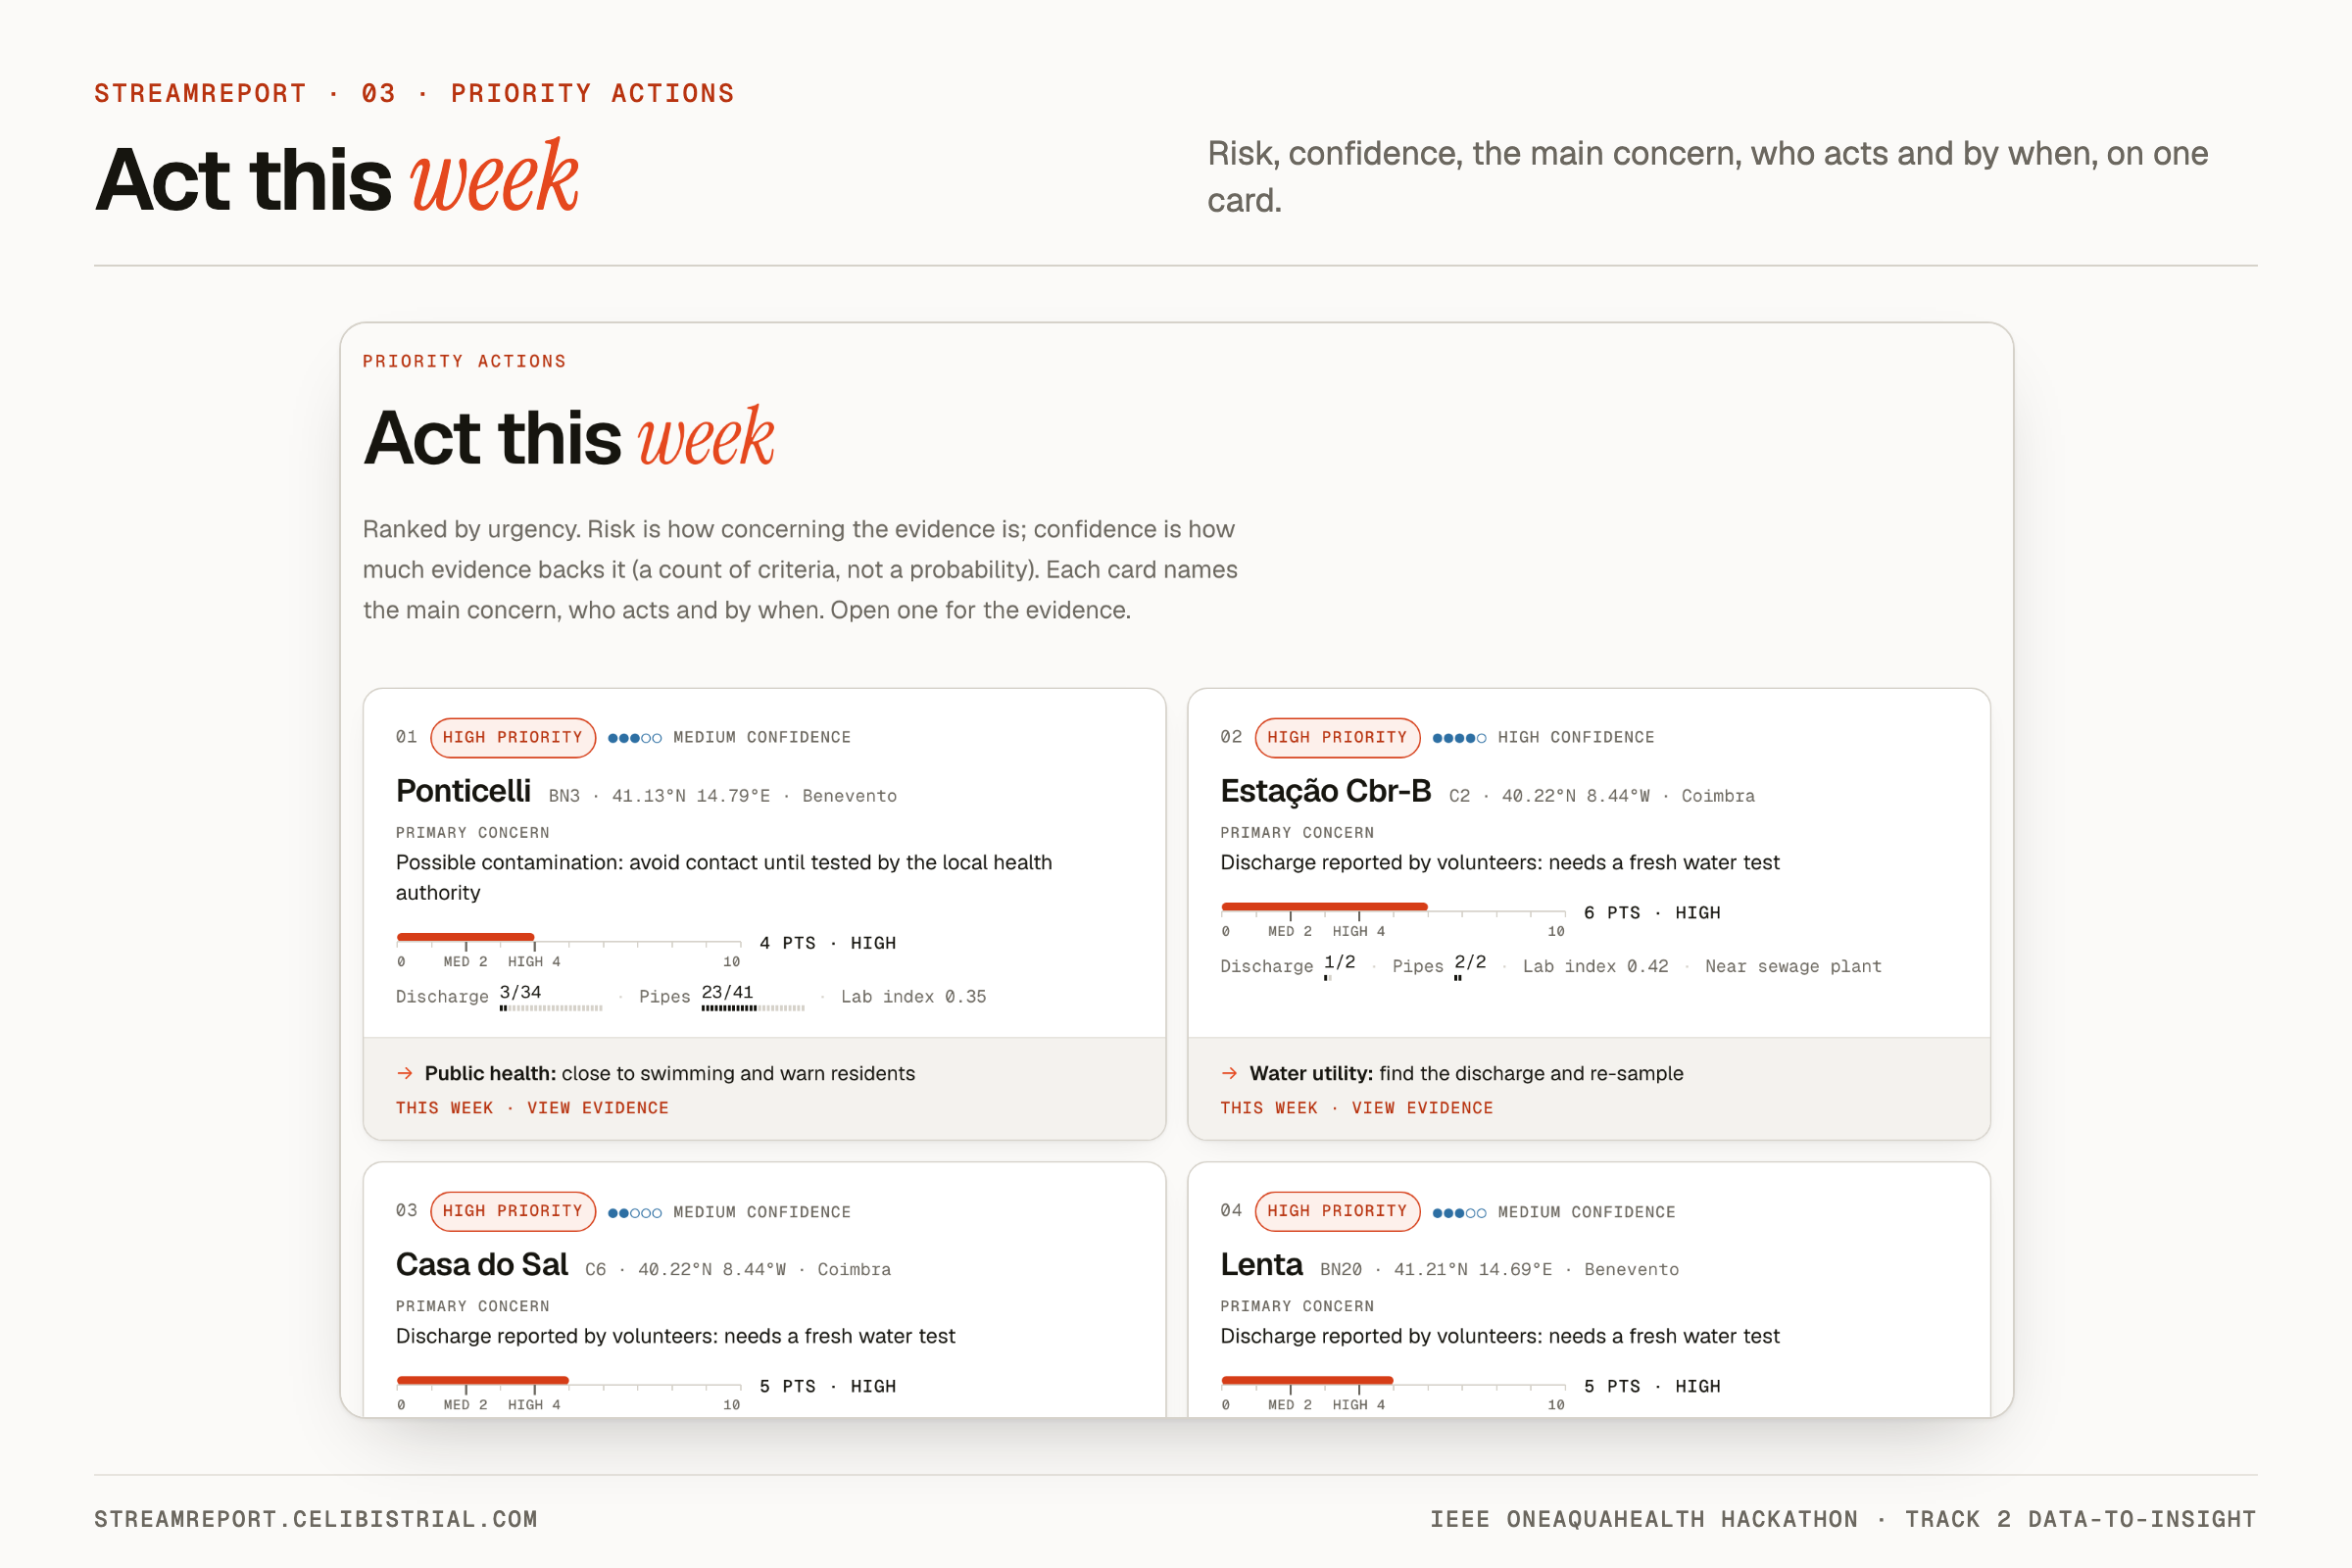
Each Act this week card shows risk points, confidence, the main concern, and who should act by when.
-
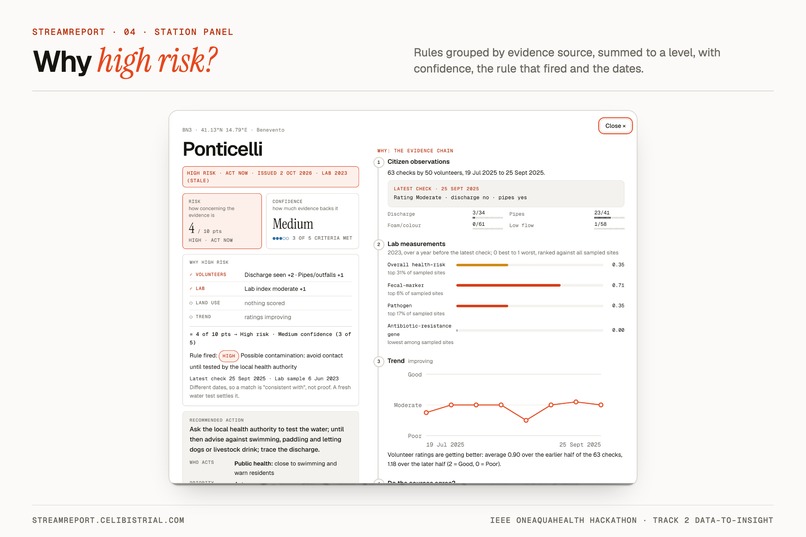
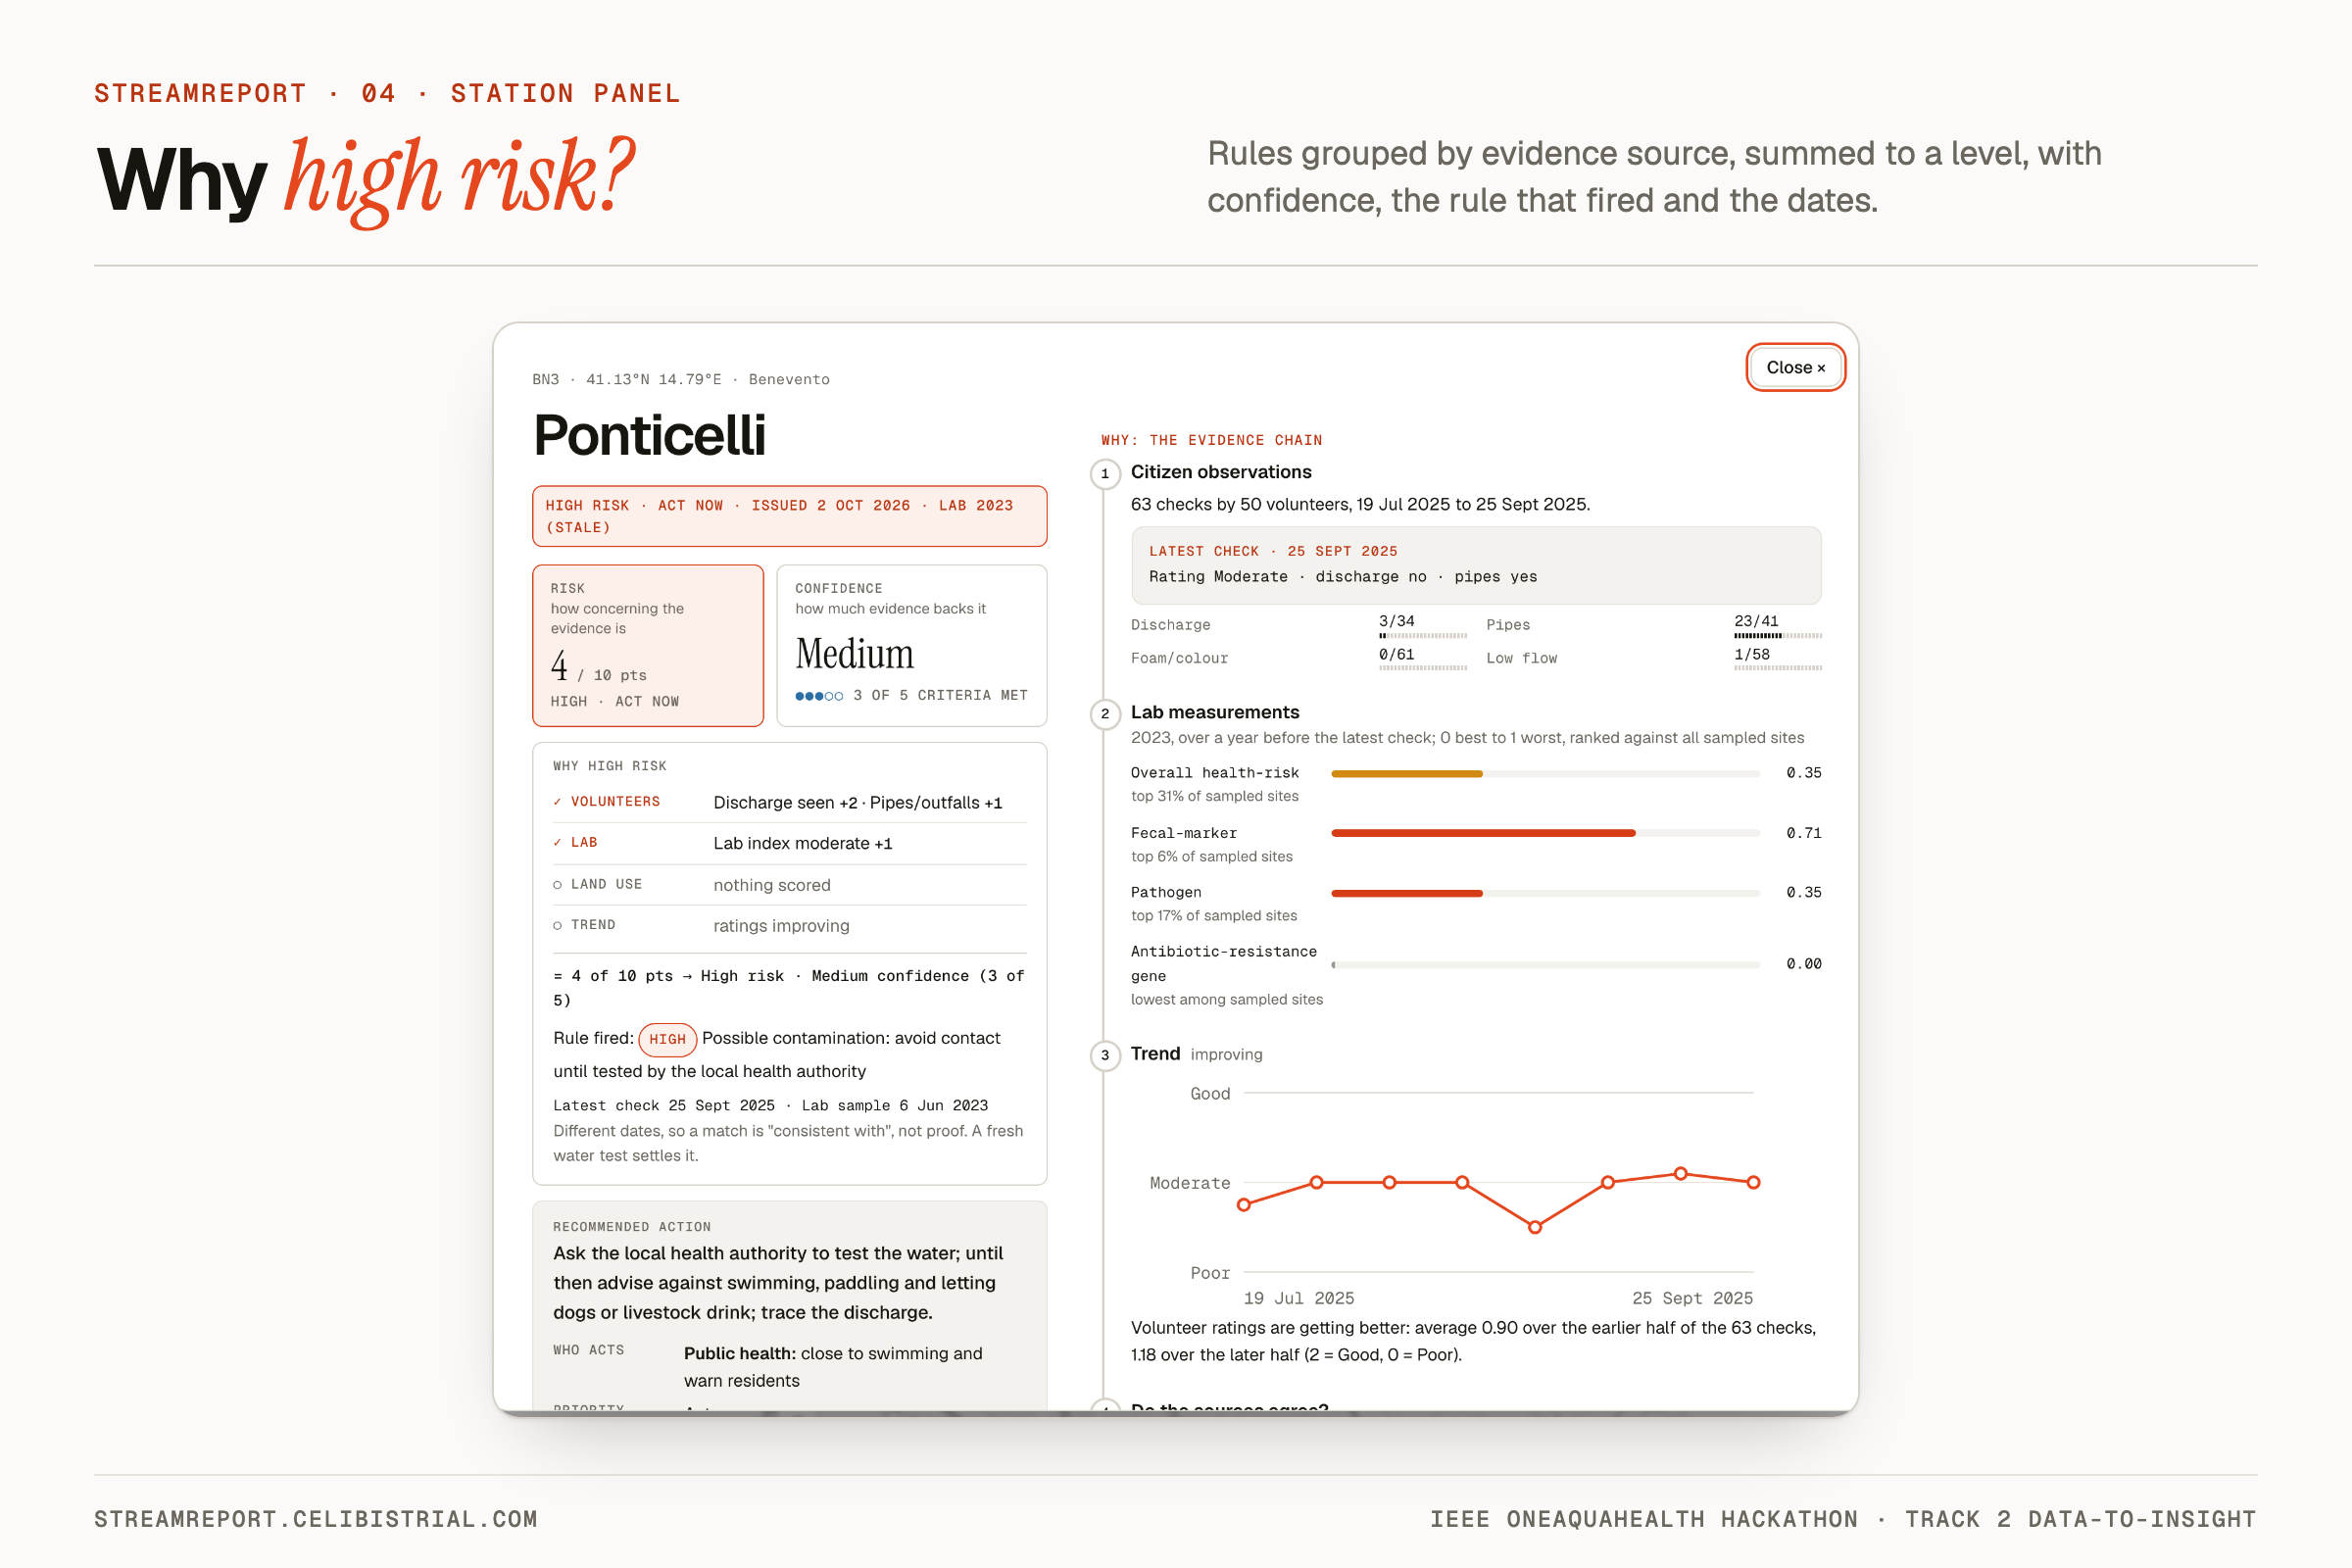
Ponticelli scores 4 of 10 (discharge +2, pipes +1, lab +1), so High risk with Medium confidence. Lab sample 2023, checks 2025.
-
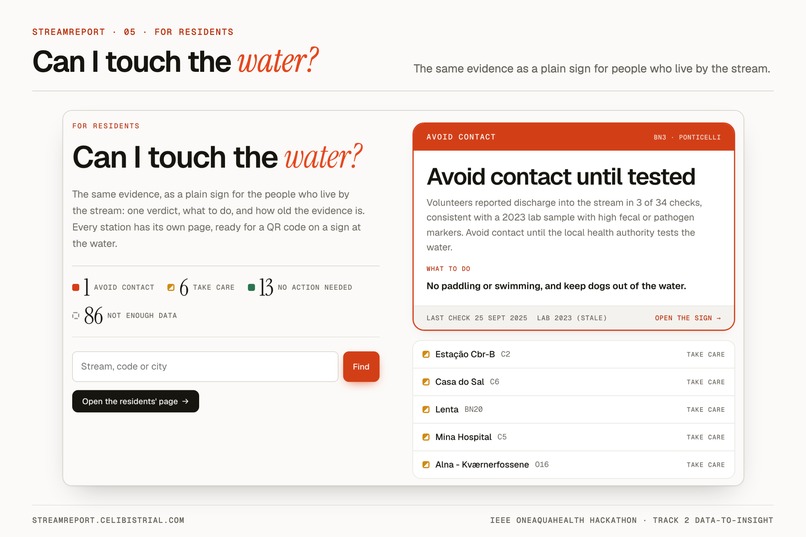
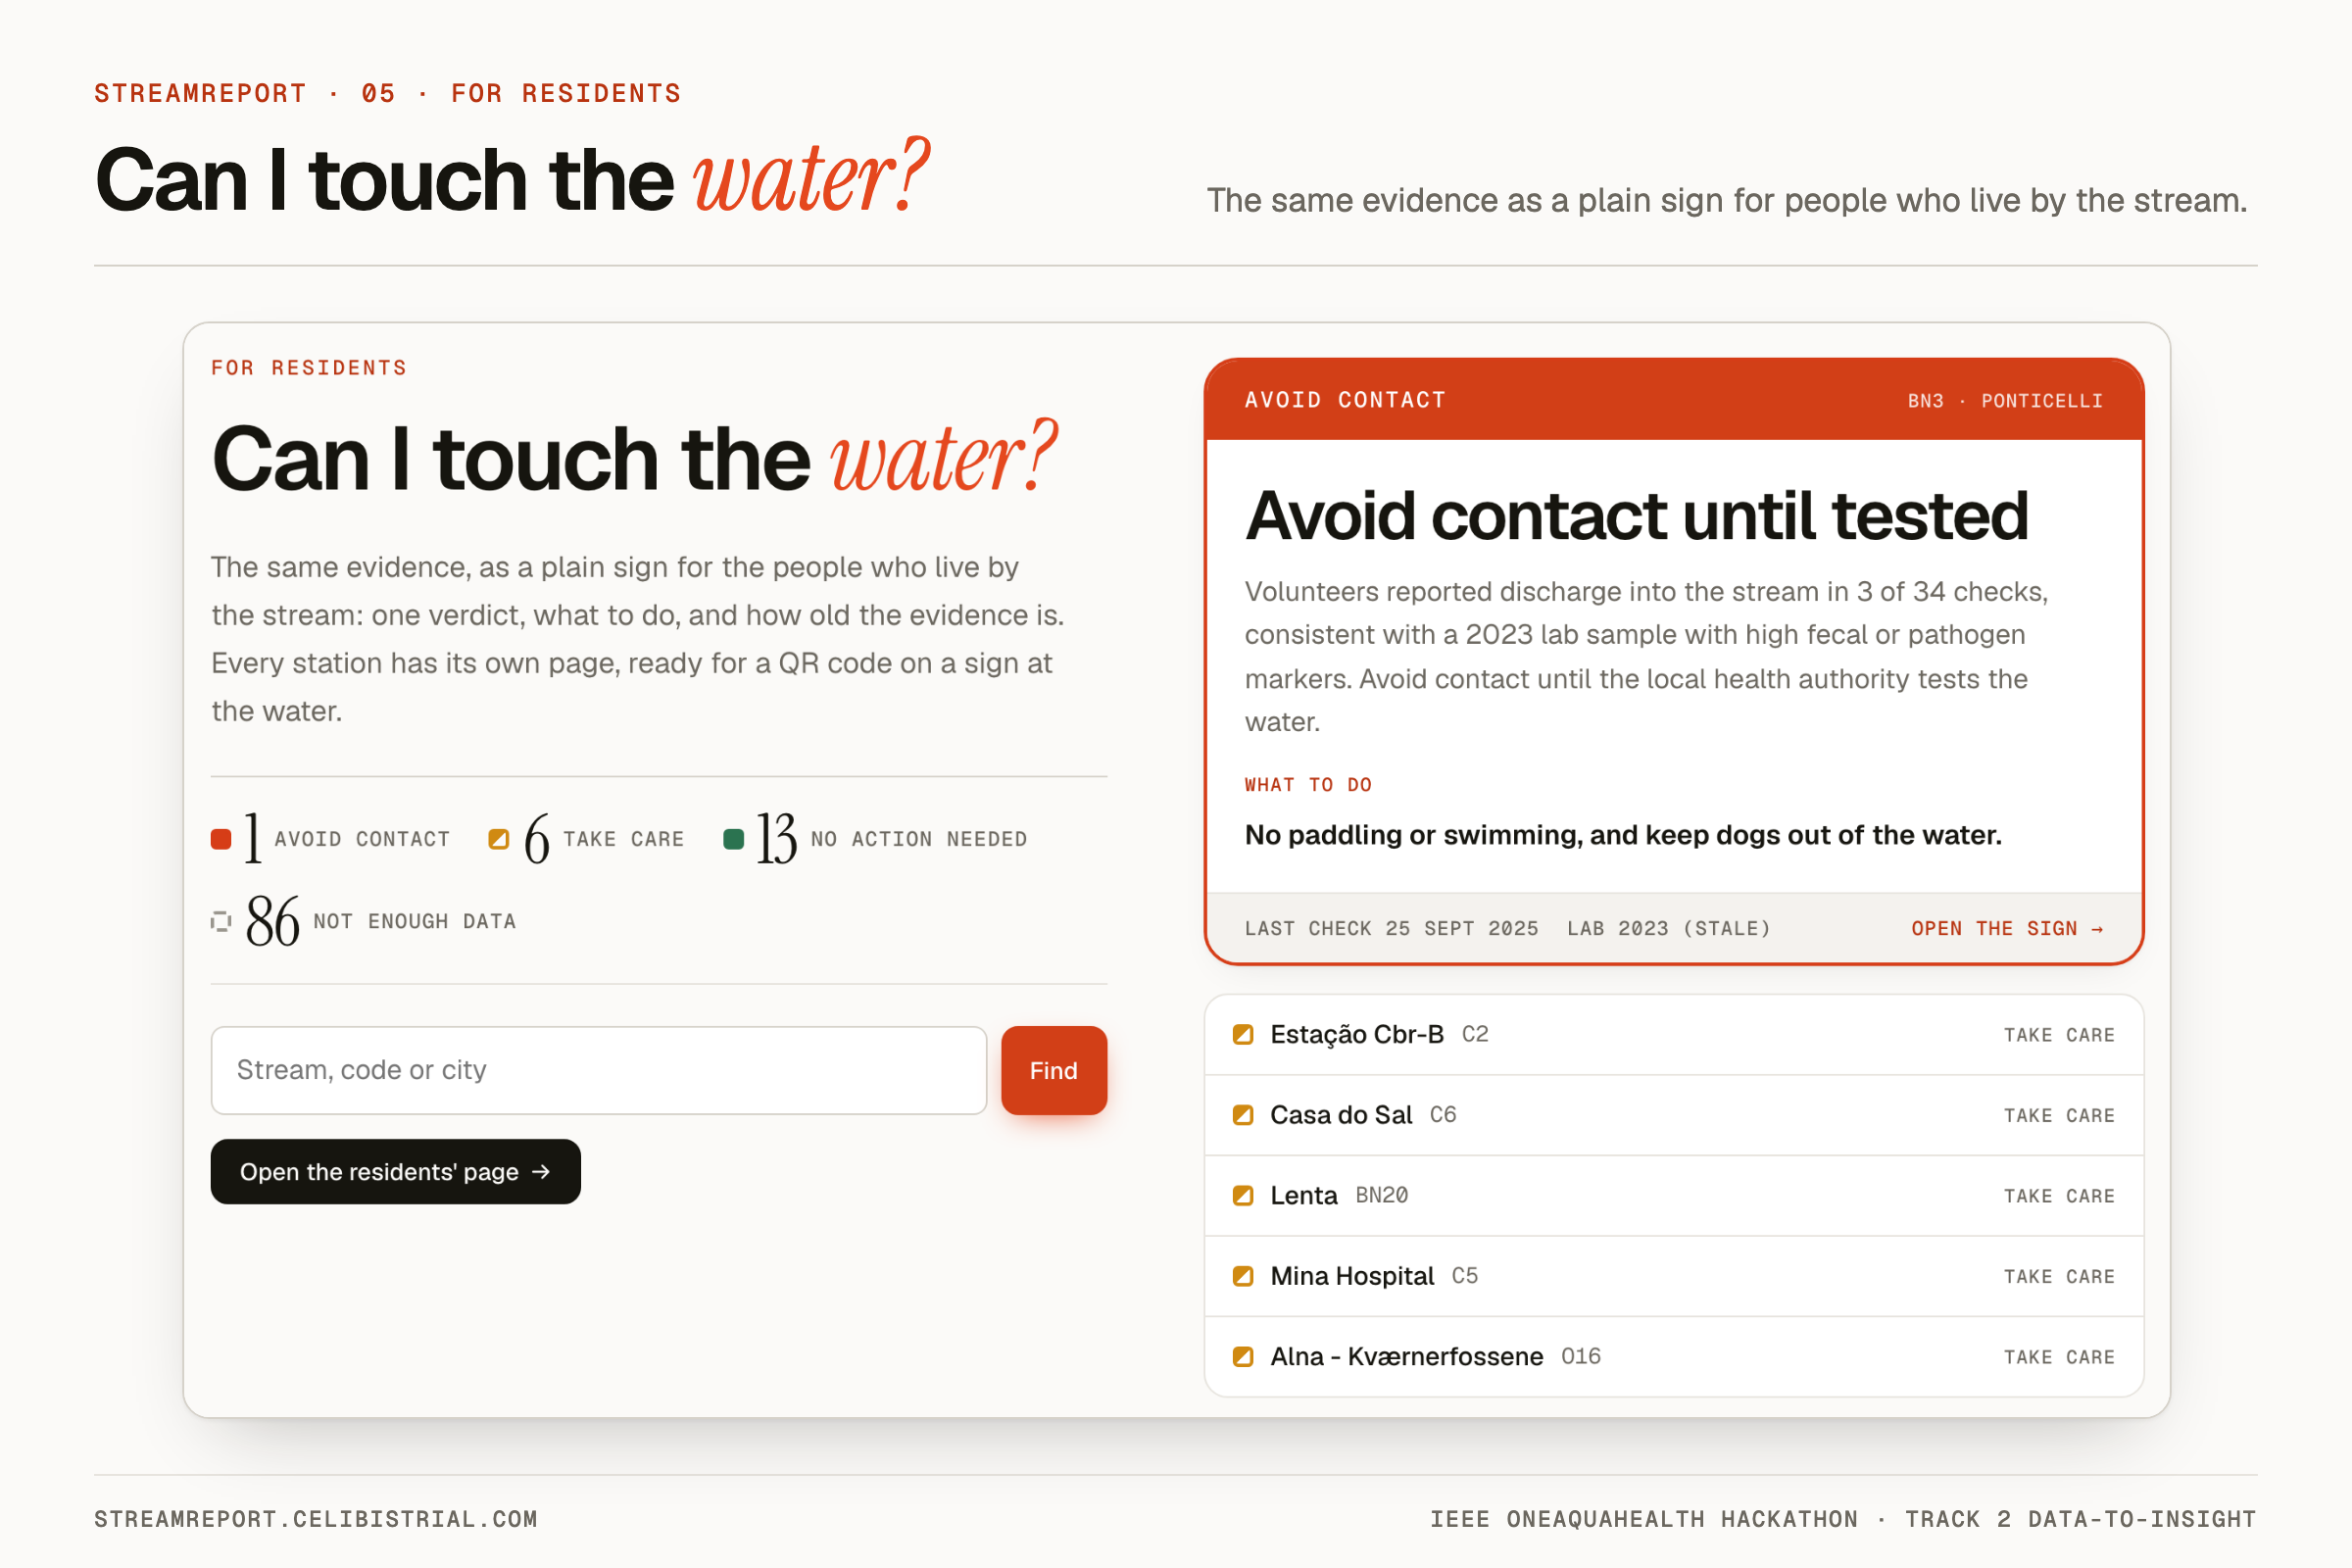
Residents see the same verdicts as signs: 1 avoid contact, 6 take care, 13 no action needed, 86 not enough data.
-
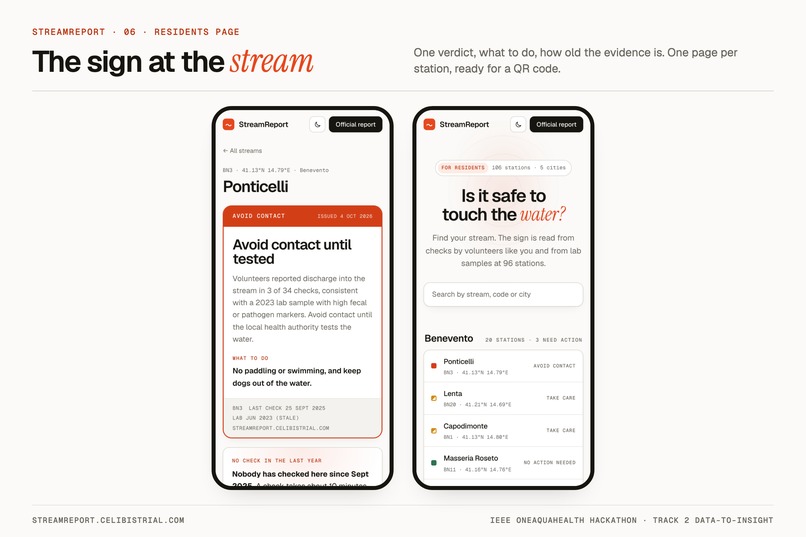
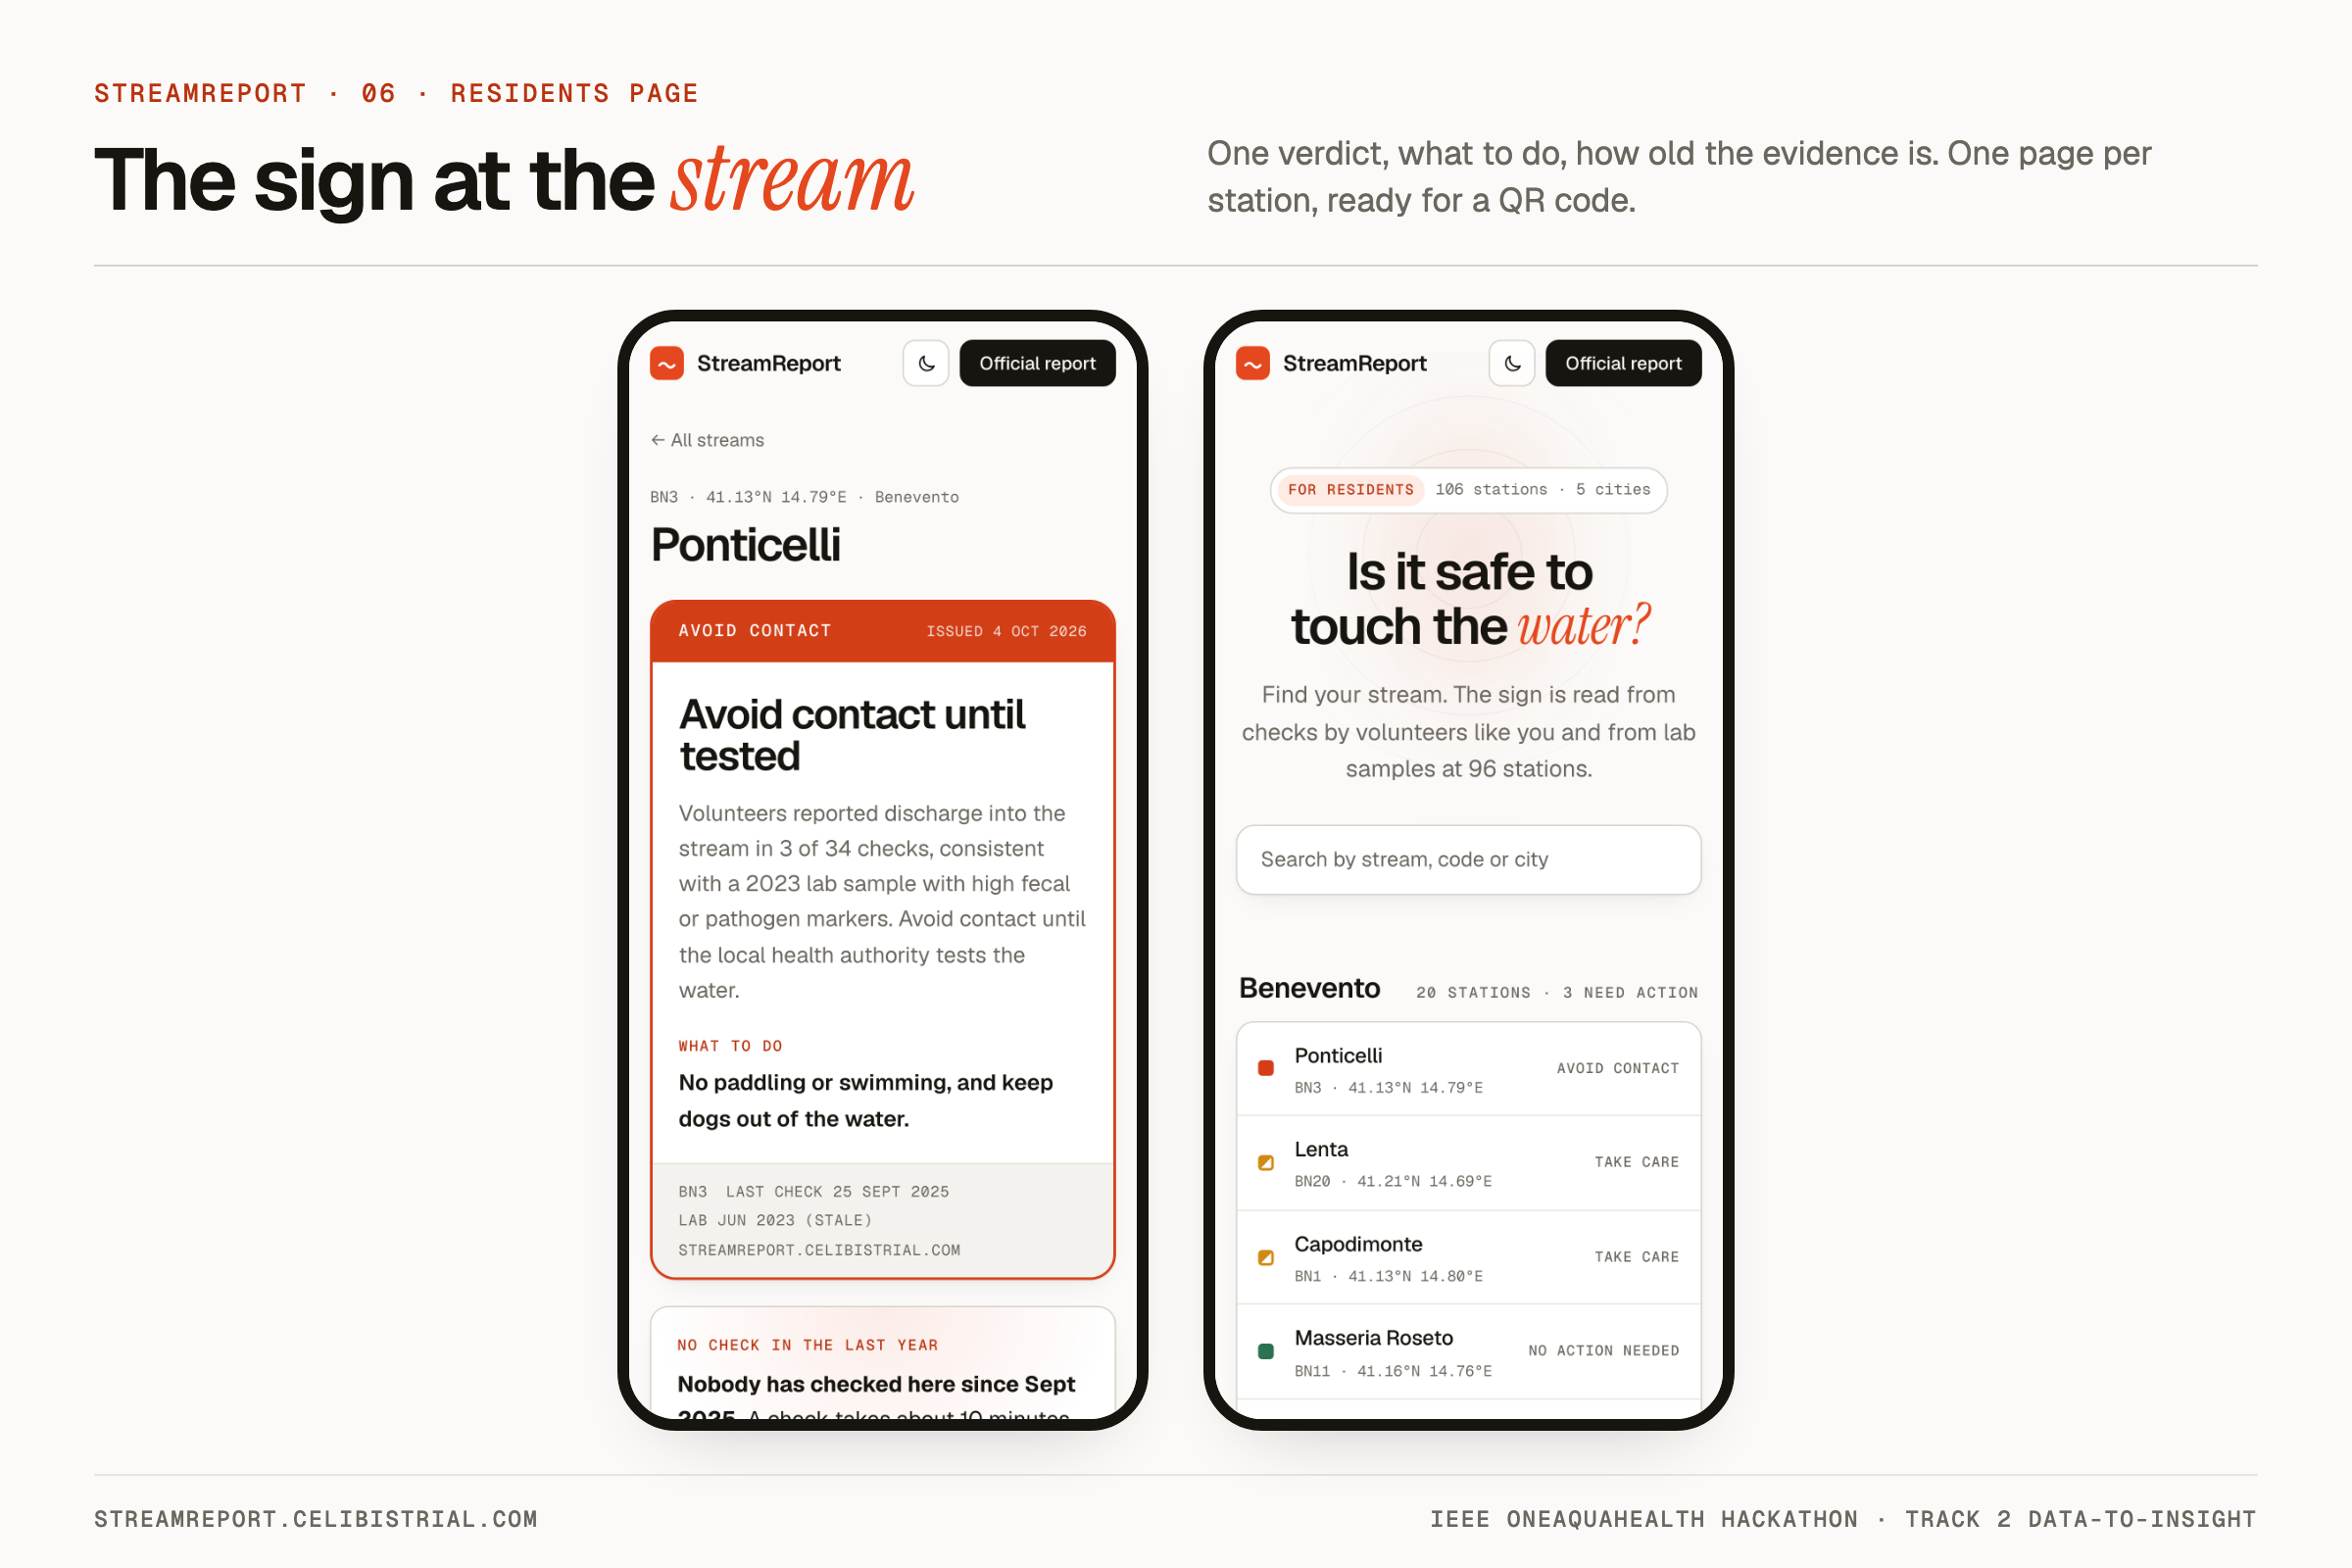
Each stream gets a page for a QR code at the water, with the verdict, what to do and how old the evidence is.
-
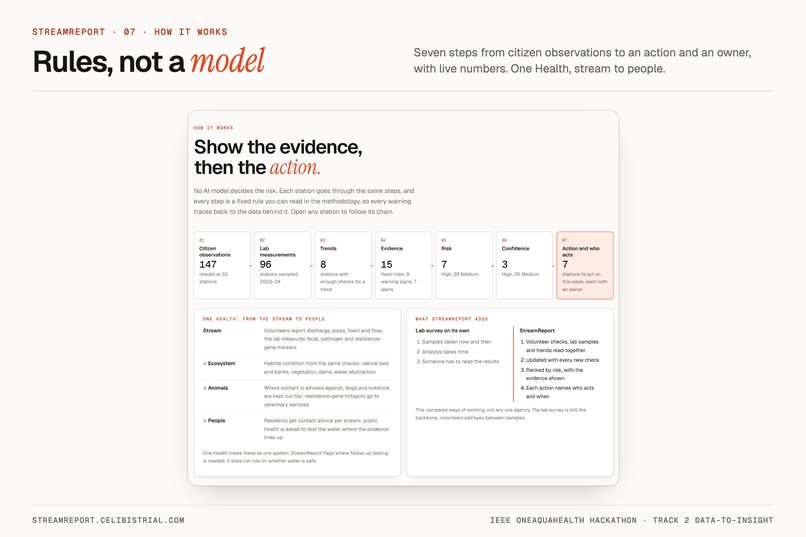
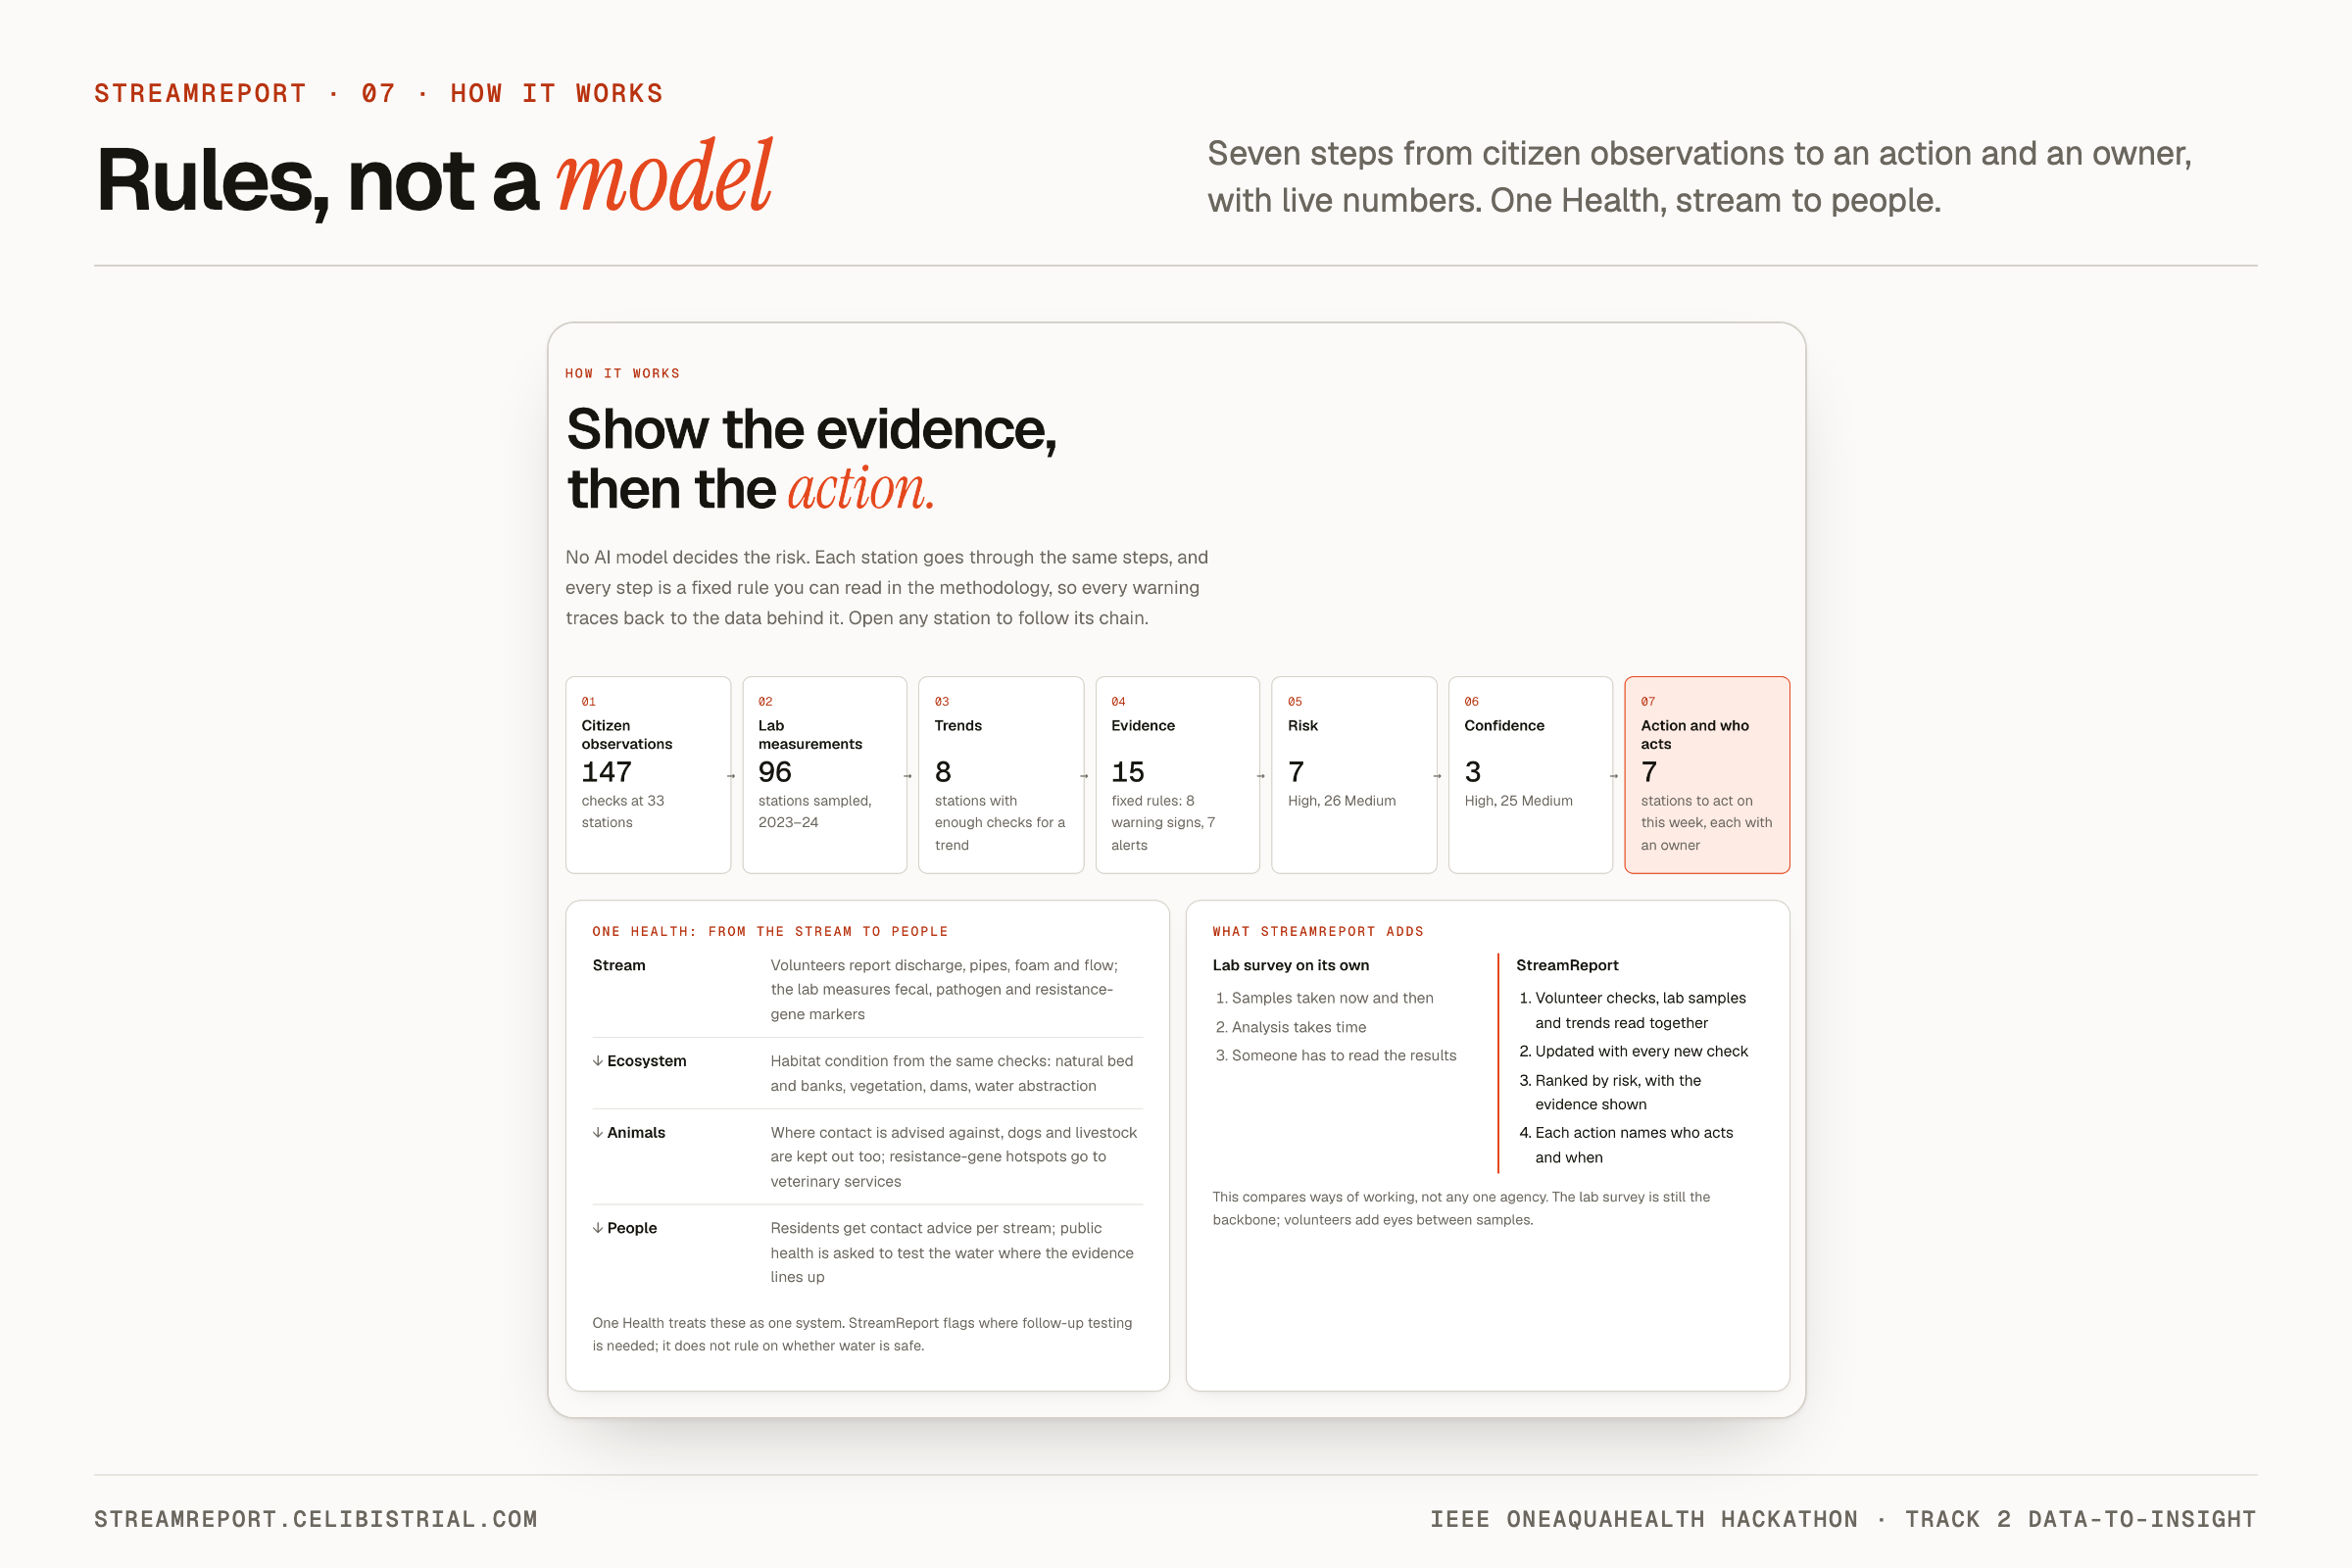
15 fixed rules, and no AI model, turn 147 checks and 96 lab samples into 7 actions, each with an owner.
-
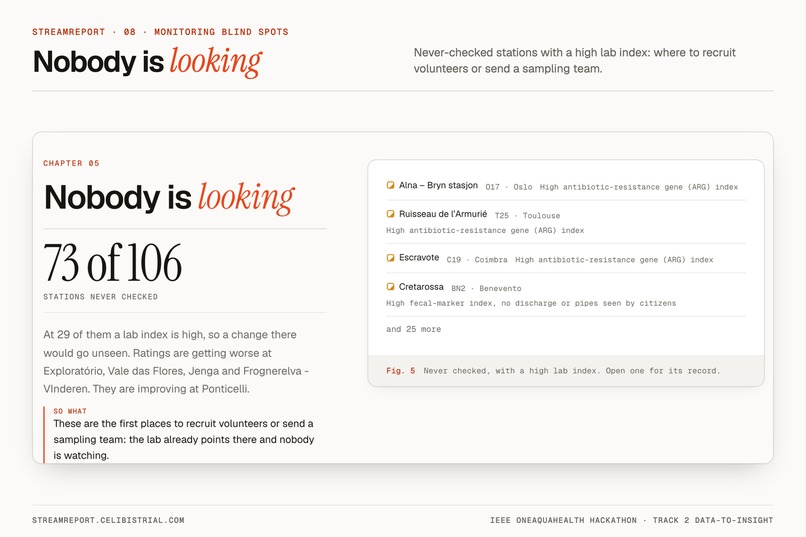
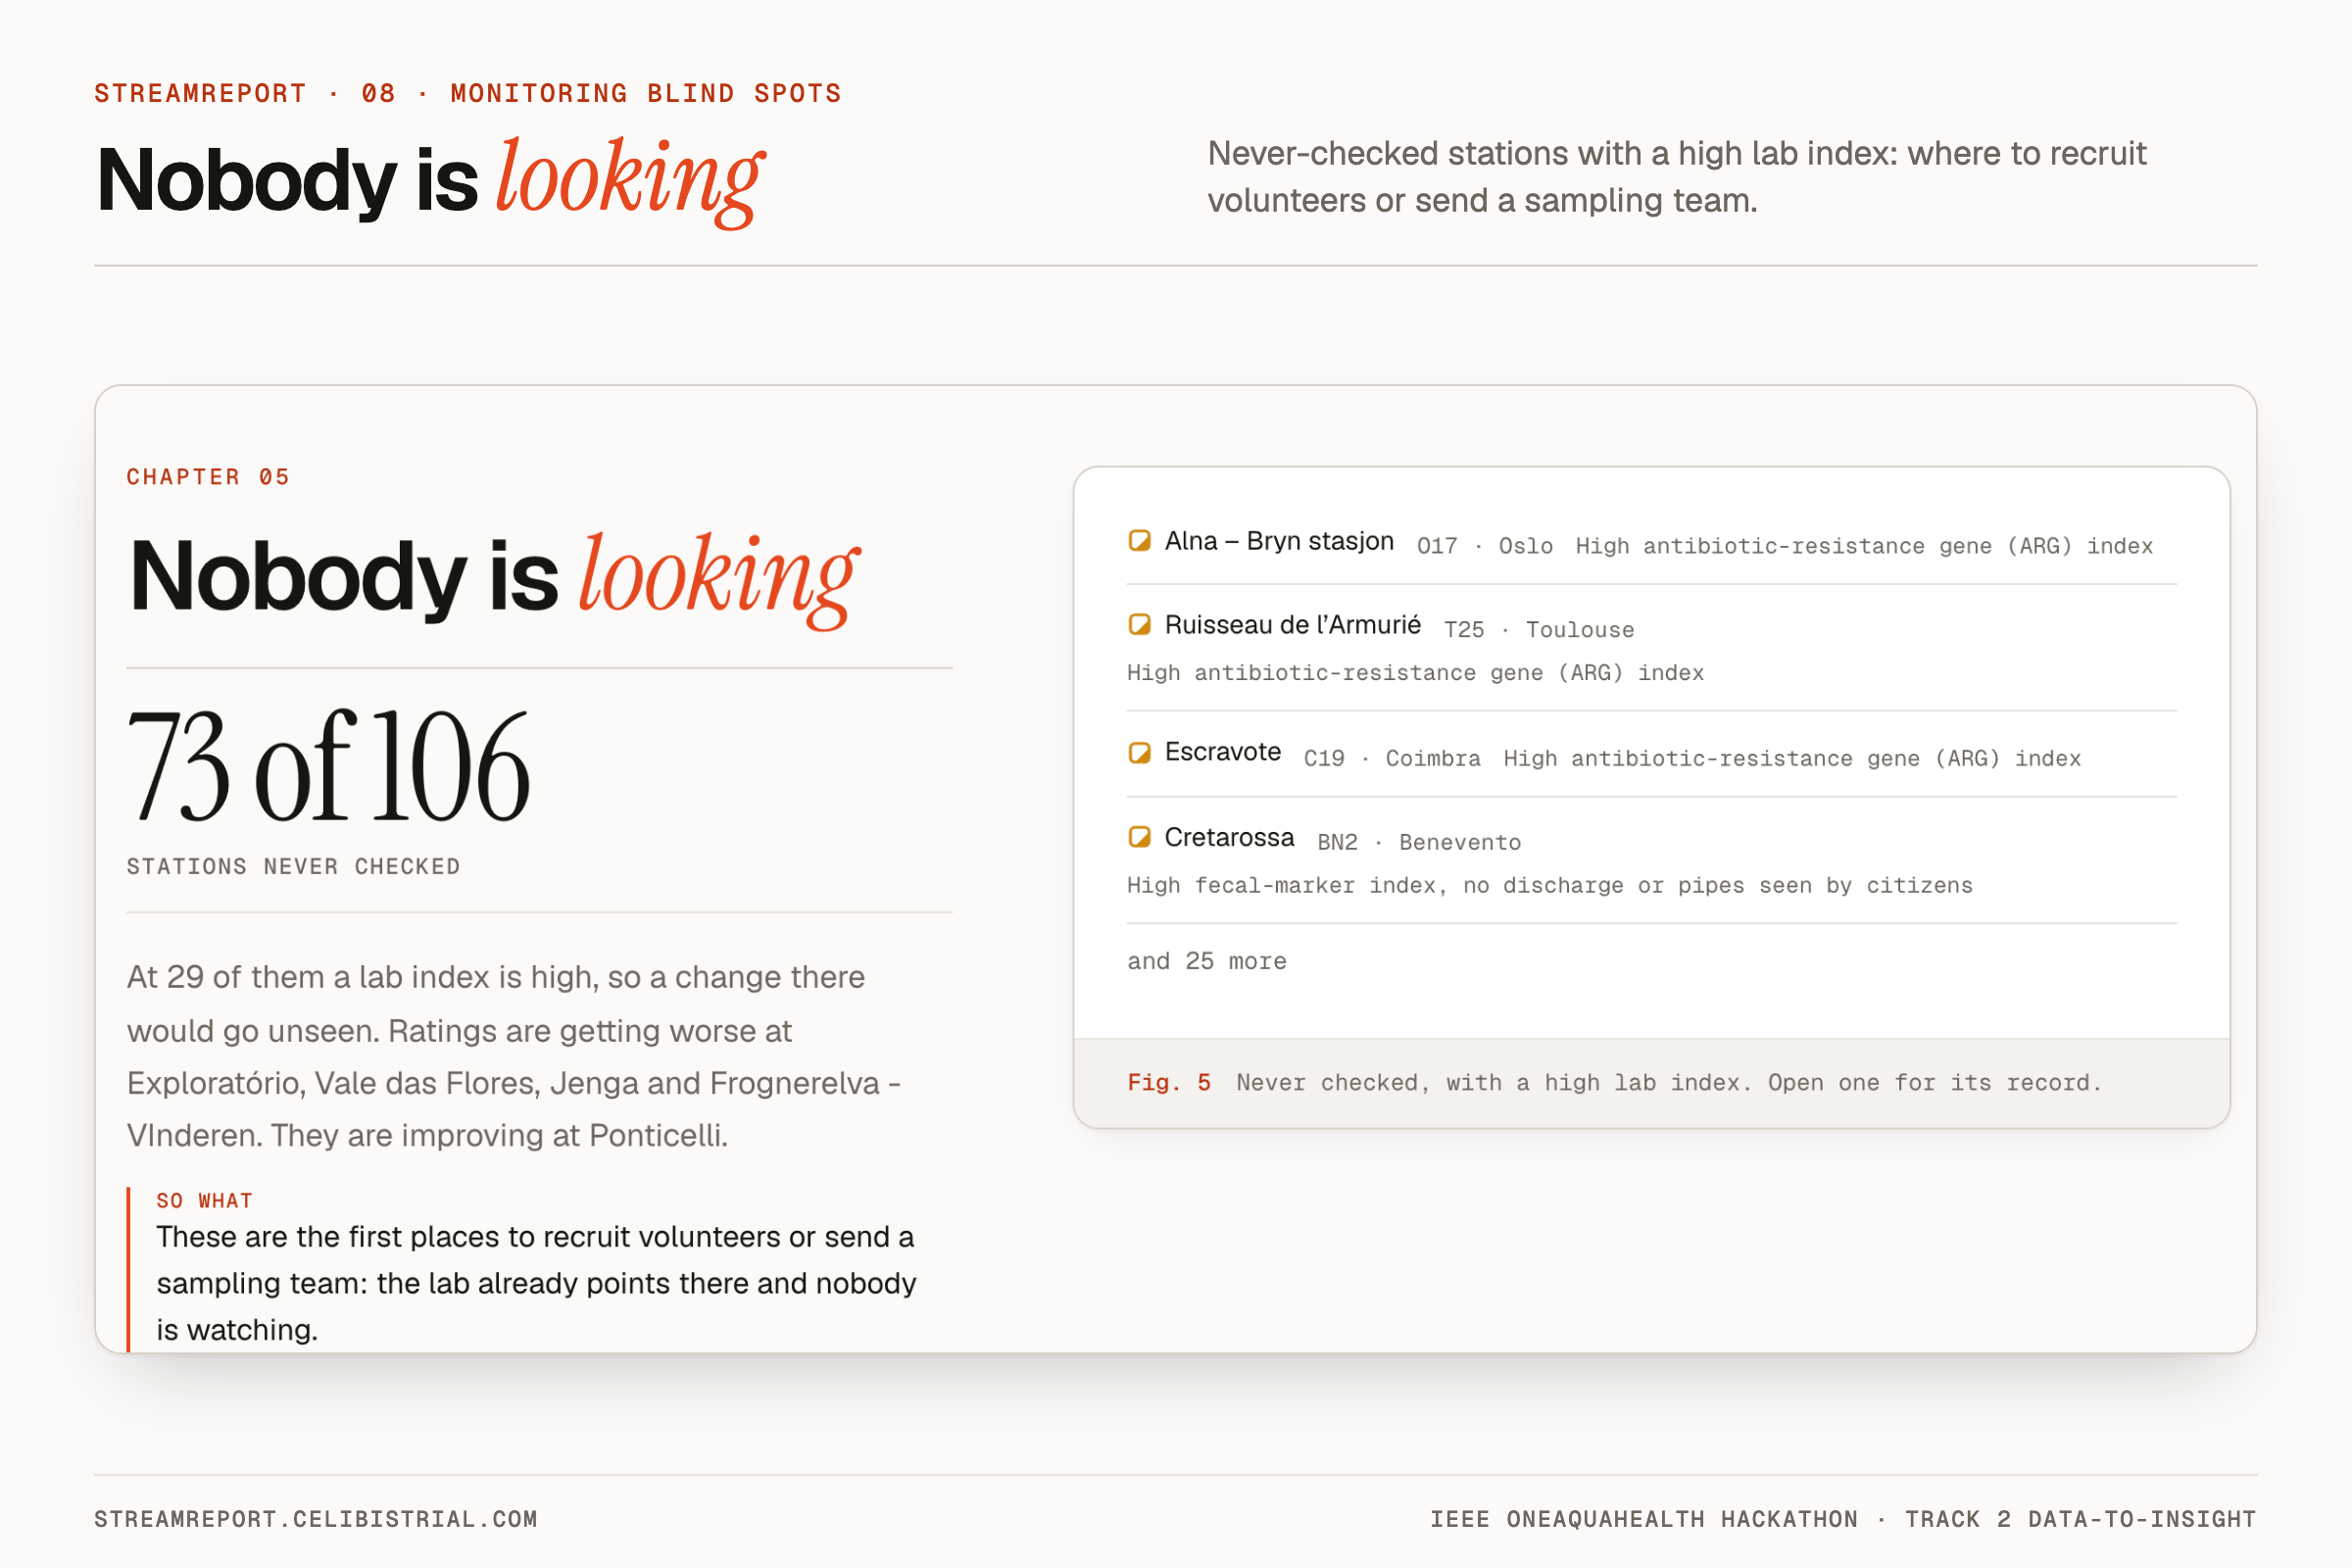
73 of 106 stations have never been checked and 29 of them have a high lab index, so recruit volunteers there first.
-
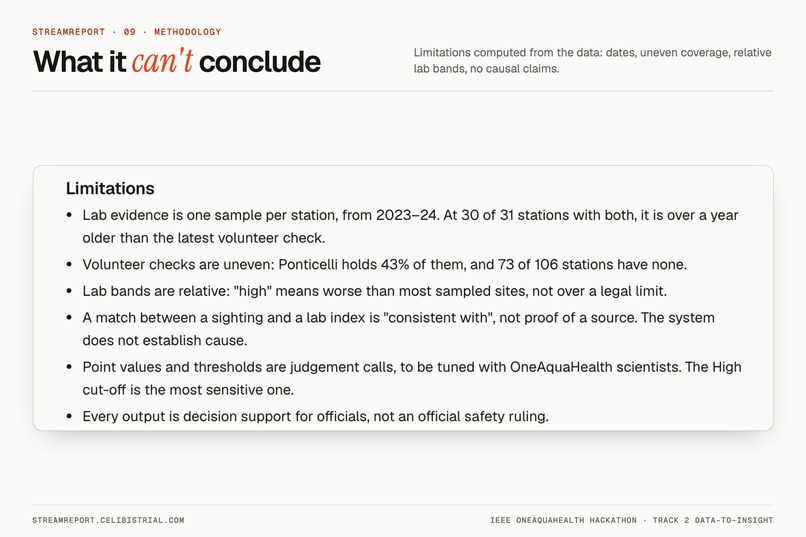
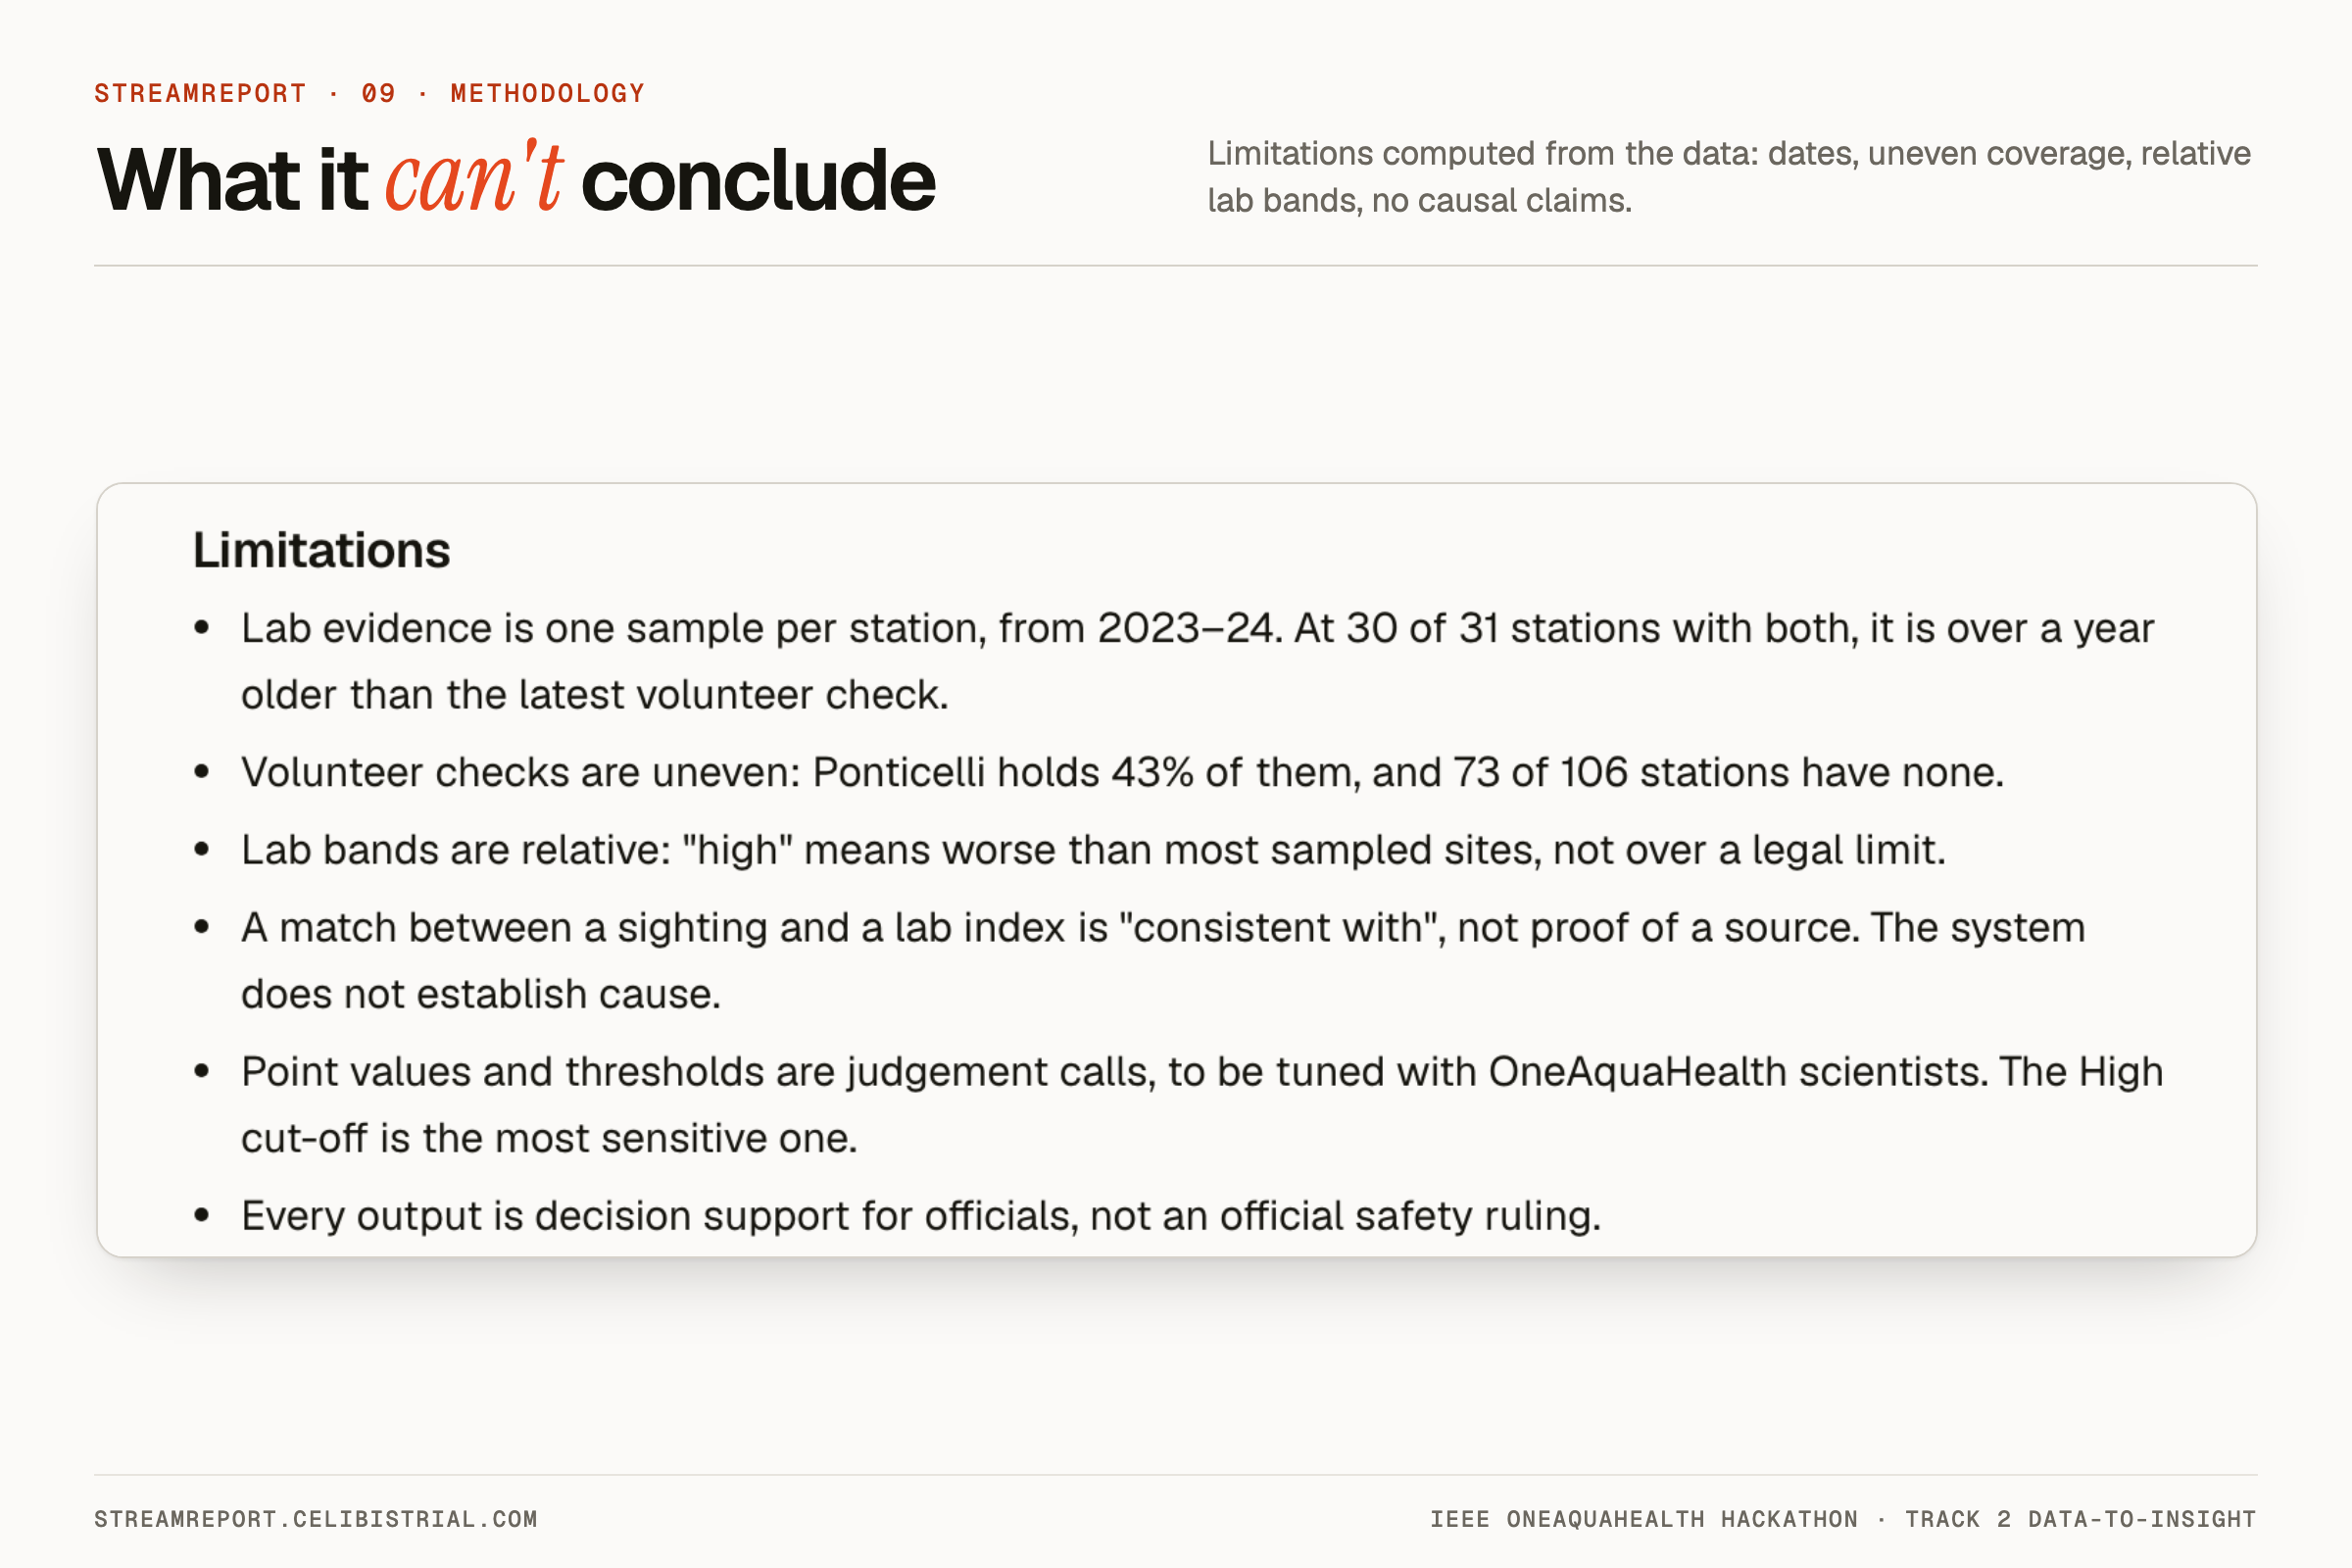
The methodology lists what it can't conclude. At 30 of 31 stations with both, the lab sample is over a year older than the latest check.
Live demo · Residents' page for one stream · Source code on GitHub
Inspiration
I went through the OneAquaHealth Hub tools and the public API expecting chemistry readings I could compare against thresholds. Instead, citizens answer a short form: is the water muddy or foamy, are pipes/outfalls present, is anything discharging into the stream, and what is their overall impression. Separately, a 2023–24 lab campaign scored a fecal-marker index, a pathogen index and an antibiotic-resistance gene (ARG) index at nearly every site. The two datasets describe the same streams but nobody puts them side by side. Volunteers reporting discharge at BN3 Ponticelli is consistent with an earlier lab sample there whose fecal-marker index is in the top 6% of sampled sites. It doesn't prove anything on its own, but it tells the health authority where to test first.
The problem
City officials, water utilities and public-health services can't act on raw form answers and 0–1 scores spread across three endpoints. Citizen scientists send in checks and never hear what happened to them. The data exists, but it doesn't reach the people who decide.
What it does
For officials (the report page). The first screen shows how many streams need action now ("7 streams need action now" across all cities, "3 Coimbra streams need action now" for one city), with a strip naming each of them. City tabs stay pinned at the top and switch everything to one city.
Each chapter ends with a So what line: what the number means for a city (the never-checked stations with a high lab index are where to recruit volunteers or send a sampling team first).
Right under it: an overview (stations by risk level including "no data", priority actions, alerts, and what changed in the last 90 days, computed by rebuilding the report from older checks and diffing it), then Act this week: every need-action station with its staff gauge (risk points against the Medium and High thresholds), a confidence level, the primary concern, who should act (e.g. Public health: close to swimming and warn residents) and a suggested timeframe. A How it works section shows the decision chain with live numbers (citizen observations → lab → trends → evidence → risk → confidence → action) and why stream health matters in One Health terms.
Confidence is separate from risk: it counts five fixed criteria (enough checks, a recent check, a lab sample, a lab sample close in time, volunteers and lab agreeing). It is not a probability; a High-risk station with Low confidence says "confirm on site first".
Below that, the page is a short data story in five chapters, each with one headline number beside a captioned figure, and one map that moves into the chapter you are reading and changes state with it:
- What volunteers logged: 147 checks, but only 33 of 106 stations have any check.
- One stream, one day: 63 of 147 checks are at BN3 Ponticelli, 51 of them on 23 Sept 2025; the map flies there and one real check is shown as logged.
- Where lab and volunteers agree: a 2x2 of the 31 stations with both a lab sample and a check: agree at 4, lab high with no source seen at 7, volunteers saw a source the lab missed at 6.
- Two clocks: lab samples end in Aug 2024, checks run to Oct 2026, 26 months later, so matches are "consistent with", not proof.
- Nobody is looking: 73 of 106 stations have never been checked; at 29 of them a lab index is high. Then: log a check, open the full record, or copy a plain-text memo.
Every number, name and date in the story comes from one tested function, story(report, sites, records), run on the stations in view: switch to Coimbra and the busiest stream becomes Vale das Flores; in Ghent the agree grid hides because fewer than 4 stations have both kinds of evidence. A side drawer opens for any stream (click a strip item, a row, a map mark or a table row; ?site=C5 deep-links): risk and confidence, then Why high risk, which groups the scored rules by the evidence they read (for Ponticelli: volunteers +3, lab +1, land use and trend nothing, so 4 of 10 is High, confidence Medium 3 of 5), names the rule that fired, and puts the latest check date next to the lab sample date ("consistent with", not proof, when they are over a year apart); then the recommended action with who acts and when, then the evidence chain: citizen observations, lab indices as "top X% of sampled sites", the rating trend, whether volunteers and lab agree, the score rule by rule ("How is this calculated?"), and the confidence criteria.
After the story, the full station record has five collapsed sections:
- All alerts: One Health alerts that connect what citizens see in the stream to risk for people and animals. For example, Possible contamination: avoid contact until tested by the local health authority fires only where citizens reported discharge into the stream at least twice (or once within 12 months of the lab sample) and the lab fecal-marker or pathogen index is in the top 20% of sampled sites. It says "consistent with a 2023 lab sample", not "confirmed": the lab sample is older than the sightings. Each alert names its evidence and the action. Alerts that rest on the 2023 lab survey alone (high ARG index, high fecal-marker index with no visible source, no citizen checks) are grouped into one alert per city with the streams listed inside, so the list is 11 alerts rather than 43; each stream still shows its own alerts in its detail panel.
- All streams: the full ranking, with low-risk streams folded away.
- Full written briefing: a plain-language summary with ordered actions per agency, with a Copy button for email.
- Methodology: data sources, what volunteers record, how checks are validated, the risk and alert rule tables (generated from the same code that scores the sites), the confidence criteria, agreement classes, how risk becomes an action and timeframe, and the limitations (one old lab sample per station, uneven checks, relative lab bands, no claim of cause, decision support rather than a safety ruling).
- Data quality: which checks have problems (checks logged more than 5 km from their site, which are excluded from scoring; water height probably typed in cm) so they can be fixed at the source.
Load your own data (footer) rebuilds the report from an export of the Citizen Science App, and the PDF button prints every alert and every stream through the browser.
For residents: a full section of the home page, "Can I touch the water?", shows how many streams carry each label, the live sign for the most urgent one, and a search. The residents' page lists streams by city, worst first, each with one label (Avoid contact / Take care / No action needed / Not enough data), plus search. The labels come from the same verdict() function as the official count, so "Avoid contact" plus "Take care" always equals the number of streams that need action. Open a stream and the first thing you see is one verdict in plain words, with advice for people and dogs. Then a Log a check (10 min) button into the OneAquaHealth app (made prominent when nobody has checked for a while), what volunteers and the lab found with dates, a flag when that evidence is over a year old, and how volunteers' checks helped, ending with the loop: you check, it is read against the lab, the stream gets a sign, officials see where to test.
Who it's for
- City officials, water utilities and public-health services who need to know where to send an inspector, where to post signs, and what to tell residents.
- Citizen scientists who want to know whether their stream is healthy and whether their checks mattered.
- OneAquaHealth coordinators who need to see which sites have no volunteers yet.
Expected impact on ecosystem and human health
This is a One Health tool: it treats the stream, the people who use it and the animals that drink from it as one system.
- Human health: possible sewage contamination and high antibiotic-resistance gene indices get flagged with concrete actions (ask the health authority to test, advise against swimming and paddling until then, review hospital and treatment-plant effluent). On the current snapshot, one site (BN3 Ponticelli in Benevento) has repeated citizen discharge reports consistent with a 2023 lab sample in the top 6% for the fecal-marker index.
- Animal health: contact advice covers dogs and livestock, and antibiotic-resistance alerts are routed to veterinary as well as public-health services, since resistant bacteria move between water, people and animals.
- Ecosystem health: each site gets a habitat condition summary from the same form (natural bed and banks, vegetation cover, in-stream habitats, no dams or water abstraction, no invasive plants). It is reported next to risk, not scored as risk. Pipes/outfalls, stagnant flow and falling volunteer impressions are tracked per site.
- Early warning and better monitoring: sites with high lab risk and no citizen checks are flagged so coordinators can recruit volunteers there. 73 of 106 sites have no scored citizen check yet. Citizens see what their checks led to, which gives them a reason to keep checking.
How I built it
- Data: OneAquaHealth project (ENORA API):
/api/sites/all,/api/citizens/submissions,/api/resilience-map/health-risks,/api/resilience-map/urban-parametersand the app's code lists, snapshotted. Before committing, I removed photo and video fields, replaced observer ids with per-station ids, rounded positions to about 100 m and cut timestamps to the date. Approval from the OneAquaHealth data steward to republish is still pending (see Data use & privacy in the README). - Validation (
parse.js): every check is validated against the app's own answer codes, and implausible values are flagged rather than silently dropped. Checks logged more than 5 km from their site are excluded from scoring and listed. - Rules (
insights.js): risk points per site from citizen, lab and urban signals, and seven One Health alert rules (the three lab-only ones grouped per city in the alert list). Each rule returns the evidence string that triggered it. Lab indices are banded by percentile rank among sampled sites, and only the overall index scores points (its components drive alerts), so the lab is not counted three times. All thresholds sit in one object, and a sensitivity test moves each ±20%. - Briefing (
summary.js): template sentences filled only with sites, alerts and evidence from the report. - UI: plain HTML, CSS and JavaScript modules, Leaflet for the map, inline SVG for trend lines, print CSS for the PDF. No framework, no build step, no backend. Hosted as static files.
- Tests: 29
node:testcases, including ones that run the whole pipeline on the real snapshot, check that the briefing only names real sites, and check that the headline, chips, act cards, table and citizen verdicts agree for every city.
I chose rules over an LLM on purpose. An official who is about to tell a town to stay out of a stream has to be able to say why, and "the model said so" doesn't work for that. Every warning in StreamReport can be checked against the rule table and the data.
Challenges
- The data wasn't what I planned for. My plan assumed pH, nitrate and E. coli readings checked against regulatory limits. The real data is categorical citizen answers plus lab scores that are scaled 0–1 across sites. I rebuilt the scoring around that. Because the lab indices are min-max scaled, I band them by percentile rank ("top 20% of sampled sites") so nobody reads them as legal limits.
- Sparse, uneven citizen data. 63 of the 147 scored checks come from one site (BN3). Most sites have zero or one check. I made citizen-only alerts require two sightings, required 4 visits before calling a trend, and treated "nobody is watching" as a finding in its own right.
- Messy entries. 36 of 165 checks have a problem: 18 logged more than 5 km from the chosen site (several in Greece for Benevento sites), water heights over 3 m in urban streams, a colour for a dry stream. The far-off checks are excluded from scoring; the rest would lose real observations if dropped, so they still count. All are listed in a Data quality section.
- Writing for two audiences. The same finding has to read as "Local health authority: test the water" for an official and "Avoid contact until it's tested, keep dogs out" for a resident, and both pages have to agree, so they share one verdict function.
Accomplishments
- It runs on the real OneAquaHealth data for all five cities.
- Every risk level, alert and briefing sentence can be traced back to a rule and a data point, and the rule tables shown in the app are generated from the code.
- The cross-check between citizen sightings and lab results is honest about time: it says "consistent with a 2023 lab sample" and flags lab evidence that is more than a year older than the citizen checks, rather than claiming confirmation.
- It's a static site with no backend, so any city or the OneAquaHealth team could host it for free.
What I learned
- Citizen observations are most useful when you combine them with another source. Alone, a single "pipes present" is weak evidence. Next to a high lab fecal-marker index, it tells the health authority where to test first.
- Saying where data is missing is as useful as scoring the data you have. "High lab risk, nobody checks this site" is an action for a coordinator.
- Explaining relative scores honestly takes deliberate wording on every screen, and so does dating every piece of evidence.
License and data
Code is MIT-licensed. Data: OneAquaHealth project (ENORA API), used under OneAquaHealth terms. The bundled snapshot is a point-in-time copy, not live data.
What's next
- Refresh nightly from the live API through a small server-side proxy.
- Tune the thresholds with OneAquaHealth scientists, and add regulatory limits where measured values exist.
- Add lab trends once sites have repeat samples.
- Send alerts to city contacts when a site turns High.
- Translate the citizen view into the five partner cities' languages, and show it in the OneAquaHealth app right after someone submits a check.
Built With
- caddy
- css3
- github
- html5
- javascript
- leaflet.js
- node.js
- oneaquahealth-api
- openstreetmap
- svg

Log in or sign up for Devpost to join the conversation.