Inspiration
Strava makes it easy to log activities, but hard to understand where people actually go at a route level. I wanted a way to see real-world usage patterns — not just individual runs or rides — so people could pick safer, more popular, and more interesting routes.
This started after repeatedly choosing empty or unsafe cycling paths just because I had no visibility into which routes were truly well-traveled.
What it does
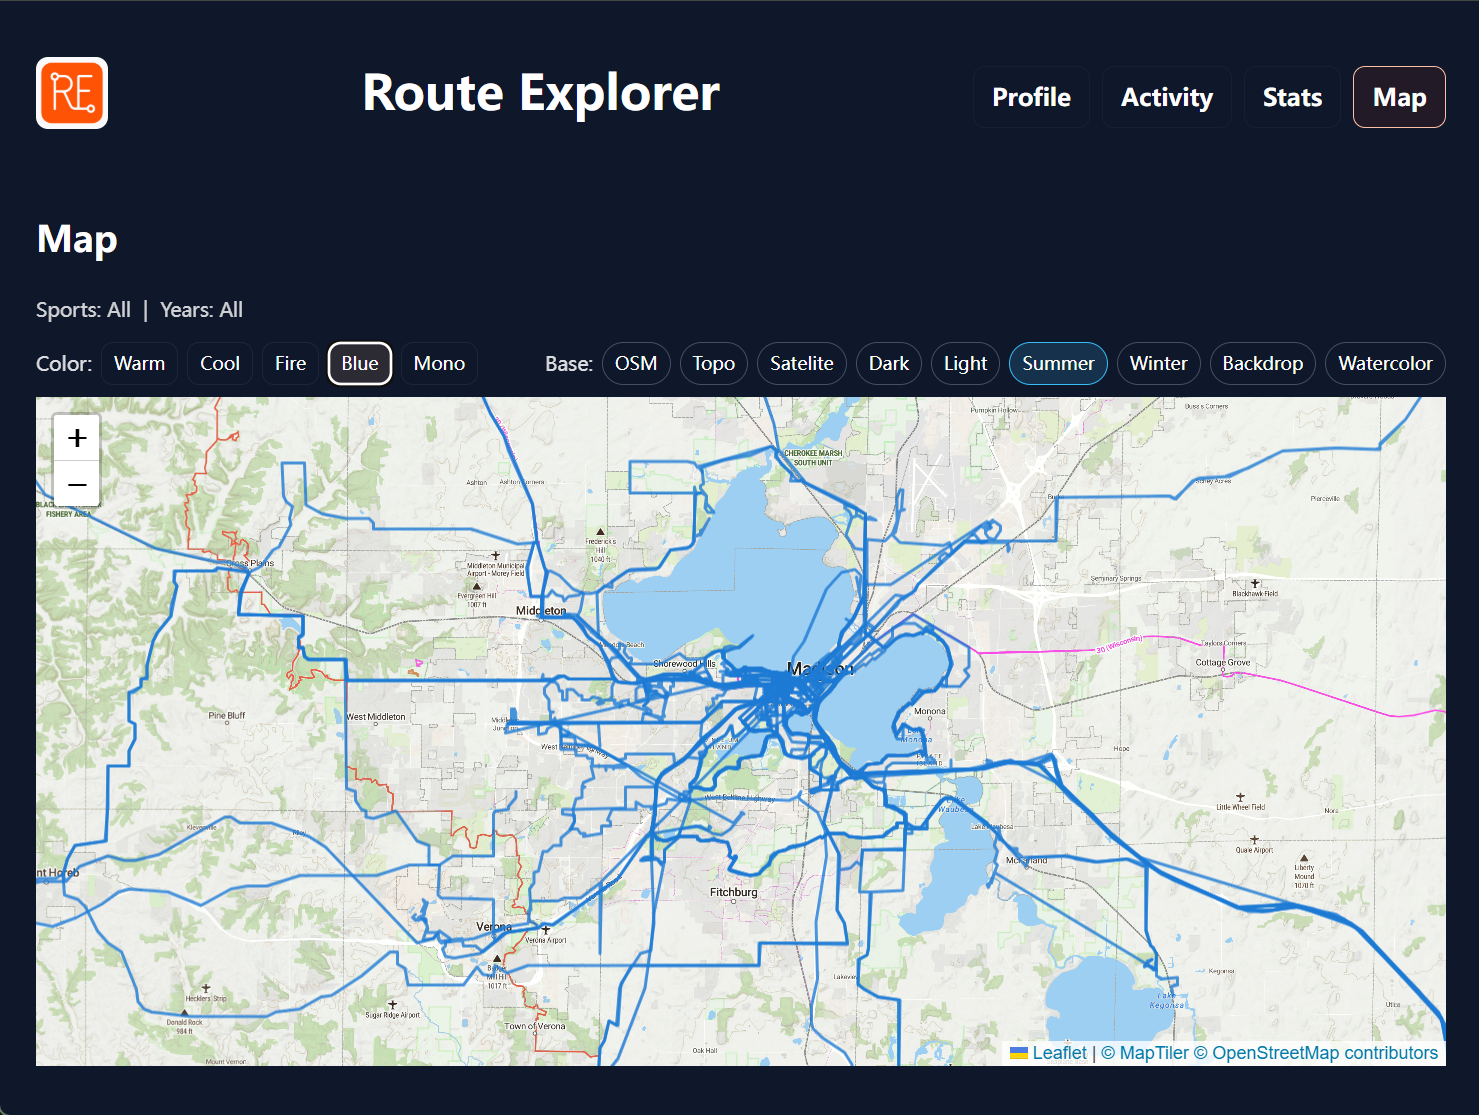
Strava Route Xplore visualizes aggregated route usage from your Strava activities.
It:
- Decodes and aggregates activity polylines into shared route segments
- Colors each segment based on how often it's traveled
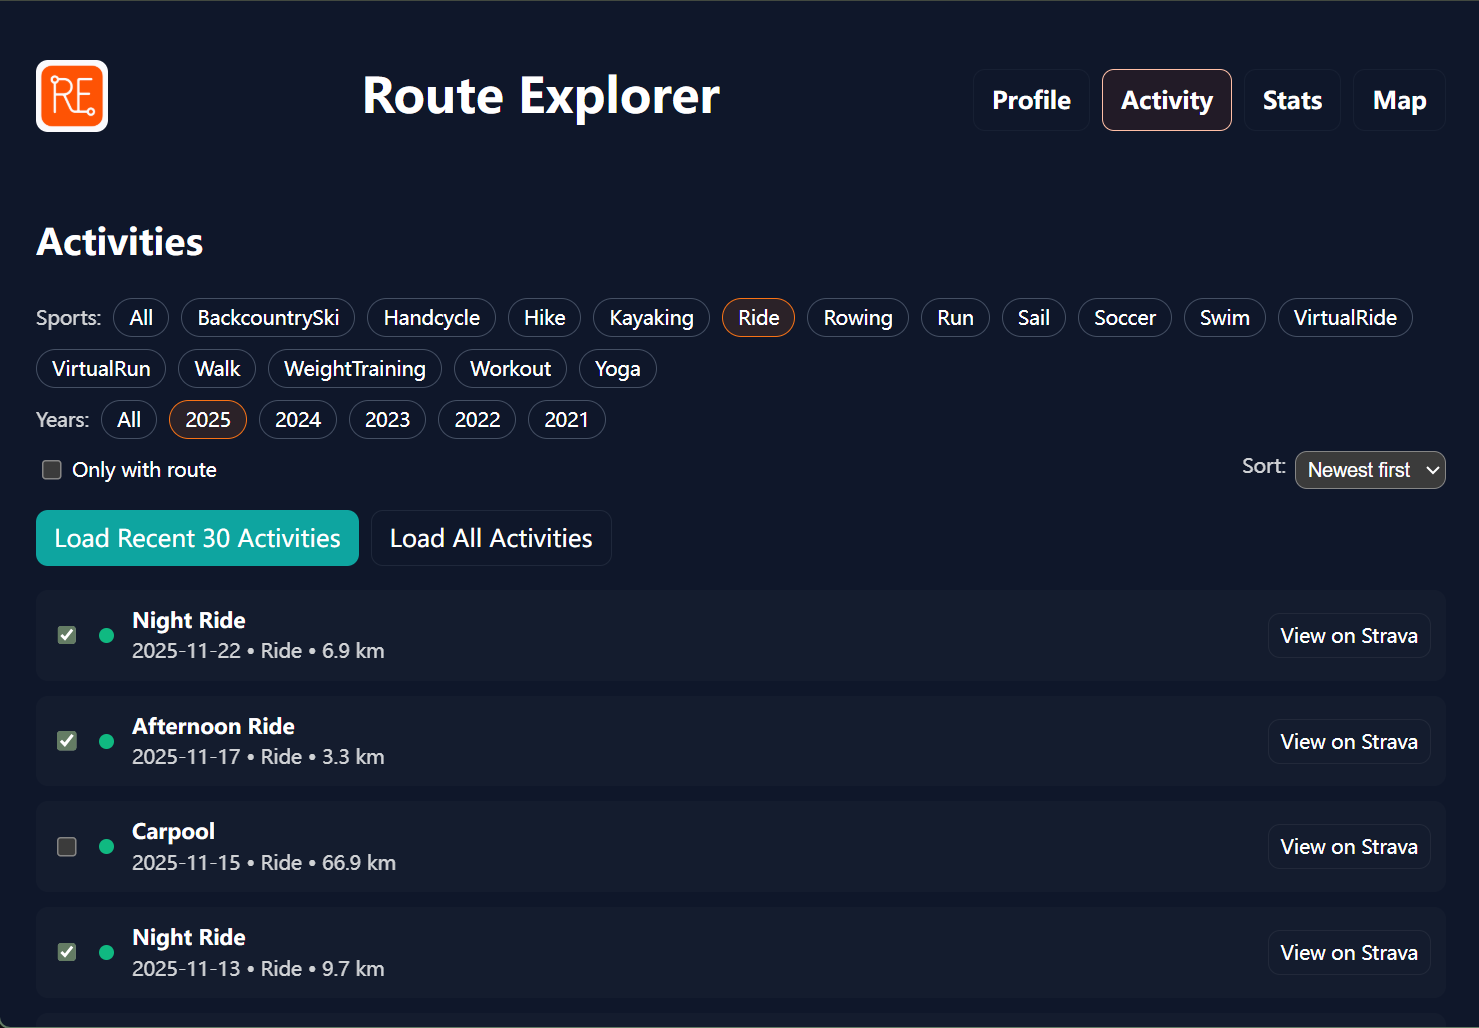
- Lets you click any point on the map to see which activities passed through it
- Supports filtering by sport, year, and other metadata
The goal: turn individual activity noise into clear route intelligence.
How we built it
Frontend
- React + Vite + TypeScript
react-leafletfor interactive mapspolylinefor decoding Strava GPS data- Client-side aggregation + caching using
localStorage
Backend
- Python + FastAPI + Uvicorn
- Handles Strava OAuth and token refresh
- Provides endpoints for activities + auth flow
APIs
- Strava API for activities + polylines
- OpenStreetMap for map tiles
Key design choice: heavy processing happens on the client to reduce backend complexity and keep the app responsive.
Challenges we ran into
- Stack overflows from recursive data processing on large datasets → refactored to an iterative approach.
- GPS noise & floating point issues → solved using coordinate quantization to merge near-identical segments.
- Strava rate limits + expiring tokens → built a refresh-token backend flow with auto-retry logic on the frontend.
- Rendering thousands of segments → optimized via aggregation and plan Web Worker + Canvas rendering for scale.
- Map re-render and fit loops → fixed with memoization + render guards.
Accomplishments that we're proud of
- Built a full end-to-end working system: auth → data → visualization.
- Implemented click-anywhere → see activities (our main “wow” feature).
- Designed a robust segment aggregation system instead of just drawing raw tracks.
- Handled real API and geospatial scaling challenges under time pressure.
What we learned
- Recursive logic doesn’t scale well in geospatial datasets — iterative + indexed solutions are more stable.
- Visual clarity matters just as much as algorithm correctness.
- OAuth flows break easily — refresh logic must be designed early, not patched later.
- Small interactions (like clicking a point to see activities) massively increase perceived value.
What's next for Strava Xplore
- Add Web Worker + Canvas renderer for large-scale performance.
- Introduce a heat legend and user-tunable smoothing options.
- Filters by time-of-day, day-of-week, and activity type.
- Shareable route visualizations and GPX export.
- Potential premium features for clubs, race organizers, and urban planners using route density data.
Long-term vision:
Become the “route intelligence layer” on top of activity platforms like Strava.


Log in or sign up for Devpost to join the conversation.