-
-
Intro Page
-
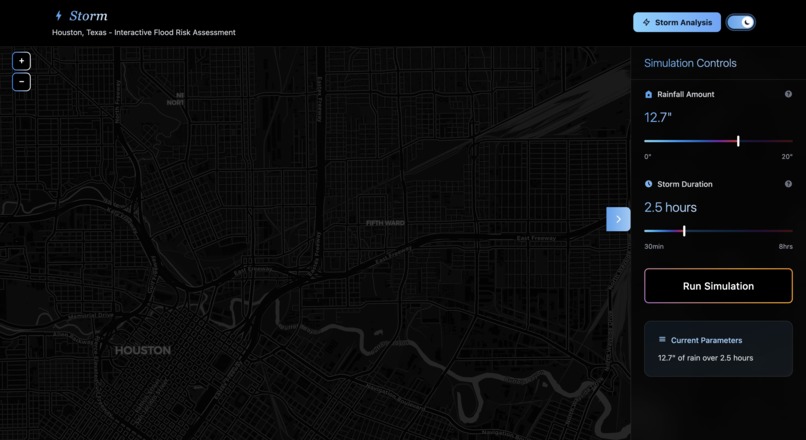
Flood Simulation Page
-
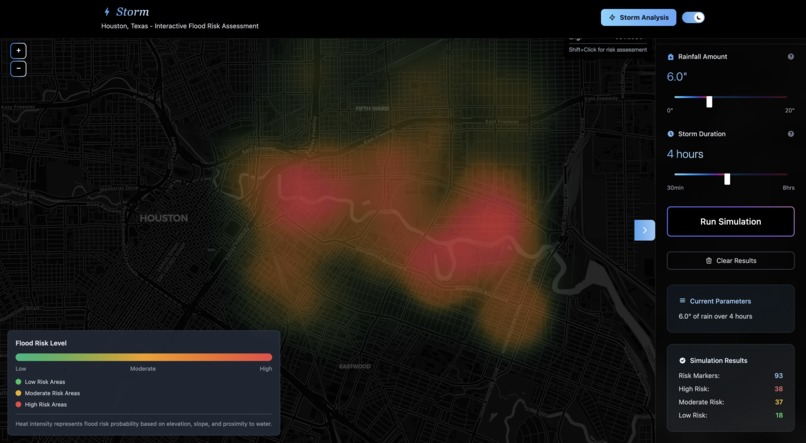
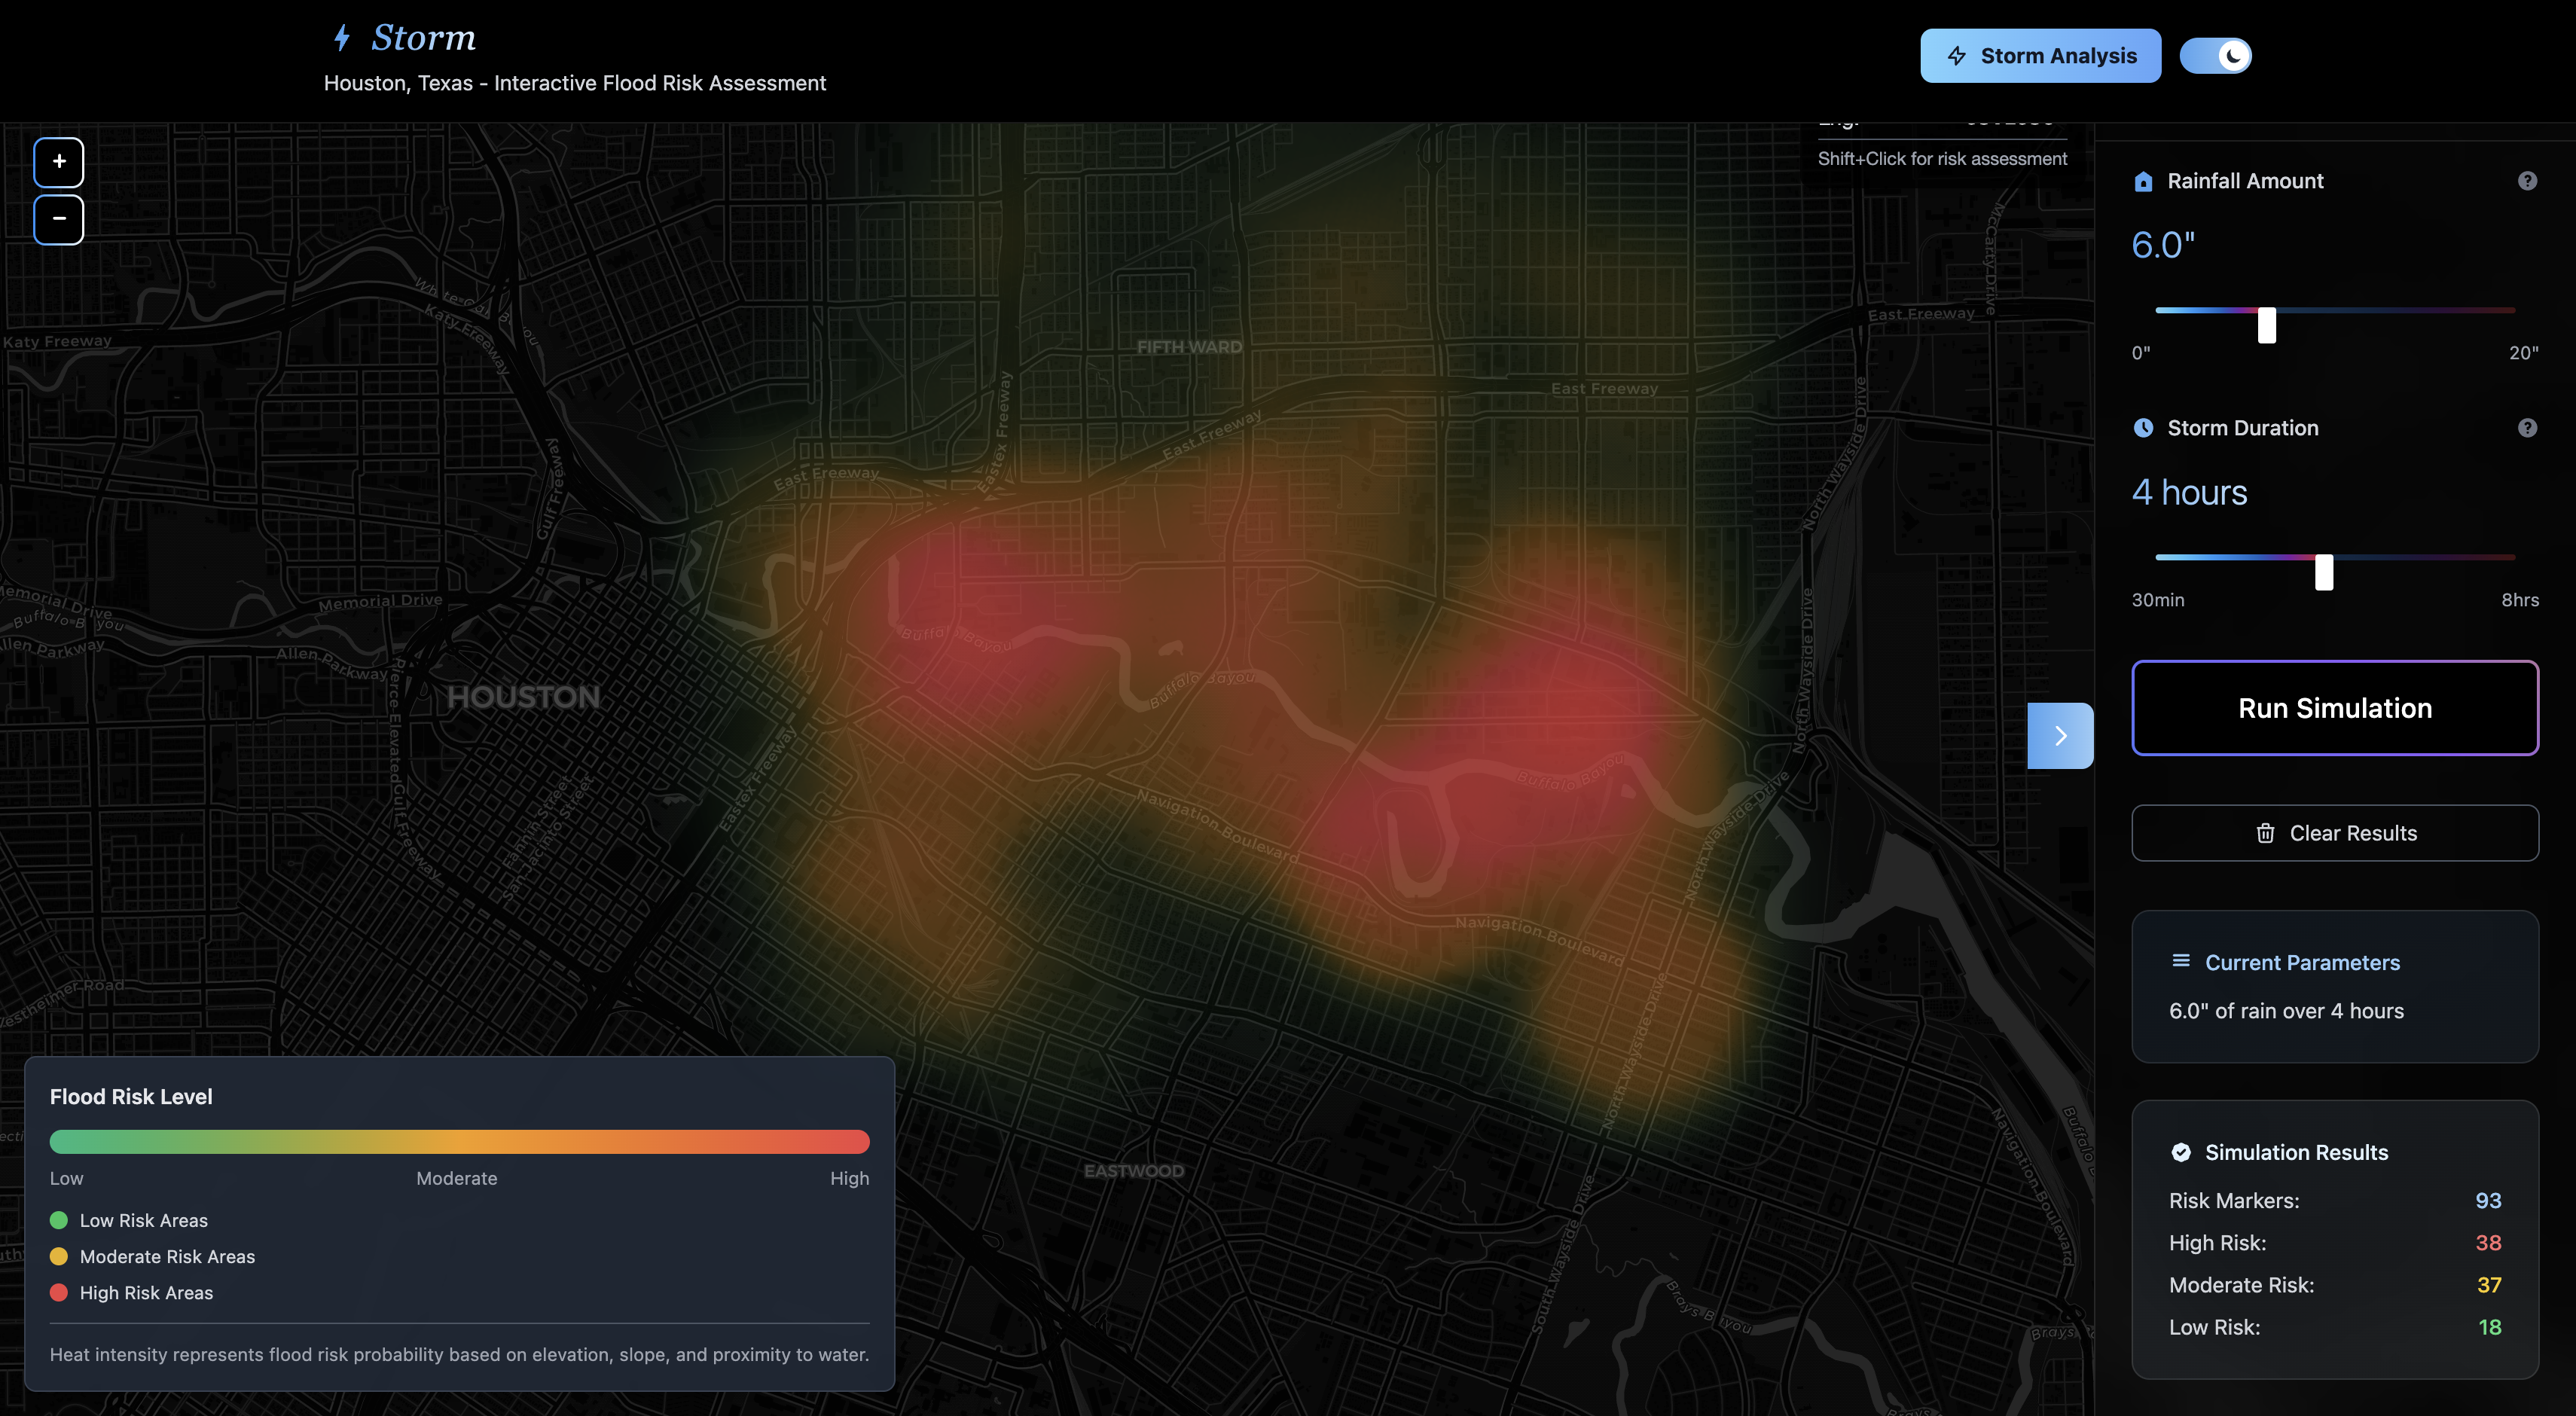
Flood Simulation Heat Map Page
-
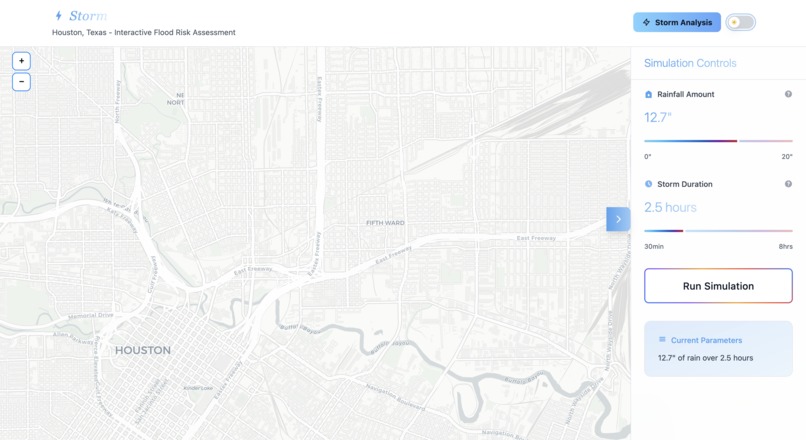
Storm Analysis Page
-
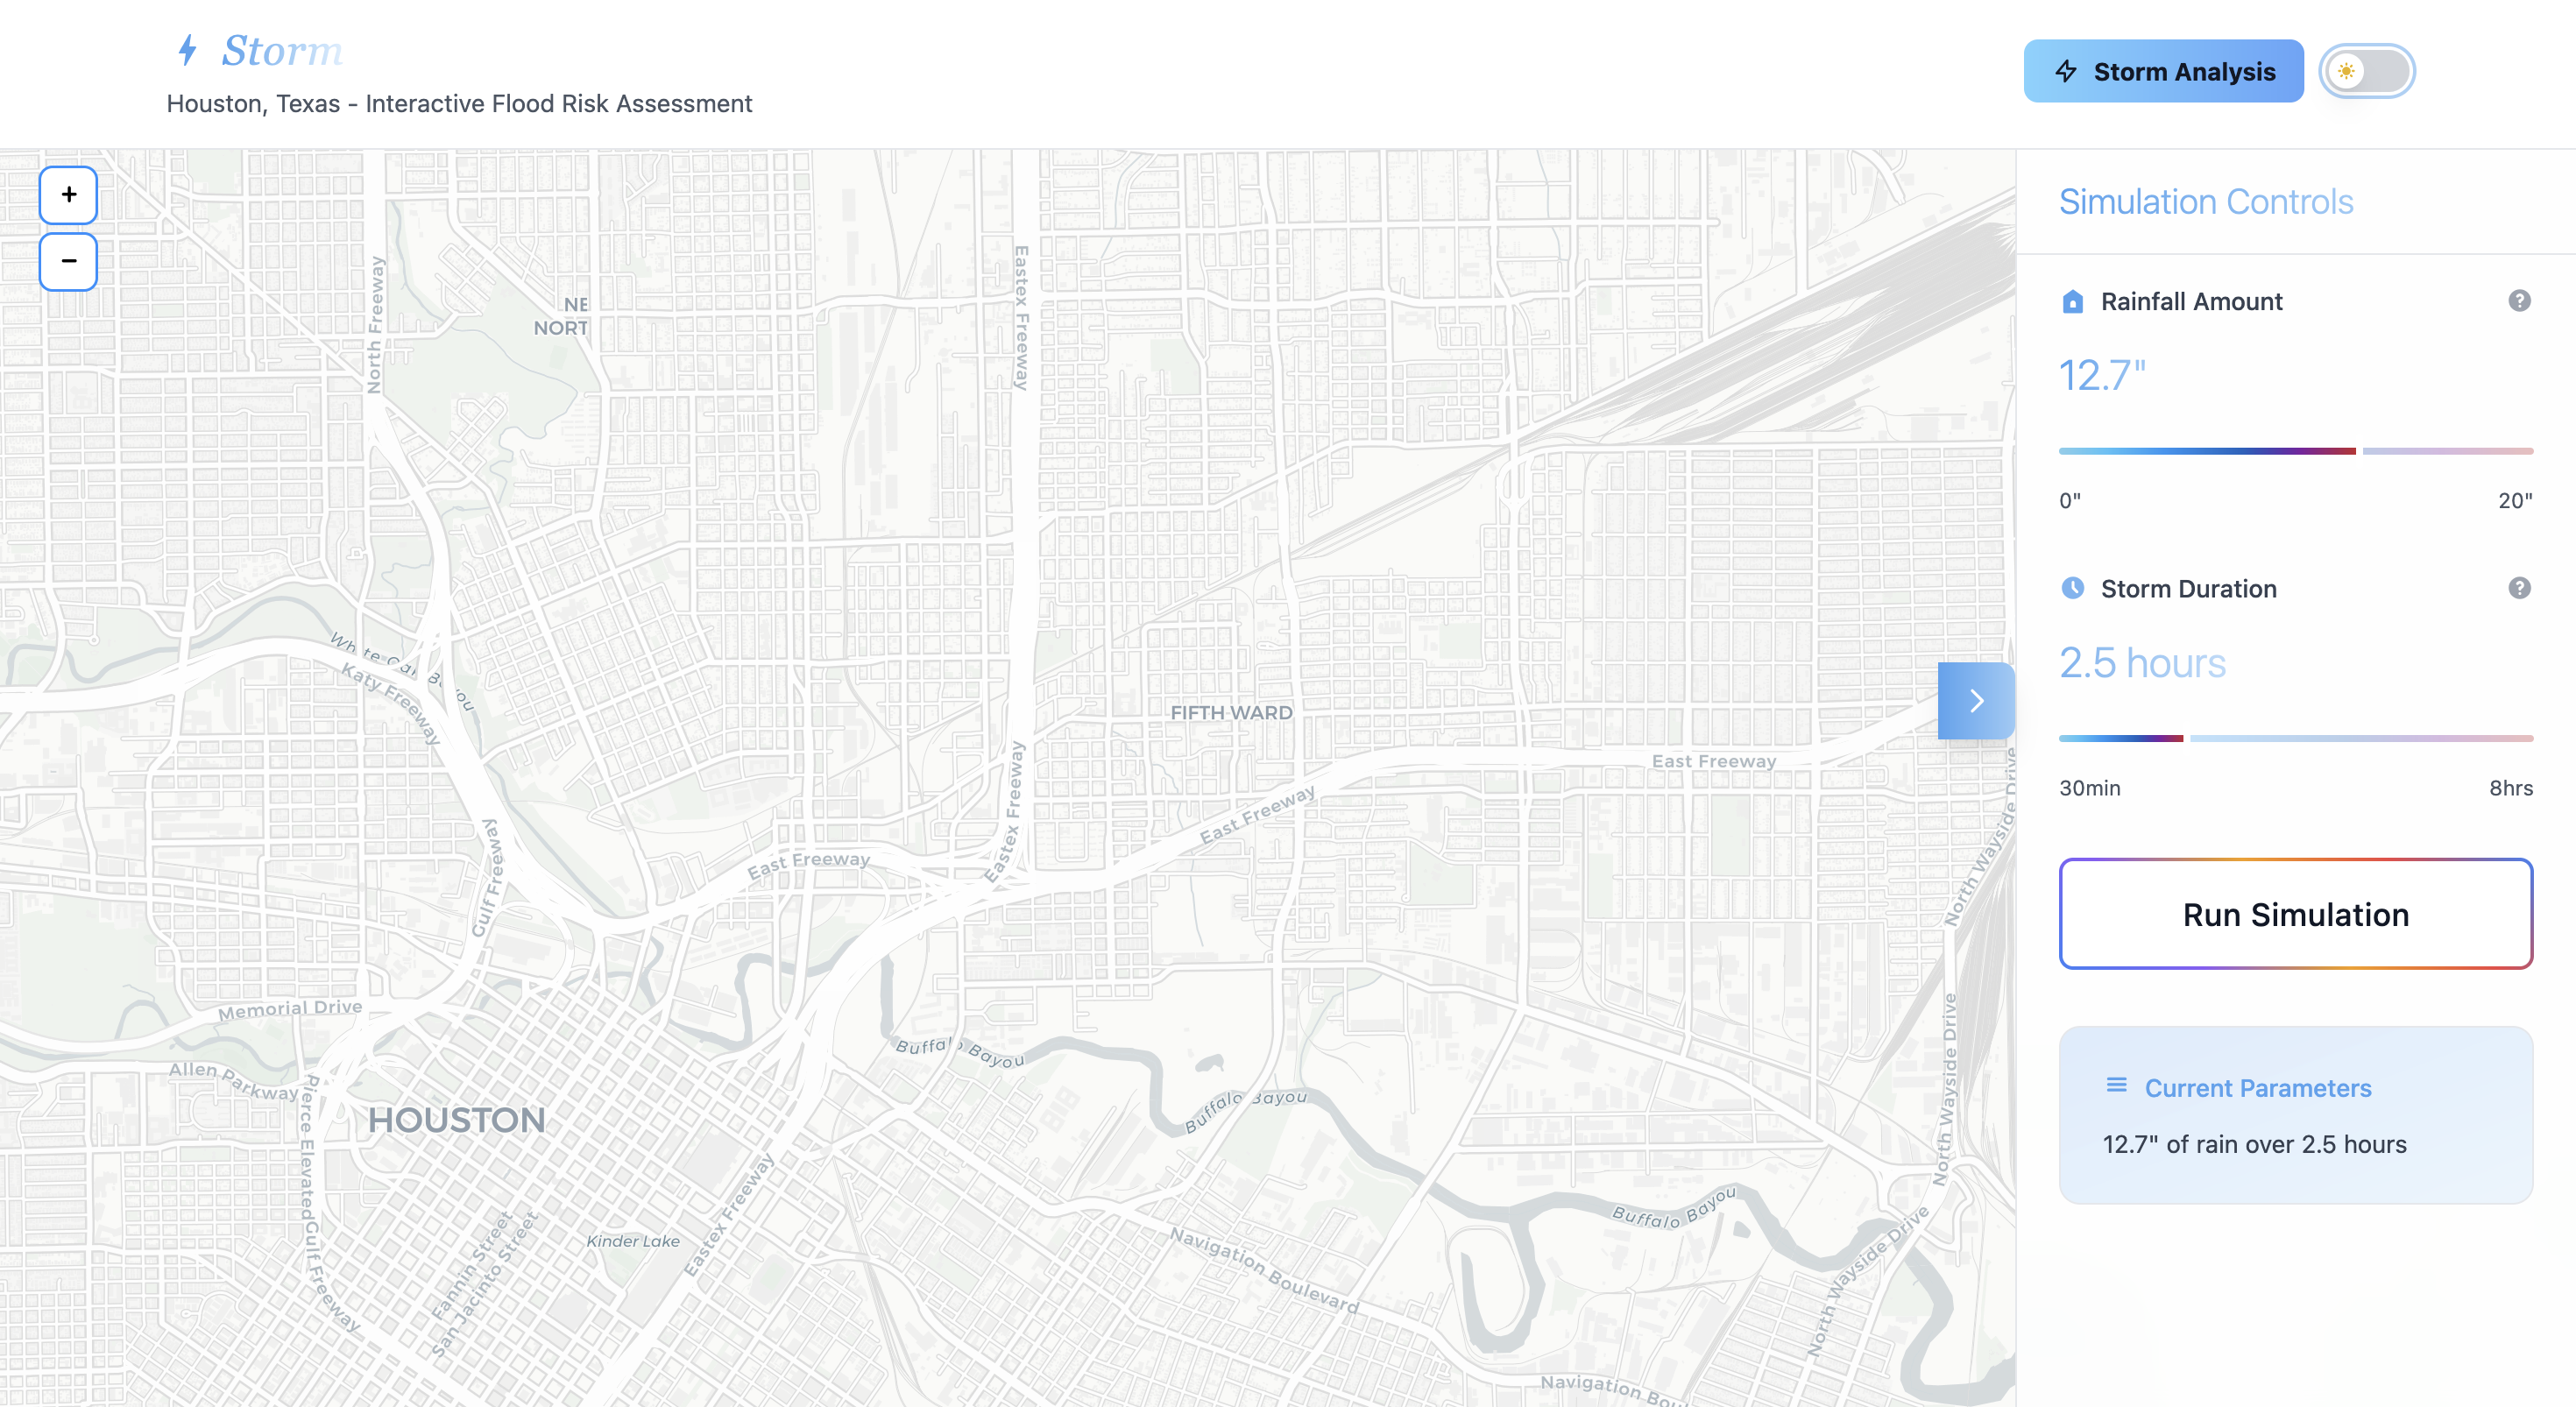
Flood Simulation Page (Light Mode)
-
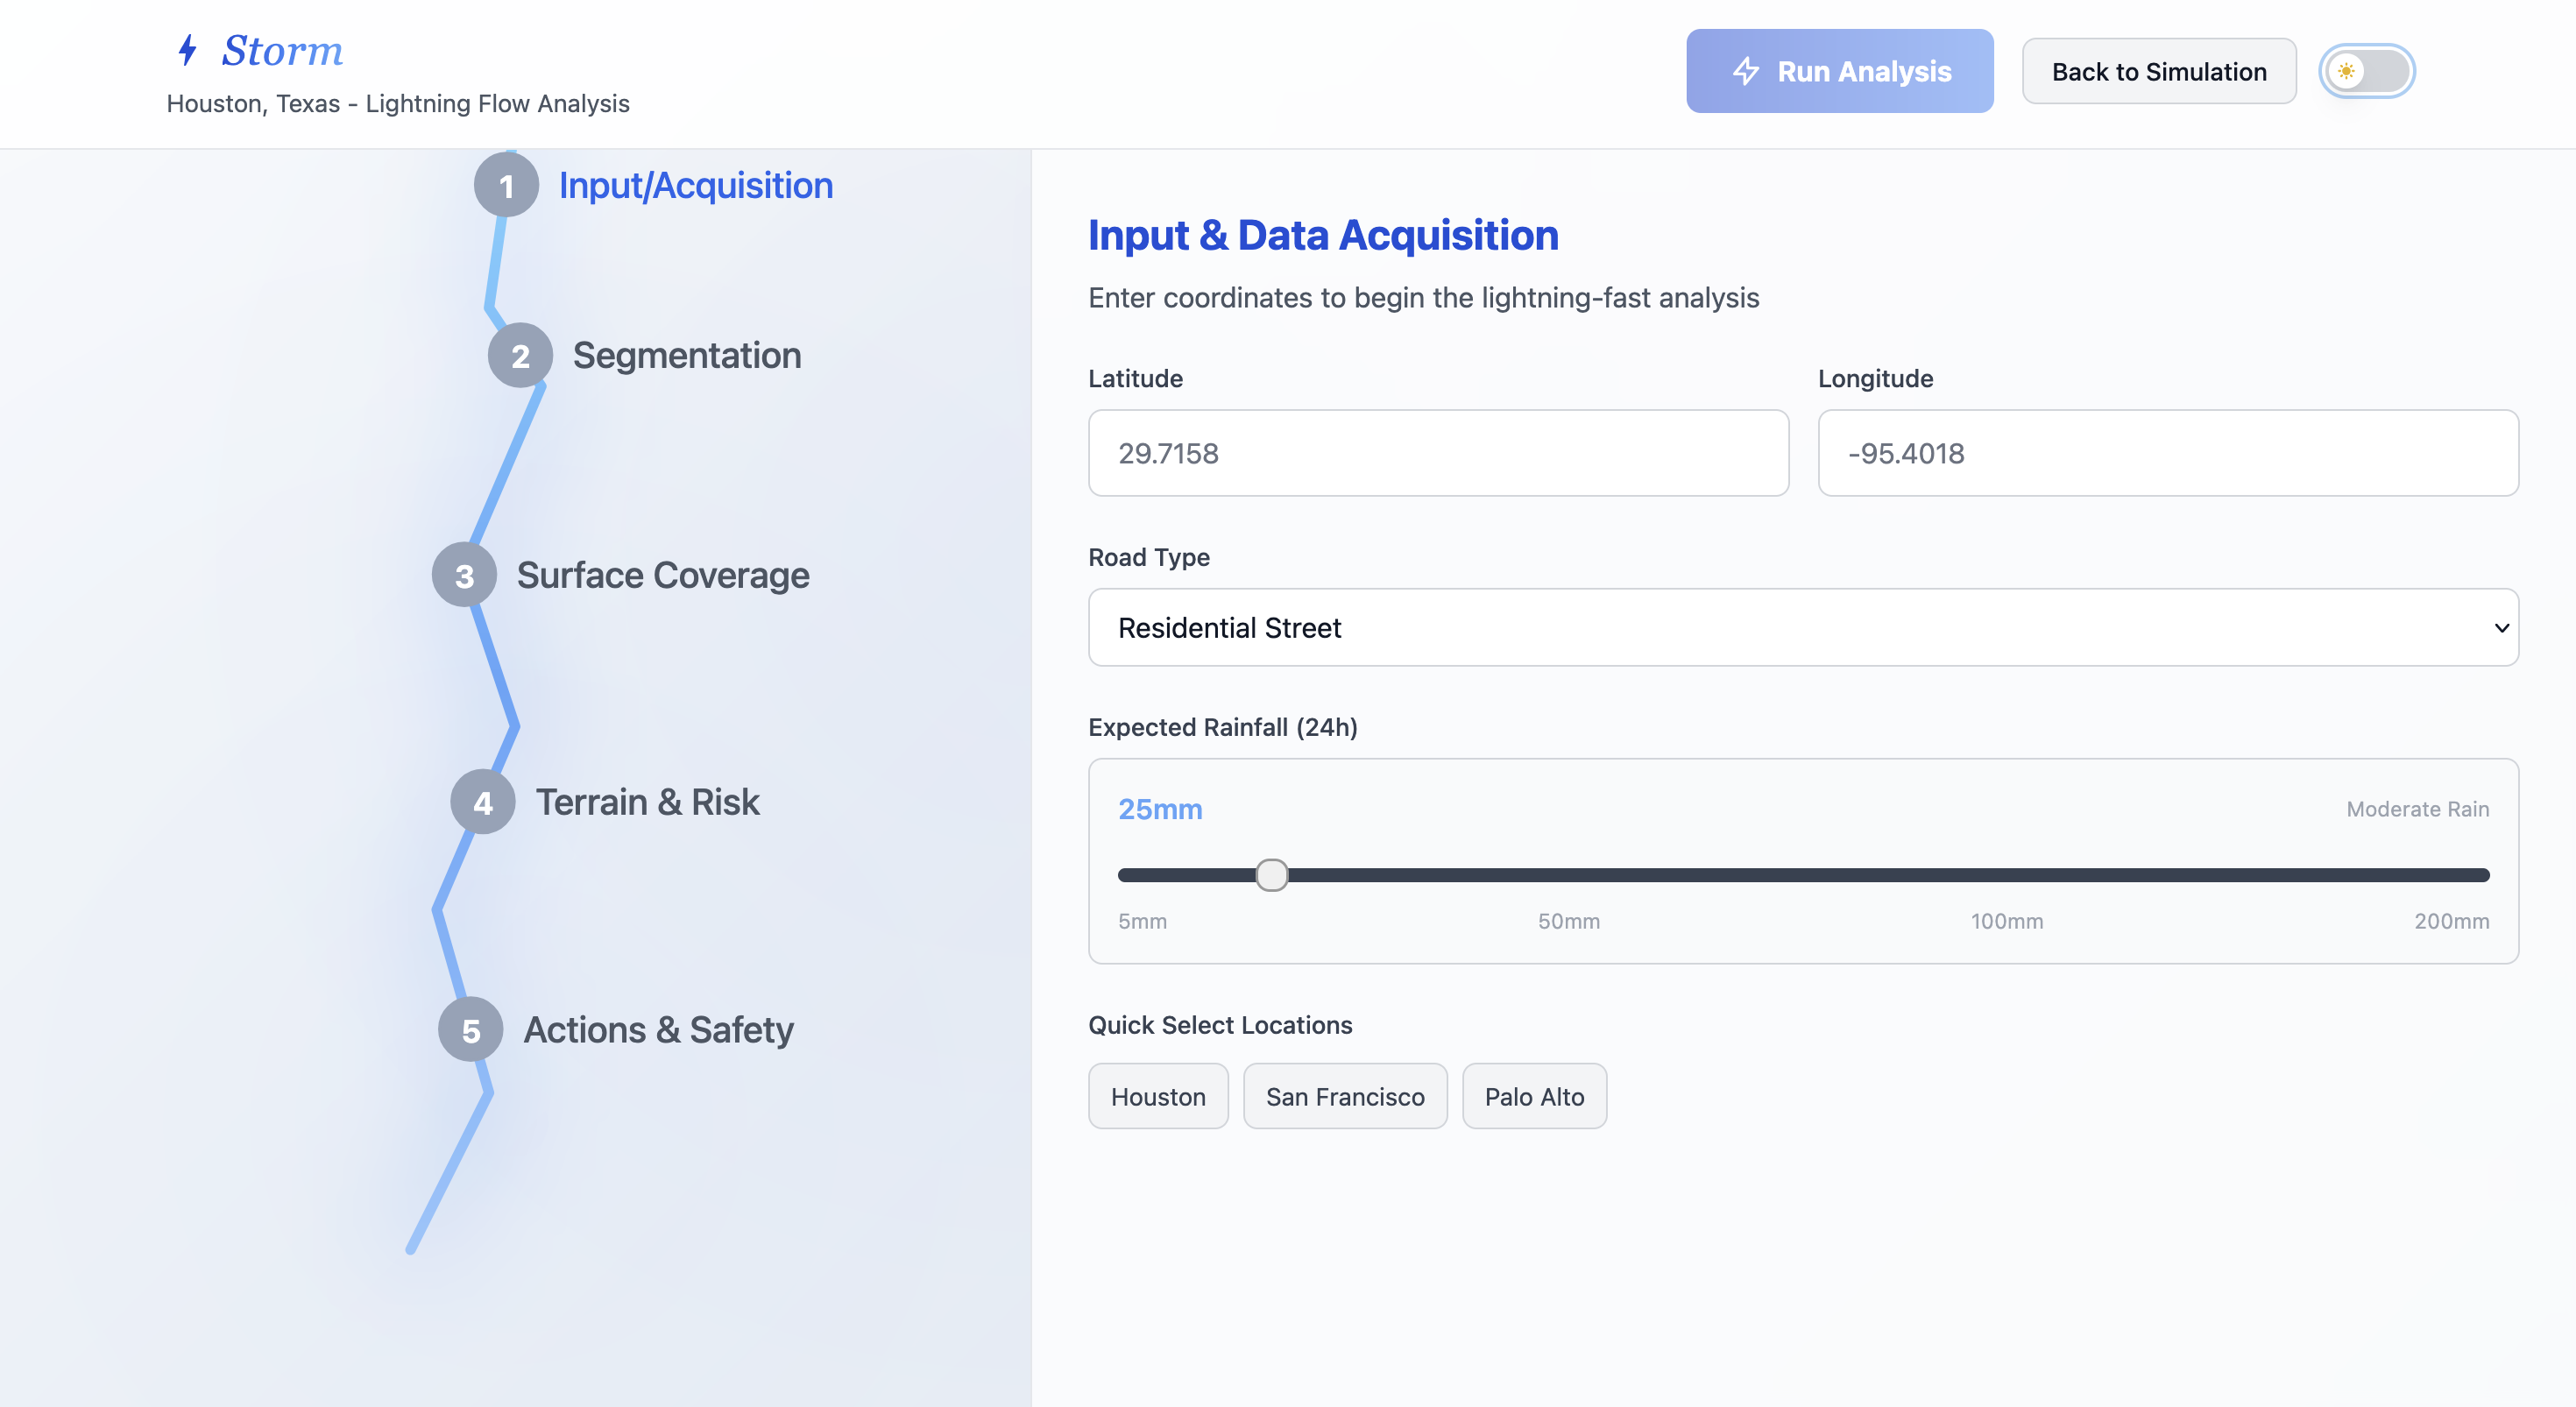
Storm Analysis Page (Light Mode)
-
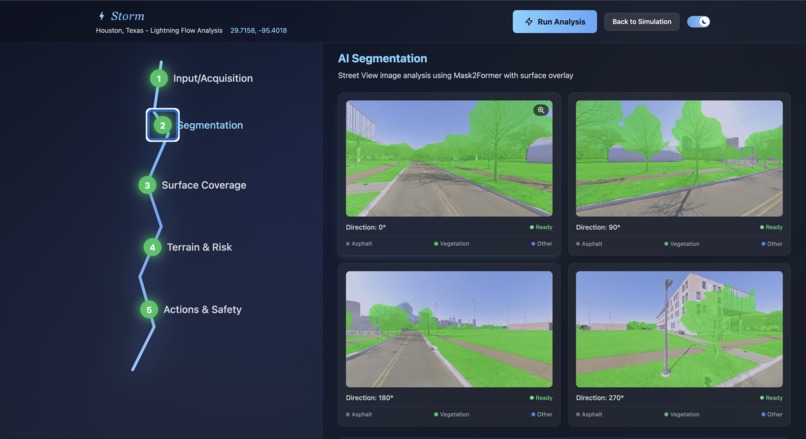
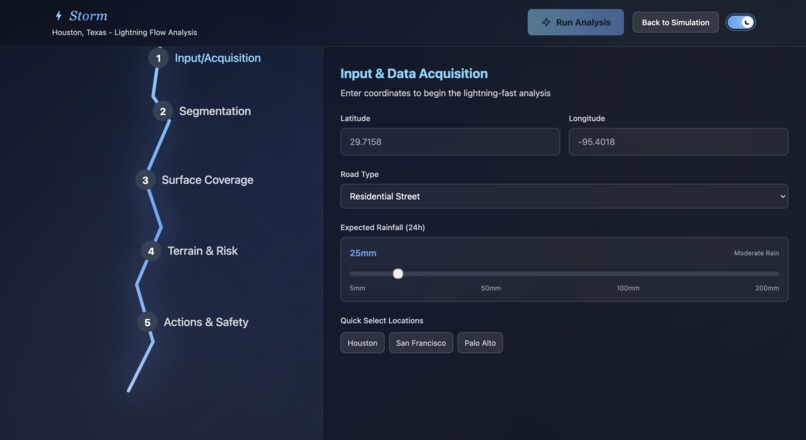
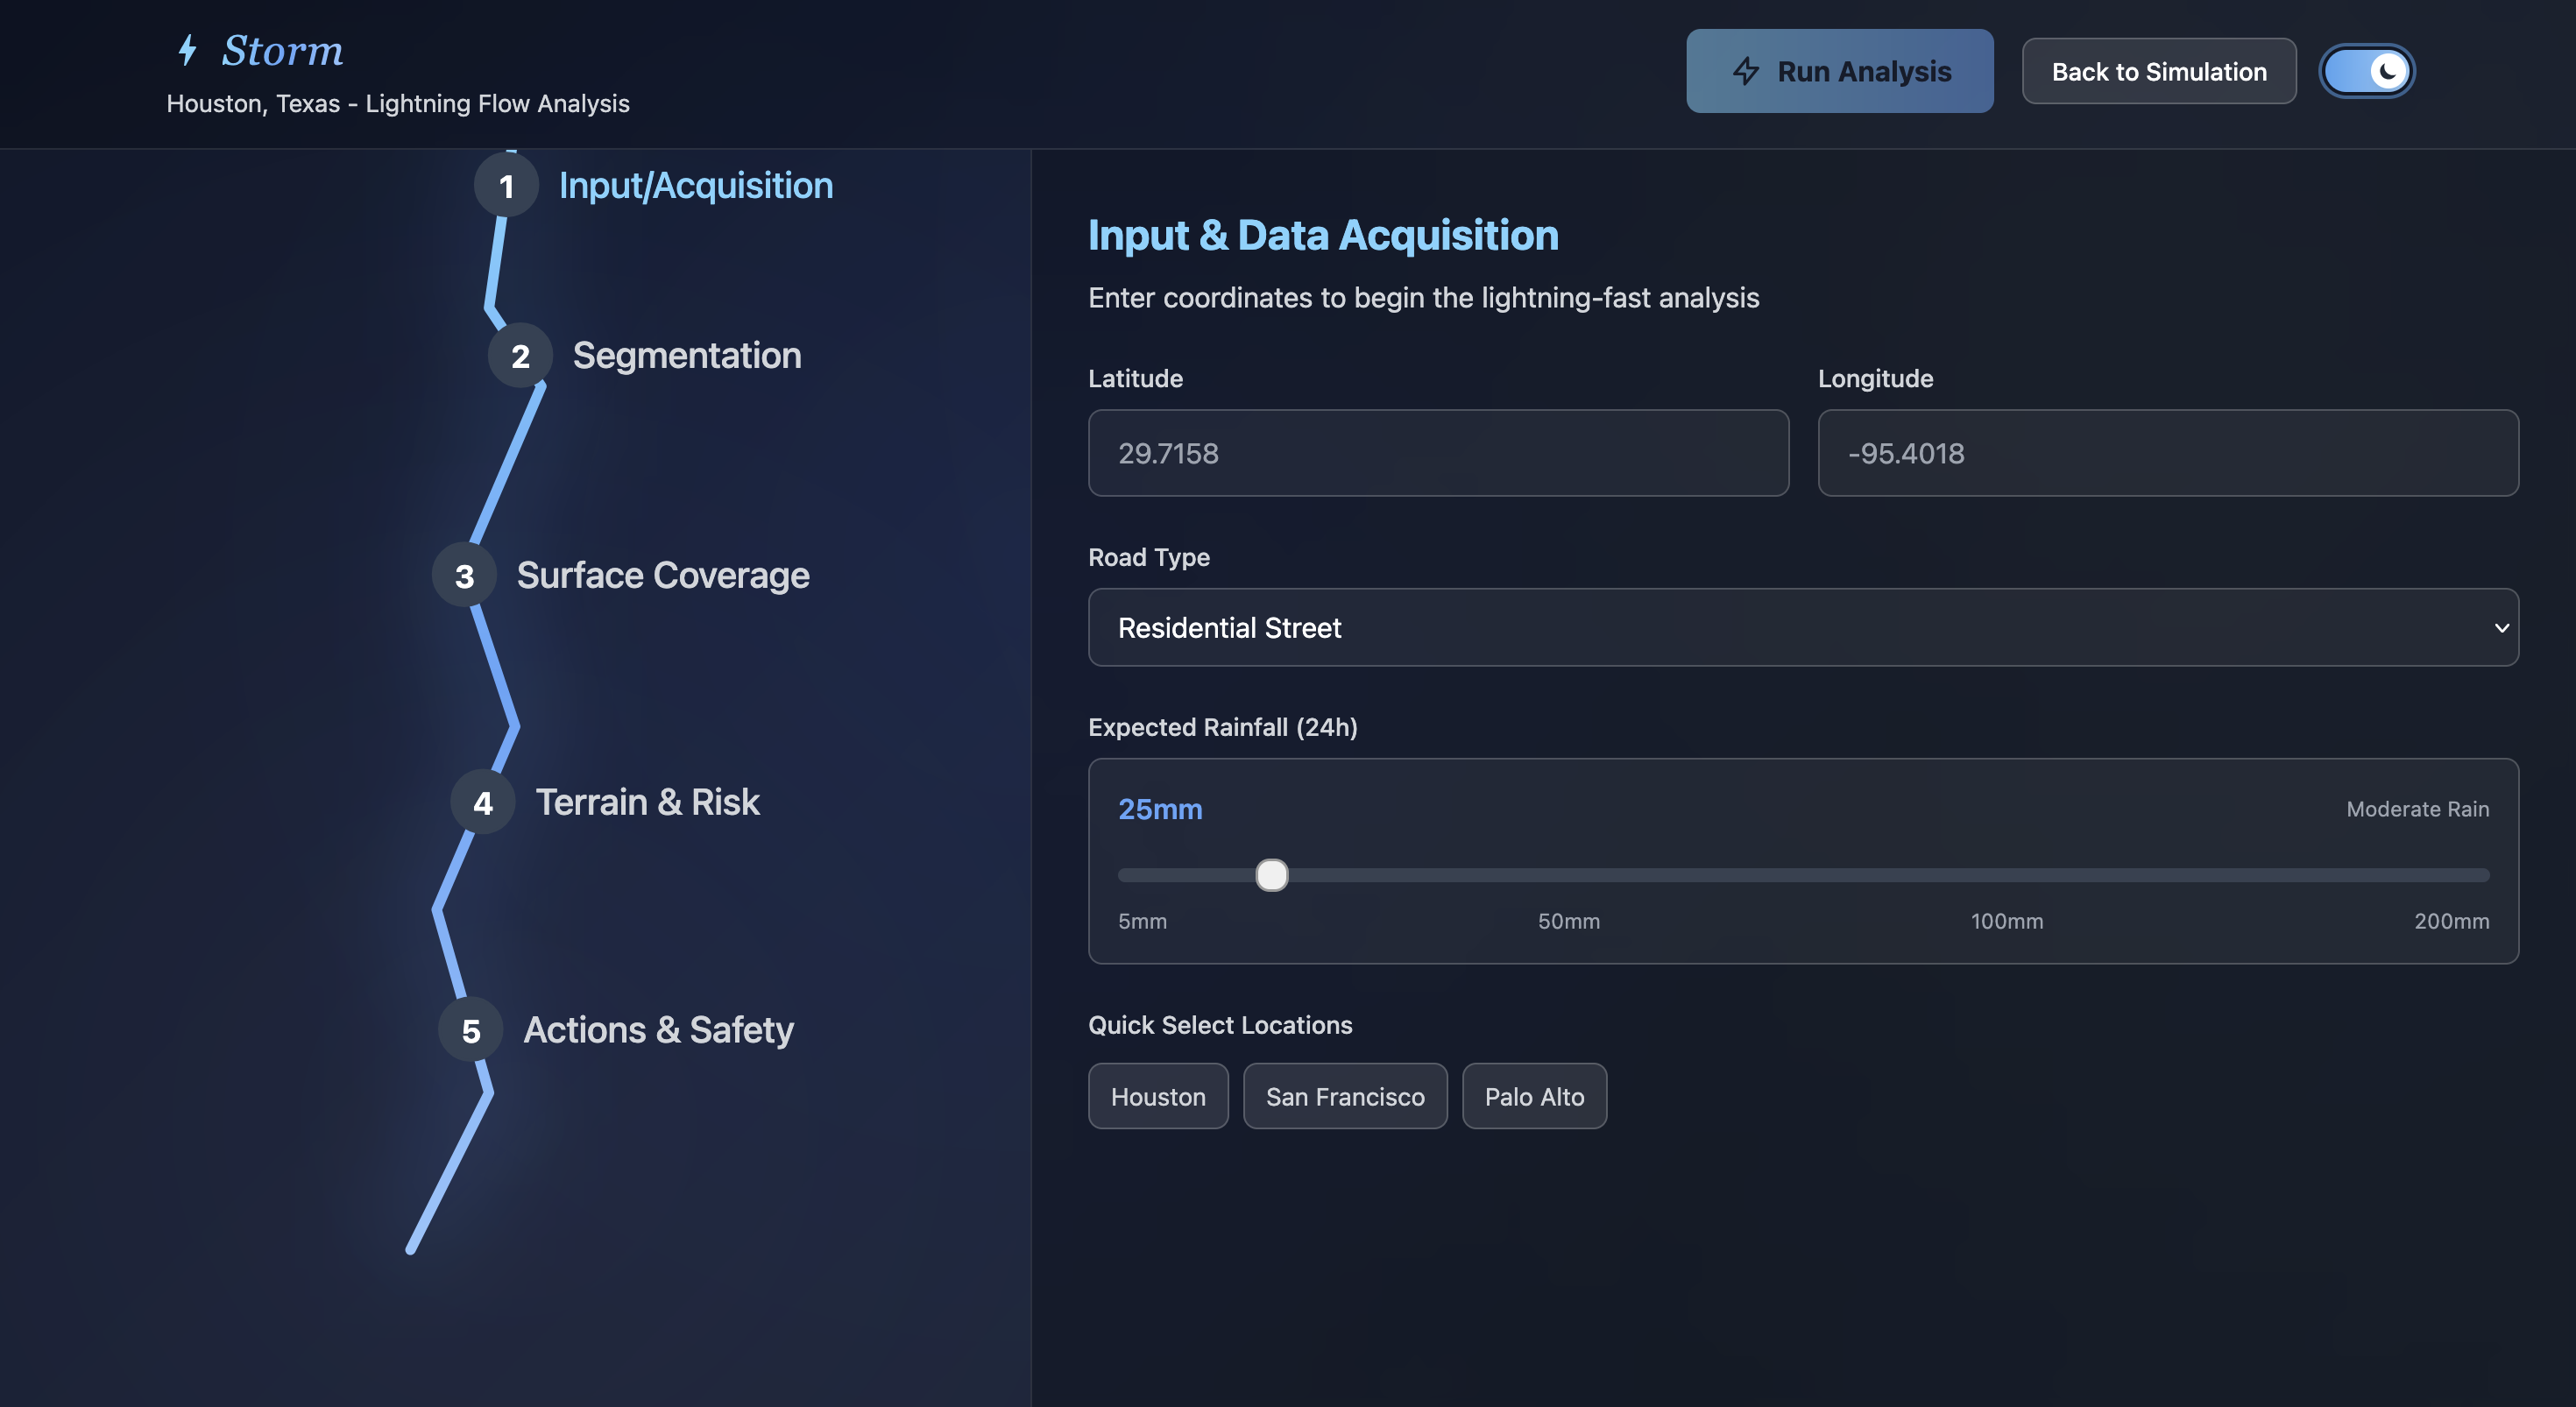
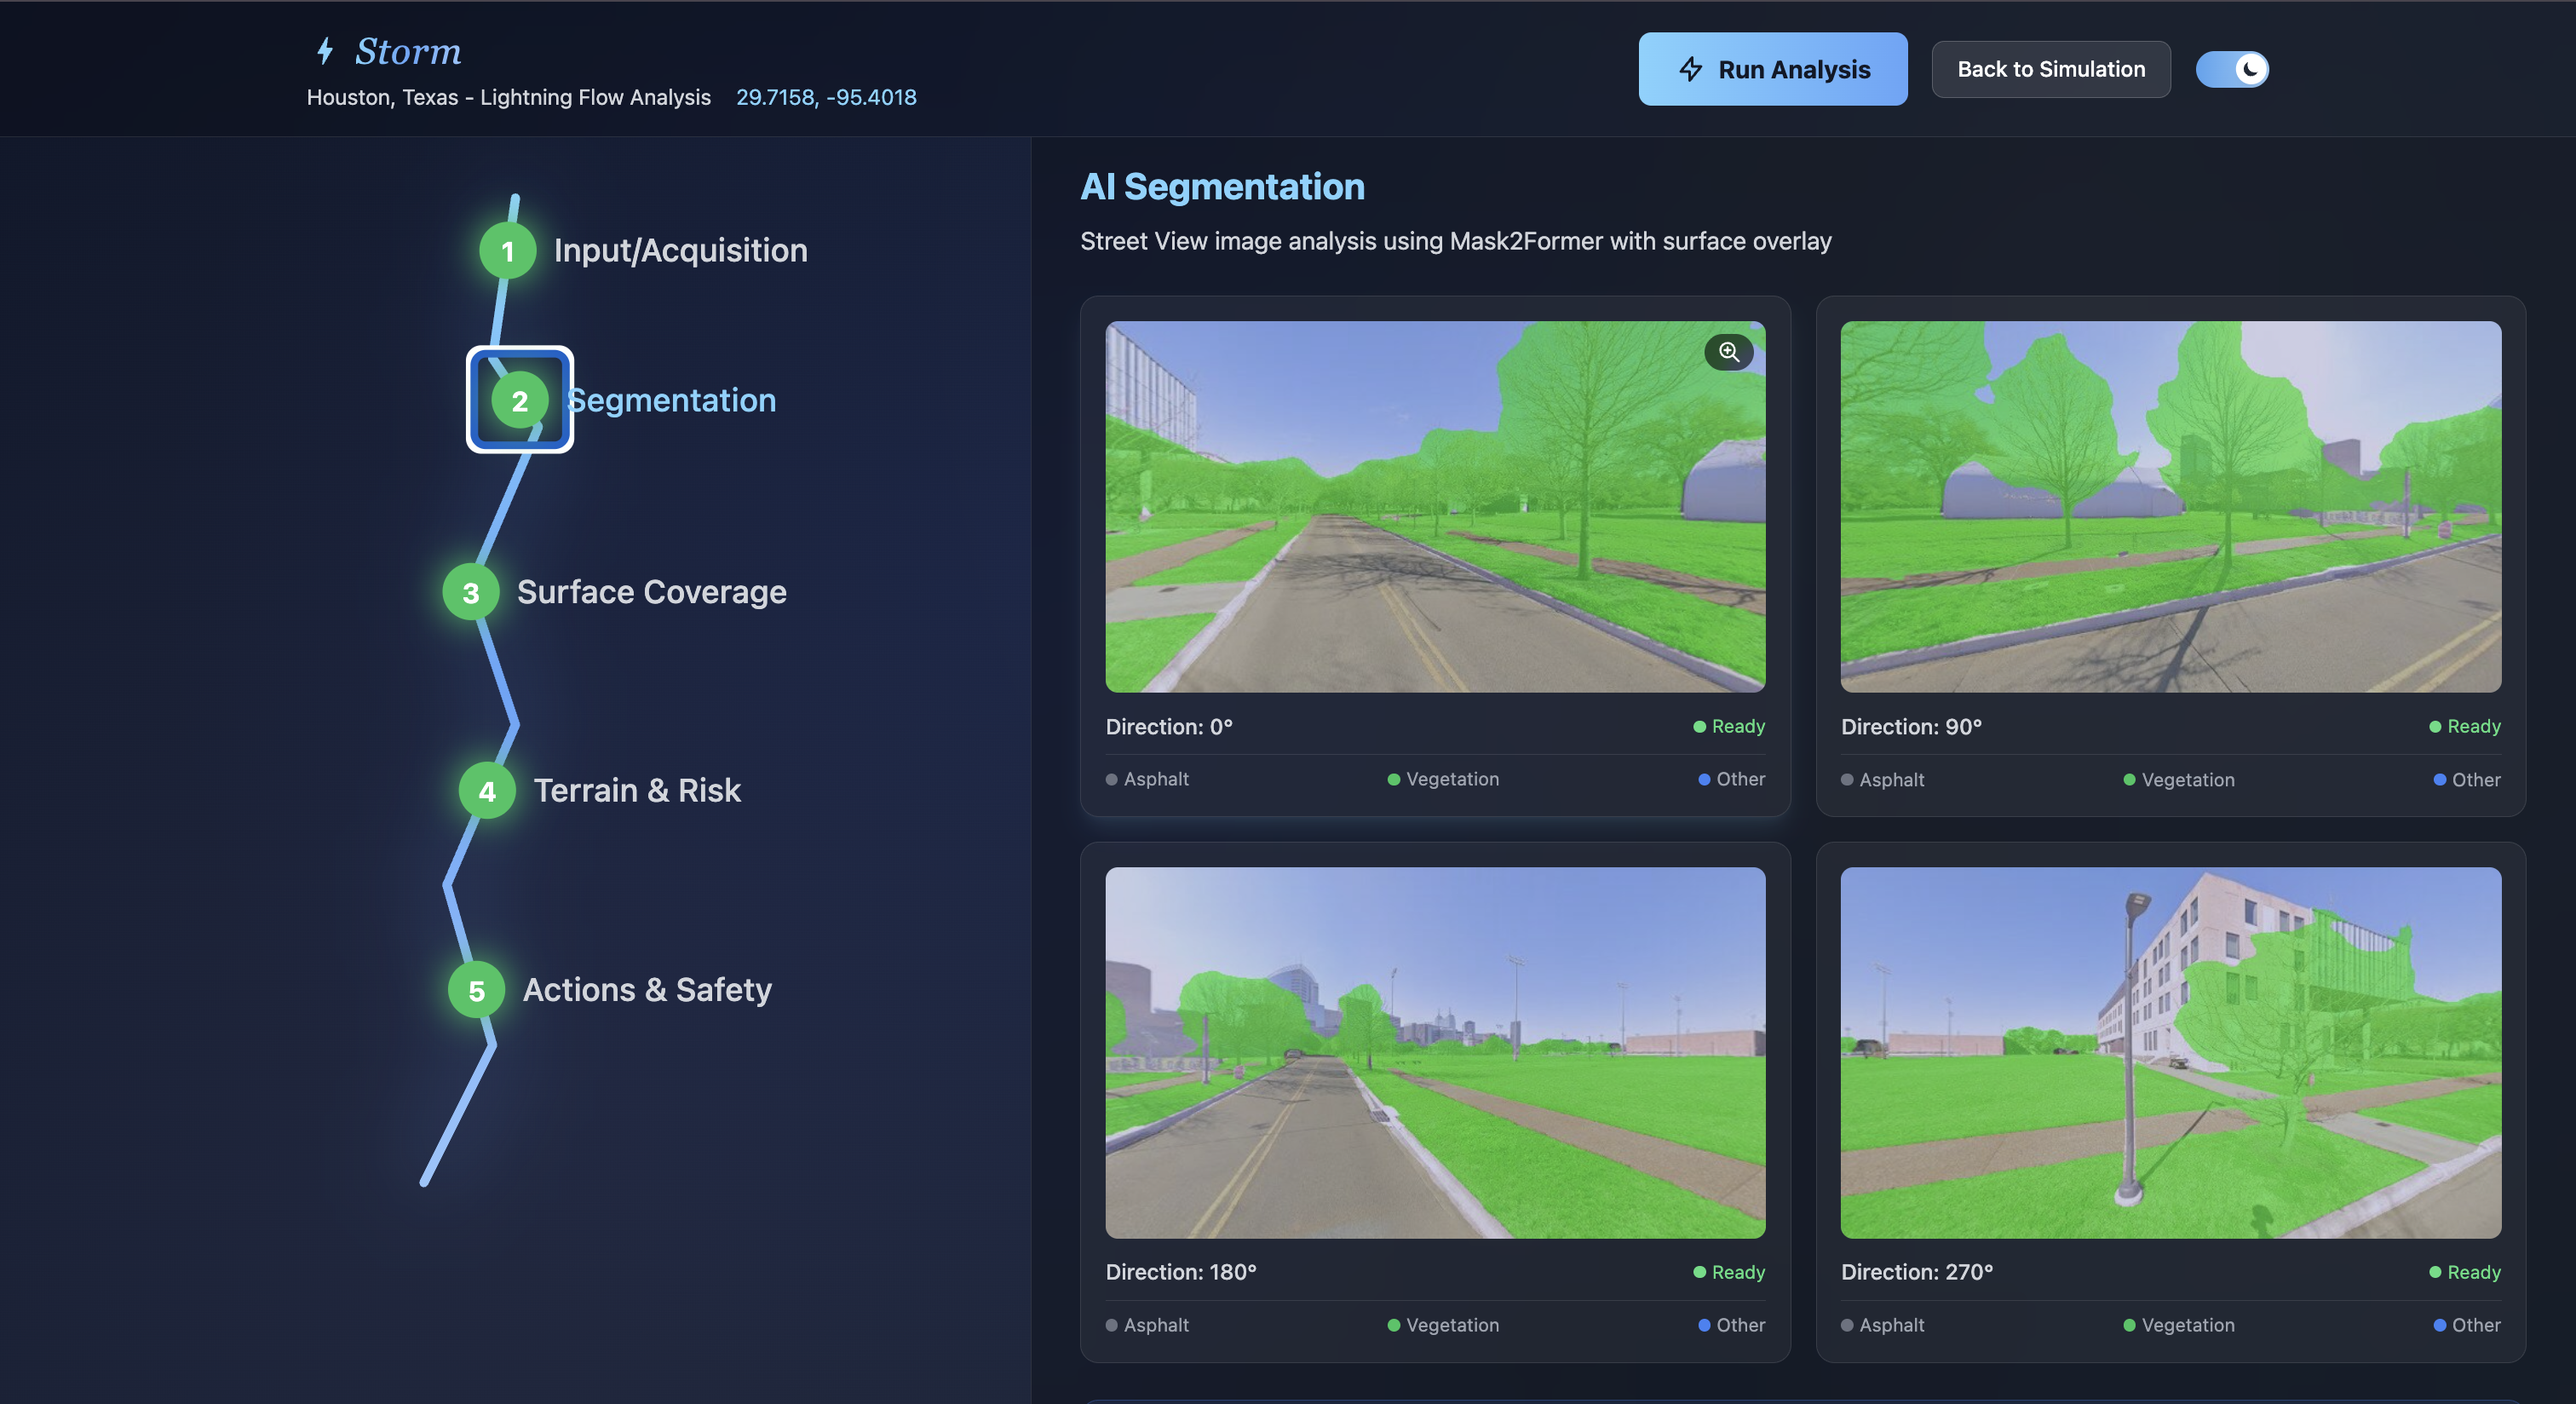
Segmentation Analysis
-
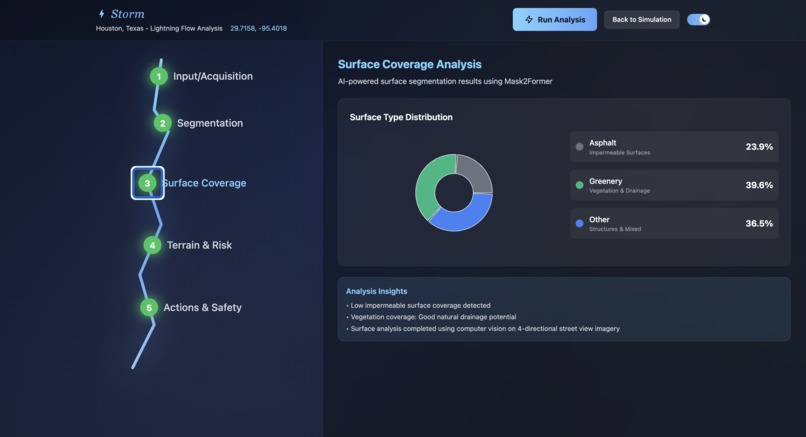
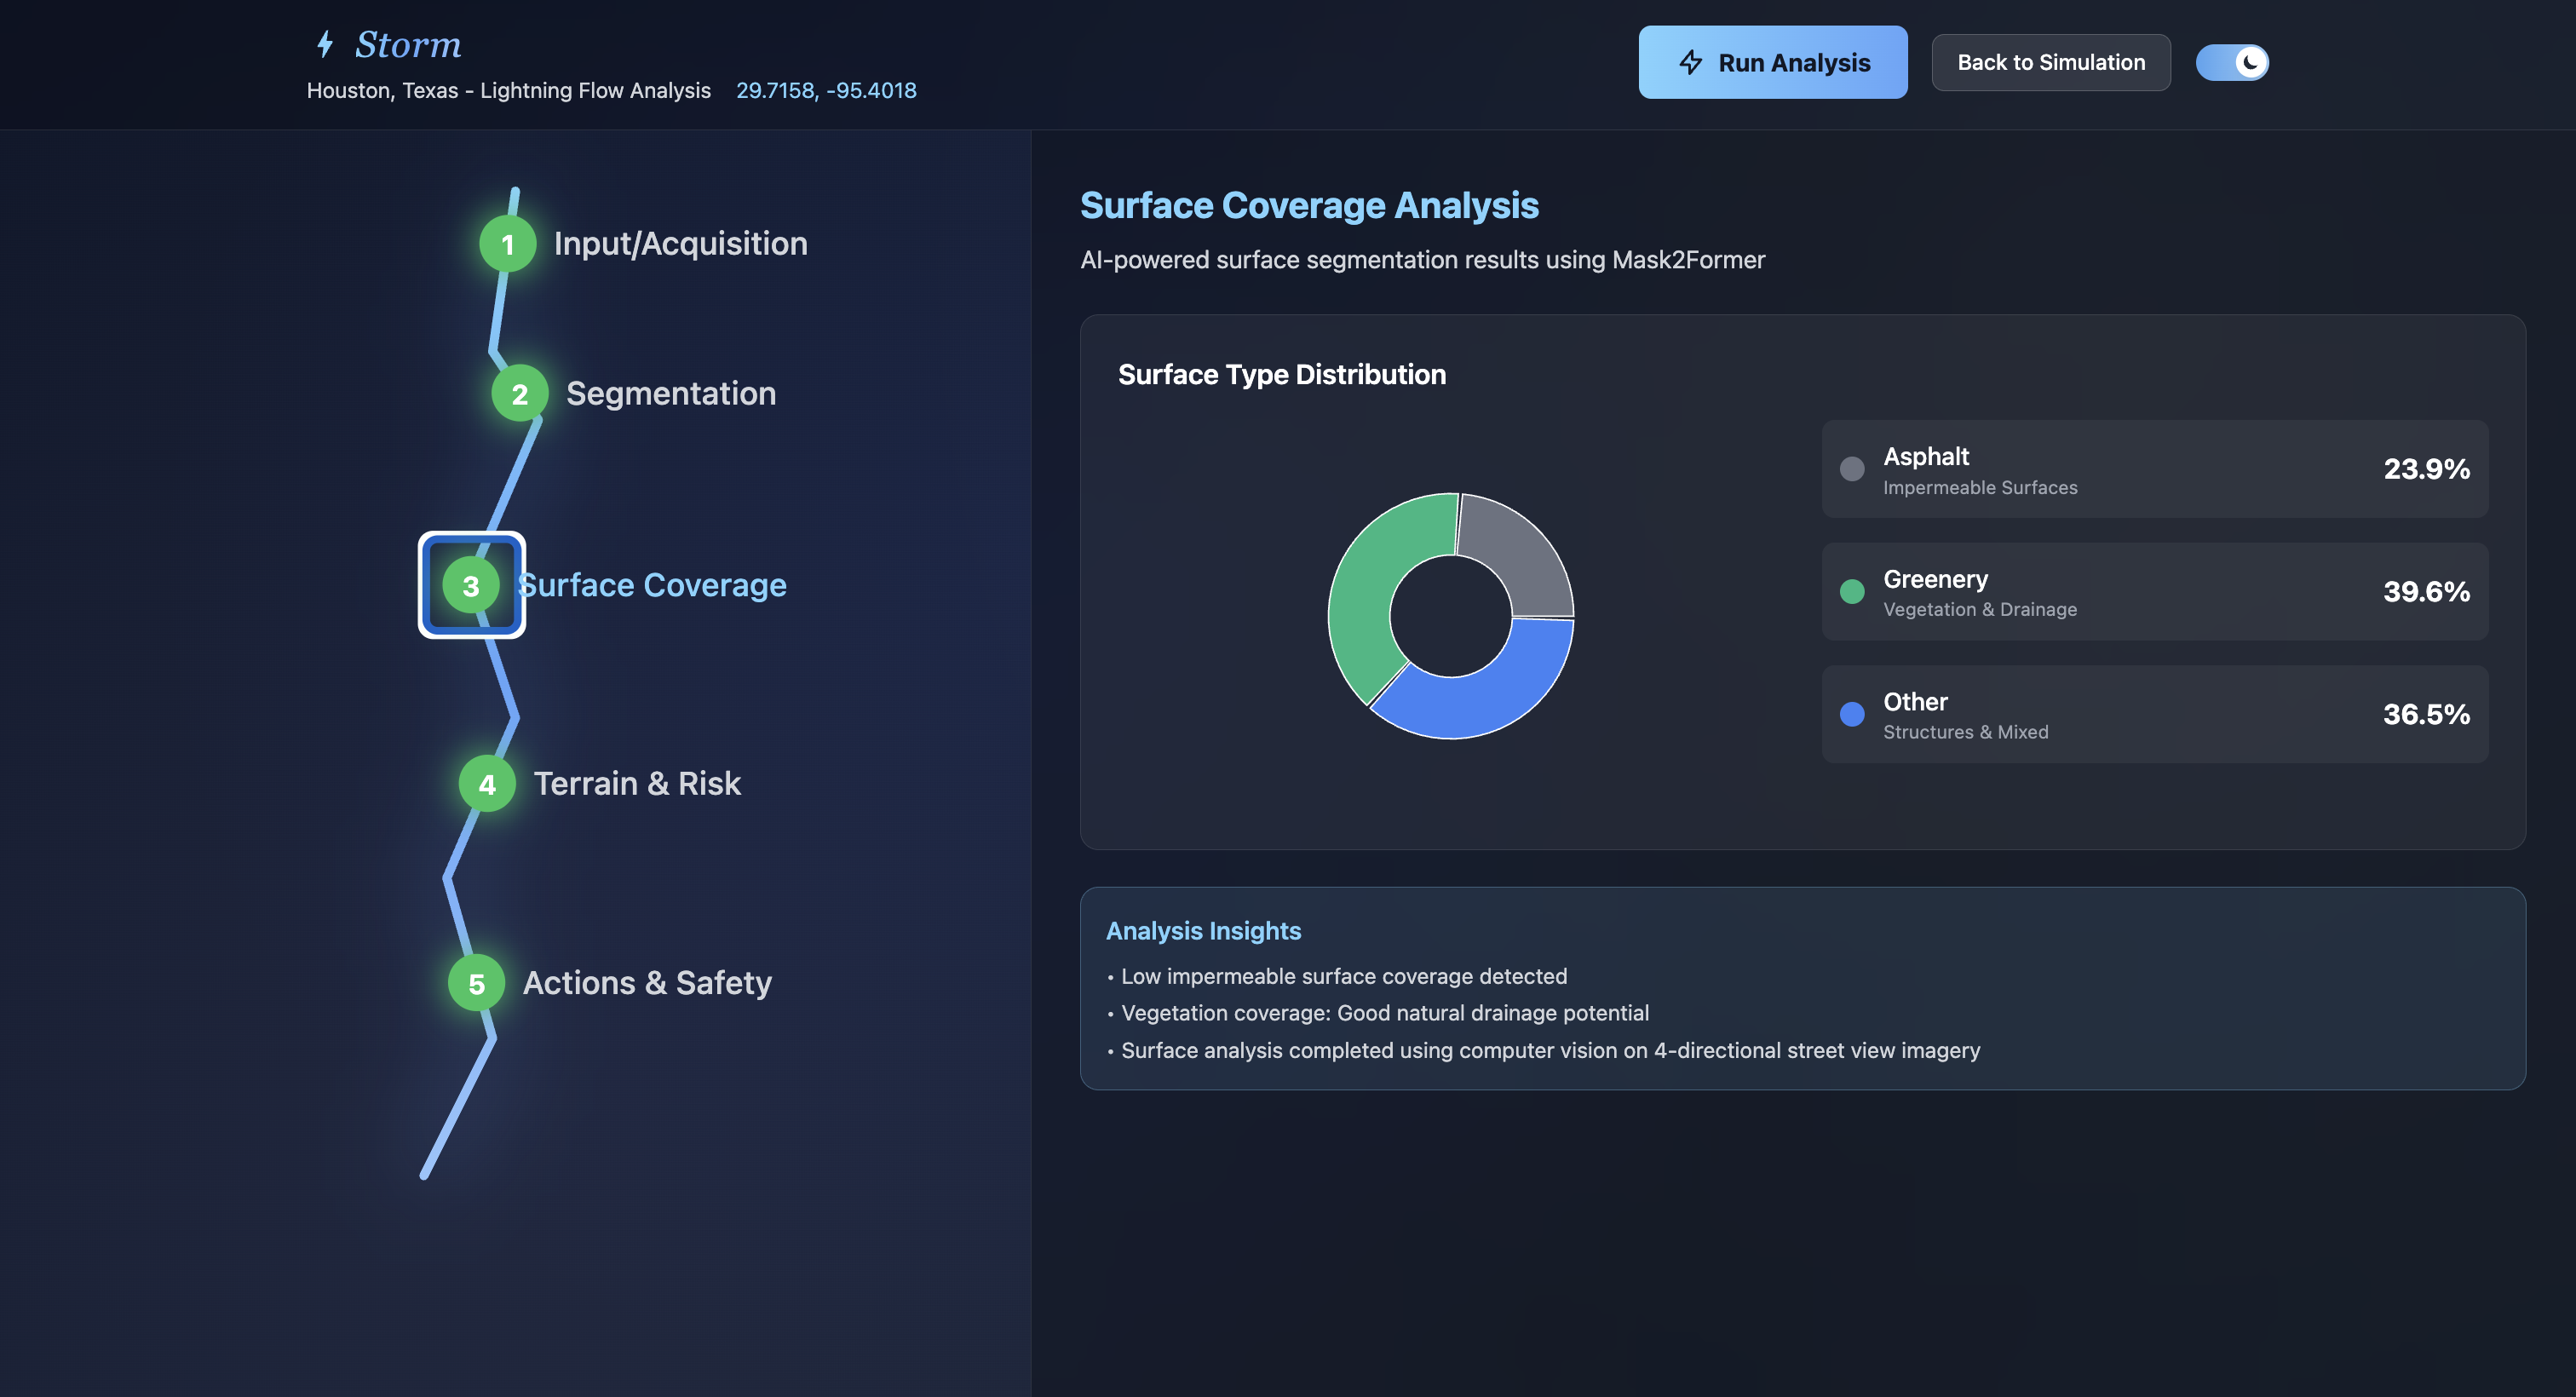
Surface Coverage
-
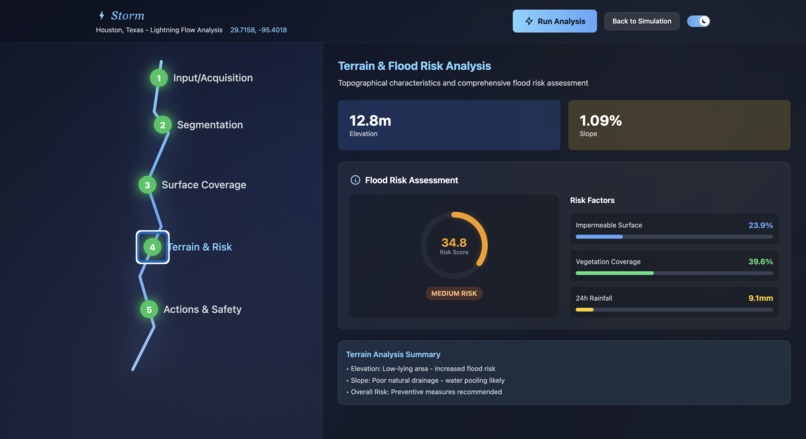
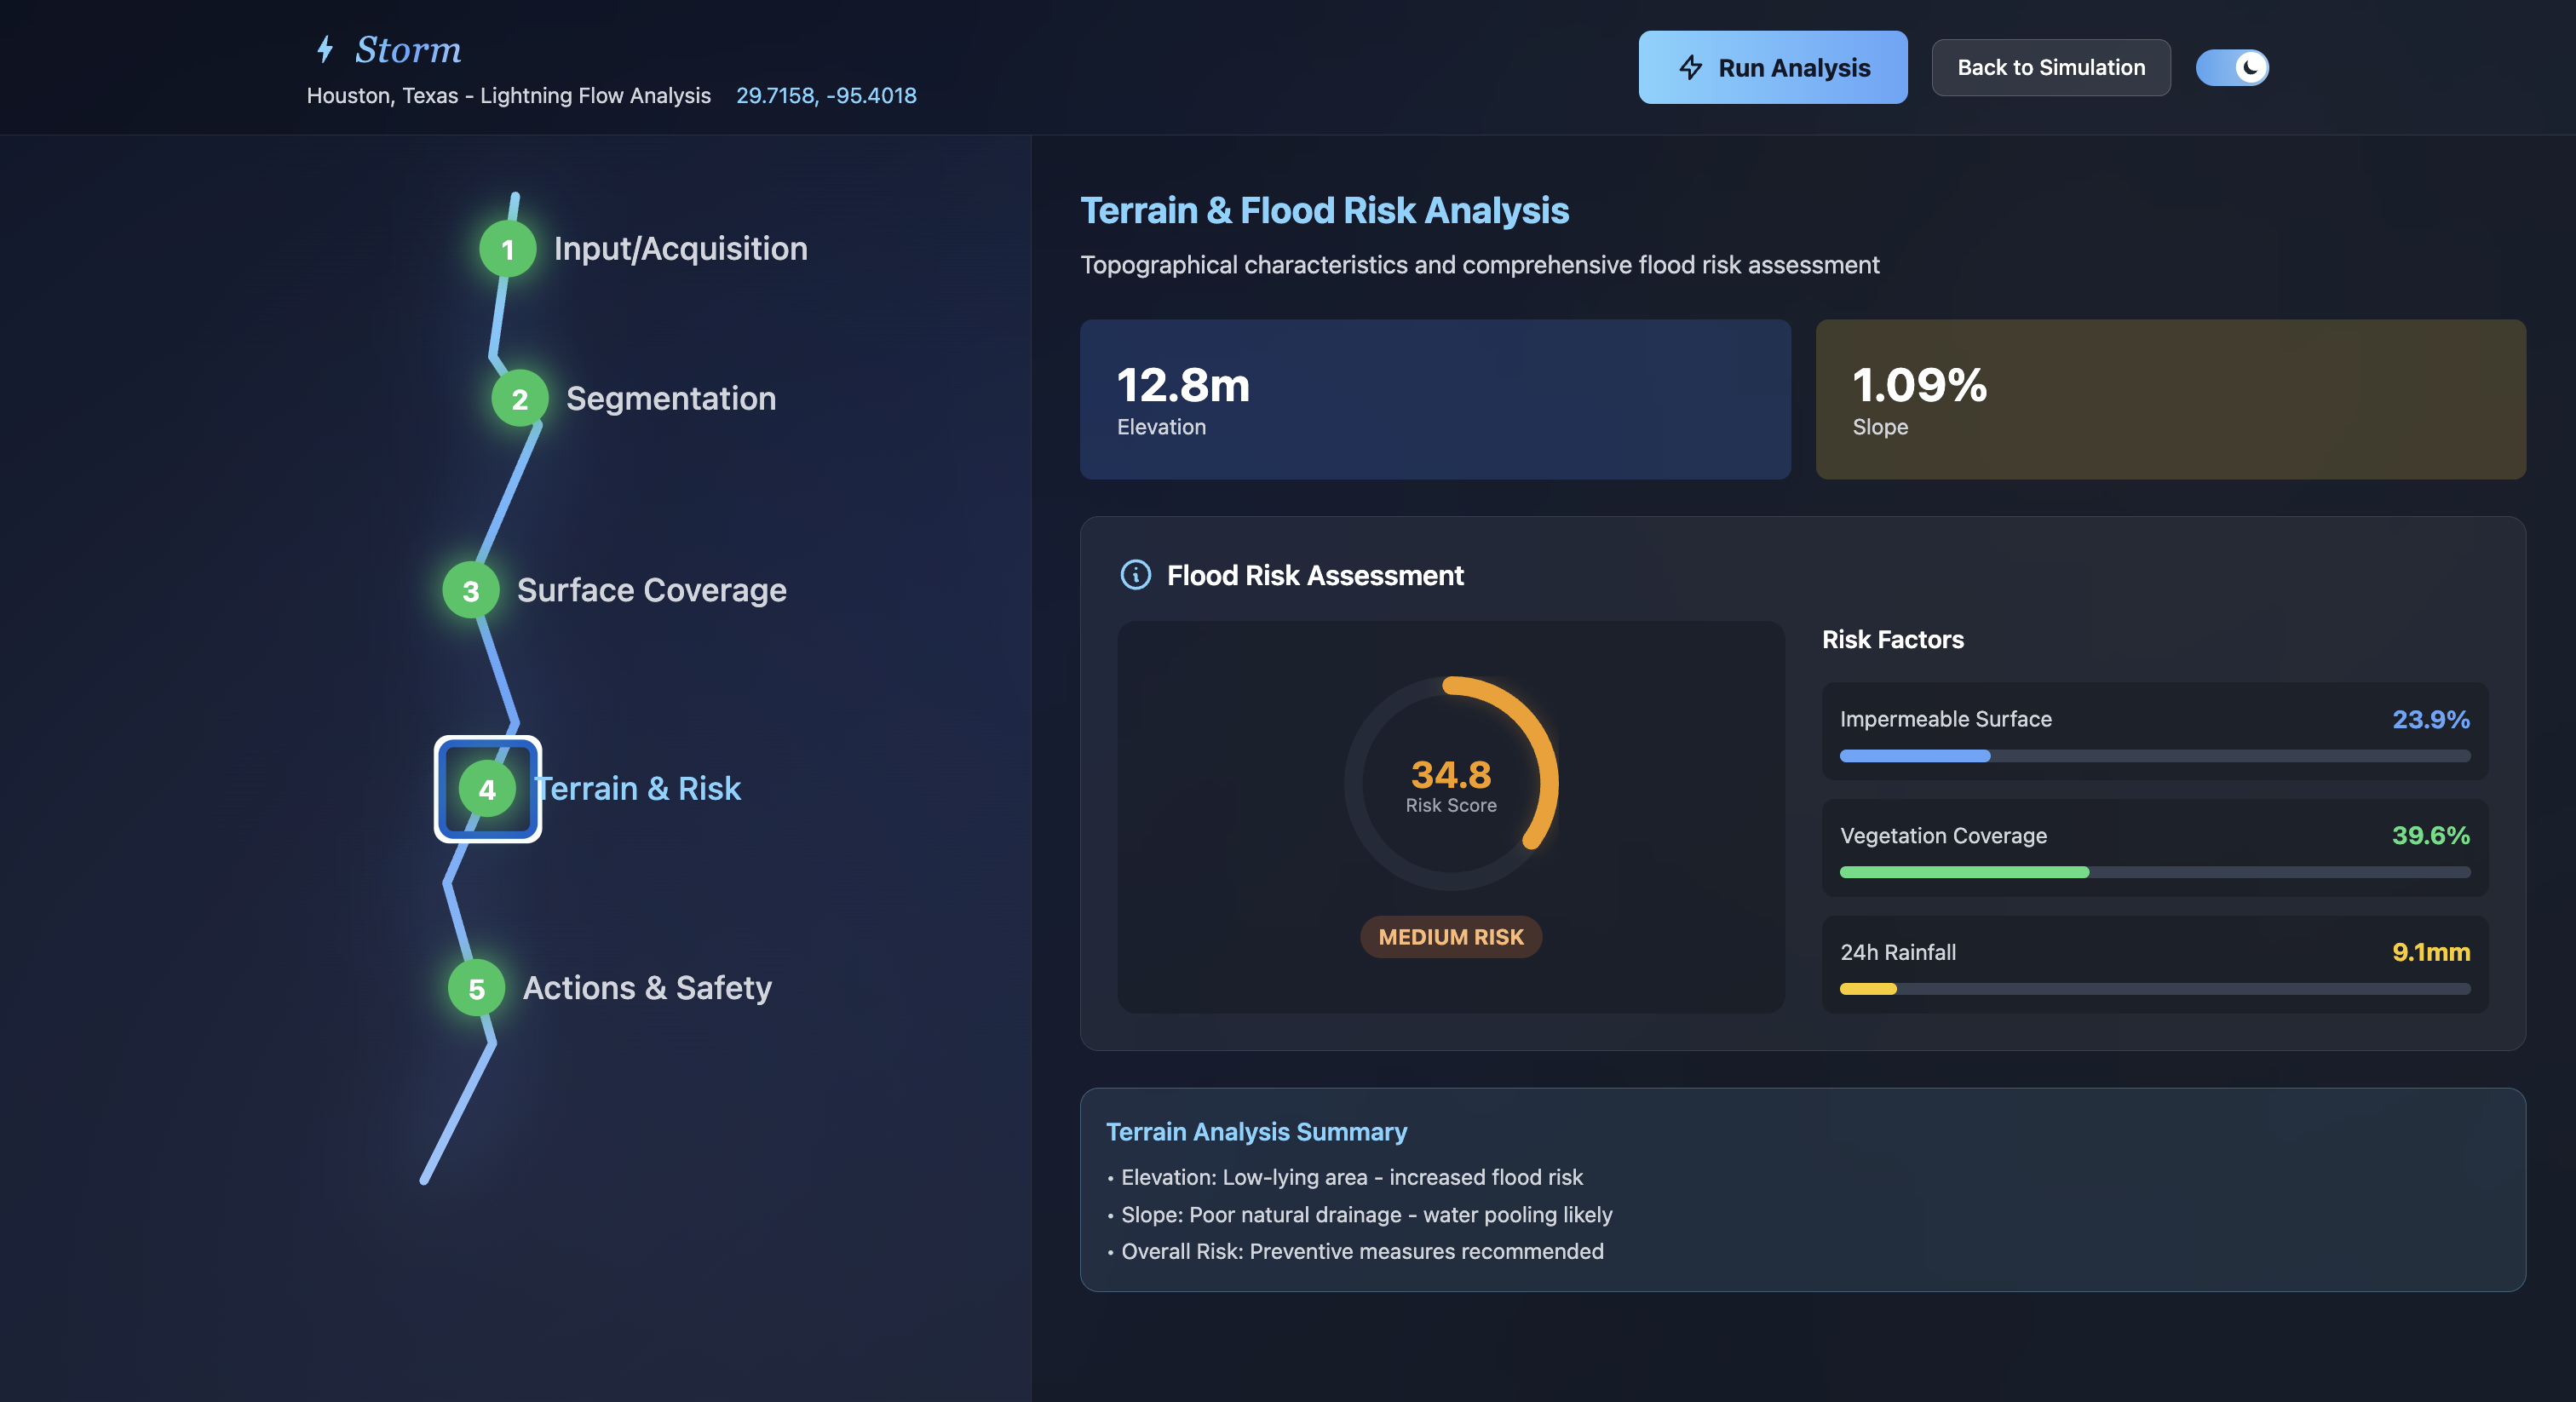
Terrain & Risk

🌊 Storm: AI-Powered Flood Risk Intelligence
Inspiration
We are a team of Houston natives who have lived through the devastation of Hurricanes Harvey, Ike, and most recently Beryl. We’ve seen firsthand what it means when an entire city drowns — families displaced, streets underwater, and recovery that takes years. Houston alone lost more than $125 billion during Harvey, and even today, traditional flood risk assessments rely on outdated FEMA maps that miss street-level realities.
Our own experiences of being flooded, of watching neighbors struggle, and of knowing this same pain is shared around the world — from Mumbai’s monsoon floods, to Pakistan’s 2022 disaster displacing 33 million people, to New York’s subway flooding during Ida — became the foundation for Storm.
We built Storm because we know what it feels like when minutes matter but insights take weeks. By combining computer vision, real-time data, and AI agents, we created a tool that can give any address a flood risk score and mitigation plan in under 20 seconds. Starting in Houston, where we grew up and learned resilience, we’ve designed a system that can expand to help cities and communities across the globe prepare for and survive floods. What if we could teach AI to "see" flood risk the same way a civil engineer would assess a location?
What We Learned
Computer Vision for Urban Flood Risk
- Semantic Segmentation at Scale – We implemented Mask2Former with a Swin-Large backbone, trained on the Mapillary Vistas dataset, to extract fine-grained details from complex street-level scenes. This allowed us to identify the subtle urban features that determine how water moves and accumulates.
- Multi-Directional Context – Instead of relying on a single snapshot, we processed four directional views (0°, 90°, 180°, 270°) from Google Street View. This gave us a 360° understanding of each location’s surface conditions — from pavement and sidewalks to vegetation and drainage ditches.
- Flood-Relevant Class Mapping – Mapillary’s 65+ object classes (cars, sidewalks, trees, terrain, etc.) were mapped into flood-relevant categories such as asphalt (impermeable surfaces), greenery (absorption potential), and other (structures/obstacles). This translation was crucial for turning raw CV outputs into actionable flood risk metrics.
Flood Risk Mathematics
The core risk equation combines multiple normalized factors:
$$\text{Risk} = w_1 \cdot A + w_2 \cdot (1-G) + w_3 \cdot (1-S) + w_4 \cdot R + \text{penalties}$$
Where:
- A = Asphalt percentage (normalized)
- G = Greenery percentage (normalized)
- S = Slope percentage (normalized)
- R = Rainfall intensity (normalized)
- Weights: w_1=0.3, w_2=0.25, w_3=0.25, w_4=0.2
AI Agent Architecture
- Rule-based Decision Trees: Converting risk metrics into actionable interventions
- Cost Estimation Models: Dynamic pricing based on local conditions and intervention types
How We Built It
1. Computer Vision Pipeline
# Mask2Former detector with debug capabilities
detector = Mask2FormerDetector(config_path, debug=True)
surface_results = detector.analyze_local_images(image_paths)
# Output: {'asphalt': 23.9%, 'greenery': 39.6%, 'other': 36.5%}
2. Risk Assessment Engine
# Multi-factor risk calculation
risk_scorer = FloodRiskScorer(config_path)
risk_data = risk_scorer.calculate_flood_risk(
    rainfall_mm=25, asphalt_pct=23.9, slope_pct=1.09,
    greenery_pct=39.6, drain_pct=2.0
)
# Output: 43/100 risk score (MEDIUM)
3. AI Recommendation System
# Intelligent mitigation planning
insight_agent = ActionableInsightAgent()
recommendations = insight_agent.generate_insights(risk_data)
# Output: Bioswales ($47K) + Drainage upgrade ($140K) = 23% risk reduction
4. Integration Architecture
- Modular Design: Separate components for CV, risk scoring, and recommendations
- AI Insight: Standardized actions for
flood_risk_scoreandactionable_insight - Pipeline Chaining: Sequential execution with error handling and debug modes
Challenges Faced
1. Model Selection and Performance
Challenge: Choosing between YOLO, DeepLab, and Mask2Former for street scene segmentation.
Solution: Implemented all three and benchmarked on Houston test cases. Mask2Former with Mapillary Vistas training provided the best class granularity for urban infrastructure.
2. Class Mapping Complexity
Challenge: Mapillary Vistas has 65+ classes, but flood risk needs simplified categories.
Solution: Created a comprehensive mapping system:
CATEGORY_MAP = {
    "Road": "asphalt", "Sidewalk": "asphalt", "Car": "asphalt",
    "Vegetation": "greenery", "Tree": "greenery", "Terrain": "greenery",
    "Building": "other", "Sky": "other", "Person": "other"
}
3. Multi-directional Aggregation
Challenge: How to combine 4 different viewing angles into a single assessment.
Solution: Weighted averaging with outlier detection: $$\text{Final} = \frac{1}{n} \sum_{i=1}^{n} \text{Result}_i$$
4. Real-world Validation
Challenge: Ground-truth data for flood risk is sparse and location-specific.
Solution: Used known flood-prone areas (Houston, Miami Beach) and low-risk areas (SF hills) as validation benchmarks.
5. Cost Estimation Accuracy
Challenge: Infrastructure costs vary dramatically by location and project scale.
Solution: Implemented tiered pricing models with low/mid/high estimates:
# Bioswale cost calculation
base_cost = slope_pct * 1000 + 15000  # Base complexity
area_factor = max(0.1, min(1.0, slope_pct / 10))  # Scale factor
cost_range = (base_cost * 0.8, base_cost, base_cost * 1.5)
Technical Stack
Computer Vision & AI
- Transformers: Mask2Former, Hugging Face Transformers 4.30.0
- Deep Learning: PyTorch 2.0.0
- Computer Vision: OpenCV 4.8.0, Pillow 10.0.0
- AI Services: OpenAI API 4.104.0
Data Processing & Analysis
- Numerical Computing: NumPy 1.24.0, Matplotlib 3.7.0
- Image Processing: PIL (Pillow) 10.0.0, OpenCV 4.8.0
- Configuration: YAML, JSON, Environment Variables
Frontend Technologies
- UI Framework: React 19.1.1, React Router DOM 6.30.1
- Build Tools: Vite 4.5.3
- Styling: Tailwind CSS 3.4.17, Framer Motion 12.23.16
- State Management: Redux Toolkit 2.9.0, Redux Persist 6.0.0
- Maps & Visualization: React Leaflet 5.0.0, Leaflet 1.9.4, Recharts 3.2.1
Backend Technologies
- Runtime: Node.js, Python 3.8+
- Web Framework: Express 5.1.0
- HTTP & APIs: Axios 1.12.2, CORS 2.8.5
- Environment: Dotenv 17.2.2, Nodemon 3.1.10
Geospatial & Mapping
- APIs: Google Street View API, Google Elevation API, OpenWeather API, OpenAI API
- Data Formats: DEM (Digital Elevation Model), GeoTIFF (.tif)
- Processing: GDAL, Whitebox Tools, Turf.js 7.2.0, Proj4 2.19.10
Development Tools
- Development: Concurrently 9.1.0, ESLint 9.35.0, Git
- Package Management: npm/yarn
- Build & Deployment: Vite, Nodemon
Results and Impact
Validation Results
- Houston Test: 23.9% asphalt, 39.6% greenery → 43/100 risk (MEDIUM) ✅
- Processing Speed: 18 seconds for complete analysis pipeline
- Accuracy: Correctly identified high-risk Houston Bayou vs. low-risk SF hills
Real-World Applications
- Community Resilience – Give residents and local leaders instant, street-level flood risk scores and clear mitigation steps, empowering families to prepare before the water rises.
- City Planning & Infrastructure – Help planners identify vulnerable intersections, schools, and clinics, and prioritize drainage upgrades in underserved neighborhoods.
- Disaster Response – Provide emergency managers with fast, address-specific intelligence to guide shelter placement, supply distribution, and evacuation routes in real time.
- Global Scalability – Expand beyond Houston by adapting the model to flood-prone regions worldwide (e.g., Pakistan’s 2022 floods, New York’s Ida event, Mumbai monsoons), creating a universal framework for resilience.
Future Enhancements
- Historical Validation: Correlate predictions with actual flood events
- Real-time Weather Integration: Dynamic risk updates during storm events
- Community Engagement: Crowdsourced drainage infrastructure mapping
- Economic Modeling: ROI calculations for mitigation investments
Storm represents the convergence of computer vision, geospatial intelligence, and climate resilience planning, transforming how we understand and mitigate urban flood risk at the street level.
Built With
- digital-elevation-model
- express.js
- gdal
- geotiff
- google-elevation-api
- google-streetview
- json
- leaflet.js
- mask2former
- matplotlib
- node.js
- numpy
- openai
- opencv
- pillow
- python
- pytorch
- react
- recharts
- tailwind
- vite
- yaml
- yarn


Log in or sign up for Devpost to join the conversation.