Here is a complete, hackathon-style writeup tailored for your project.
Inspiration When natural disasters strike, emergency teams fight a constant battle against time. Wildfires burn thousands of acres per hour, and floodwaters shift rapidly, yet responders often rely on outdated maps or slow, manual aerial surveys to understand where the danger zone actually is. Raw satellite imagery is abundant, but converting a massive multi-gigabyte raster image into an actionable boundary map typically takes hours of manual GIS work. We built this project to bridge that gap—turning orbital satellite data into instant, AI-detected disaster perimeters when every minute counts.
What it does Our project automatically ingests satellite imagery and detects active disaster boundaries in real time.
Automated Segmentation: The model processes satellite rasters to isolate the exact perimeter line of a hazard, such as active wildfire fronts, flood inundation borders, or landslide edges.
Vector Generation: It instantly converts raw pixel predictions into clean, lightweight vector boundaries (GeoJSON format).
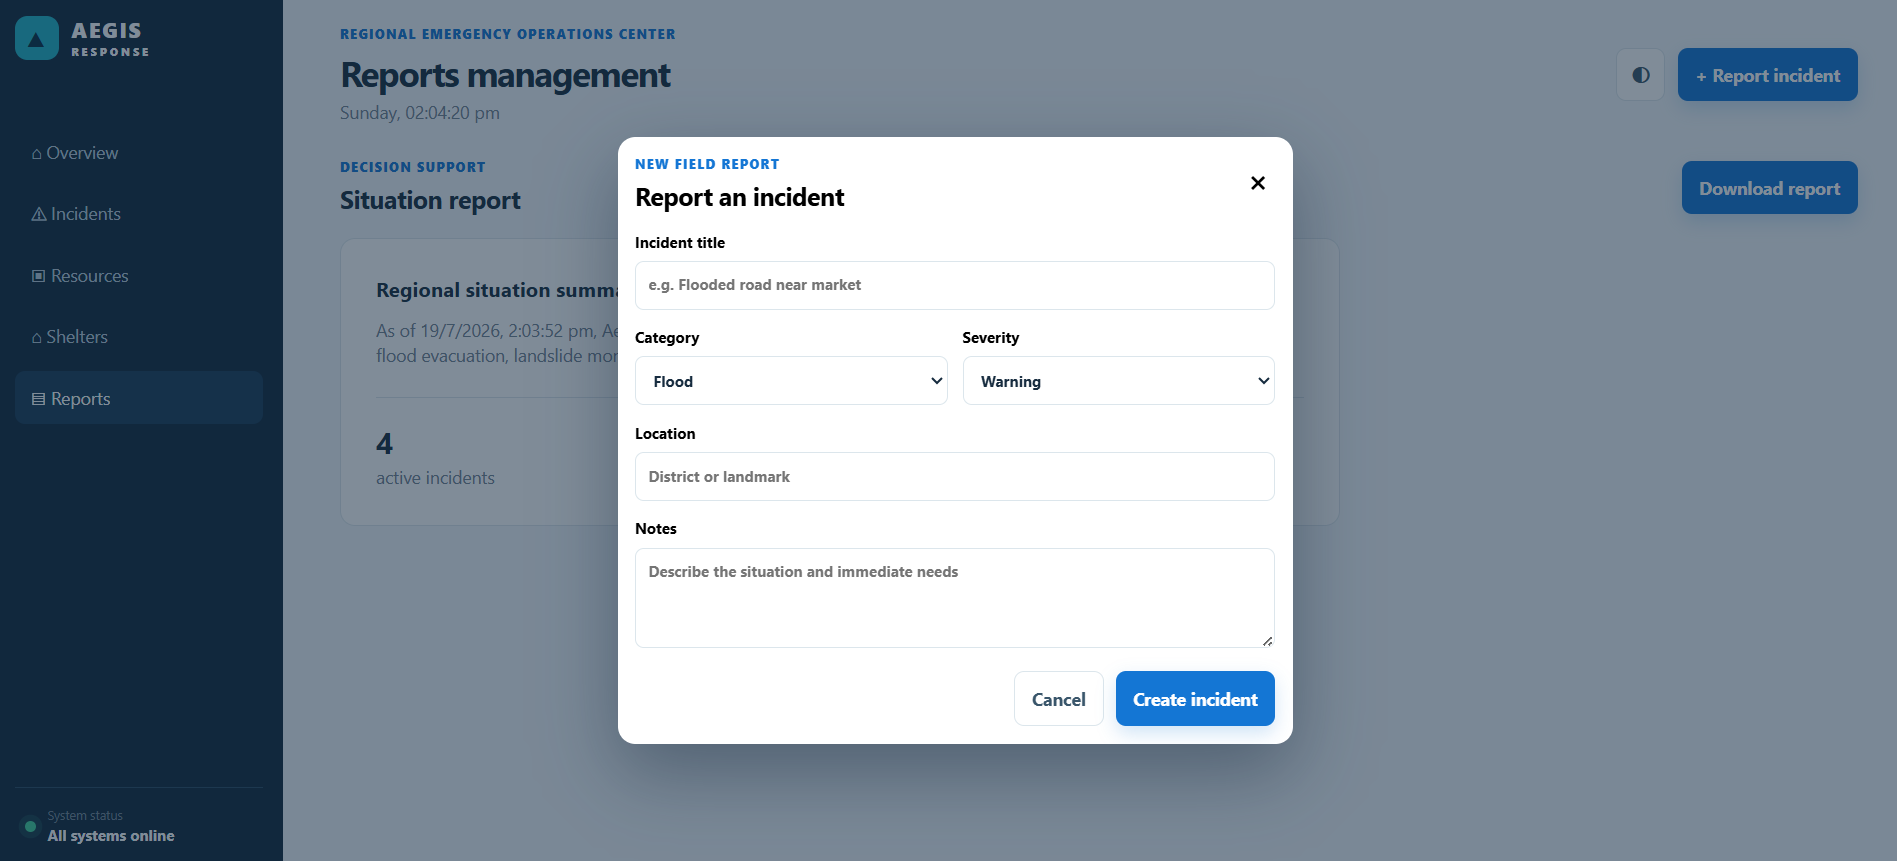
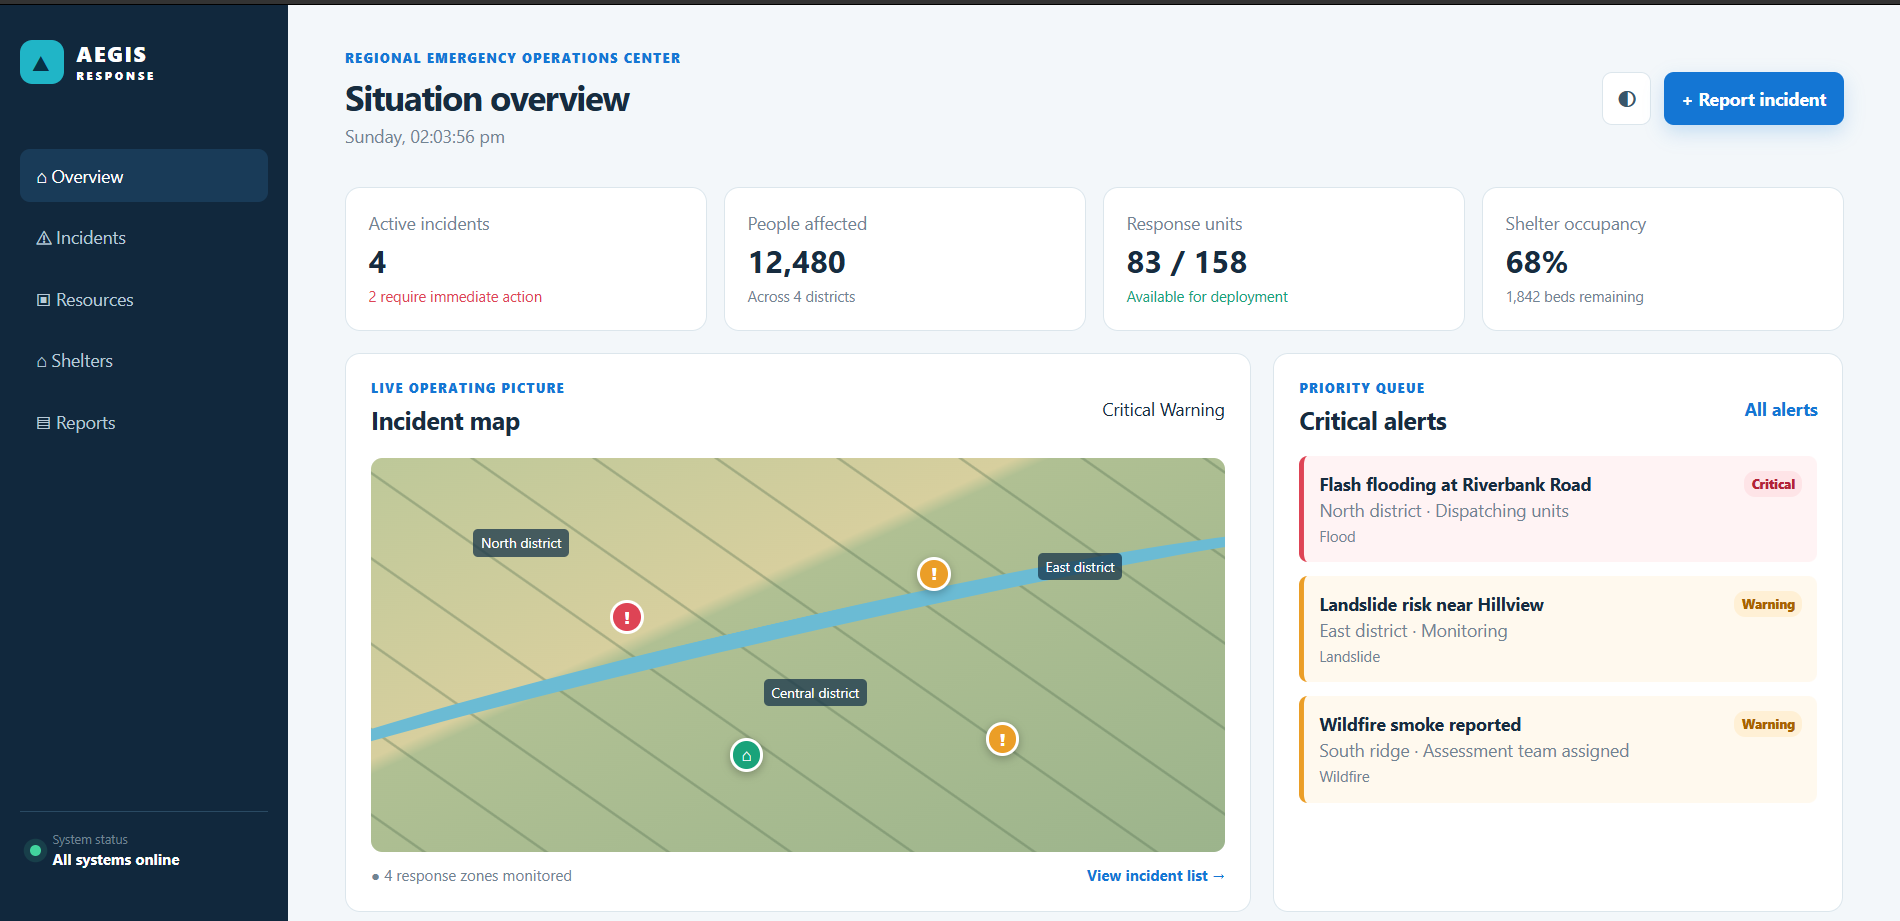
Interactive Dashboard: Responders can view the predicted disaster line overlaid on a live map interface, allowing them to track how perimeters expand over time and plan targeted evacuations.
How we built it Data Pipeline: We fetched satellite imagery (such as Sentinel-2 optical and multi-spectral bands) using geospatial Python libraries like rasterio and GDAL to crop, normalize, and split massive satellite GeoTIFF files into manageable patches.
Model Architecture: We trained a semantic segmentation network (using a U-Net architecture with an EfficientNet backbone in PyTorch) on labeled disaster datasets like xBD and SpaceNet. We leveraged specific non-visible bands, such as Short-Wave Infrared (SWIR), to penetrate smoke and highlight active fire fronts.
Post-Processing Pipeline: Raw model mask predictions were converted into simplified vector lines using OpenCV and Shapely to eliminate noise and export clean GeoJSON coordinates.
Web App: The backend was built with FastAPI to serve model predictions, and the frontend uses Mapbox GL JS to display the disaster vectors over real-world terrain maps.
Challenges we ran into Handling Geospatial Formats: Standard computer vision pipelines expect small 3-channel RGB JPEG images. Satellite files are multi-spectral, huge, and carry complex spatial metadata (CRS projections) that required careful spatial alignment.
Smoke, Clouds, and Occlusion: Optical satellite imagery is easily blocked by heavy cloud cover or thick smoke plumes right over the active disaster line.
Class Imbalance: Disaster lines represent a tiny fraction of total pixels across vast regional satellite passes, making standard cross-entropy loss functions ineffective. We had to tune custom Dice and Focal Loss metrics to force the model to prioritize thin boundary features.
Polygonization Noise: Converting noisy pixel masks into clean, continuous line vectors without creating tens of thousands of tiny, irrelevant polygon artifacts was a major post-processing hurdle.
Accomplishments that we're proud of High Edge Precision: Achieved strong segmentation accuracy on active wildfire fronts even in smoke-heavy regions by utilizing non-visible infrared spectrum bands.
Sub-Minute Pipeline: Built an end-to-end flow that goes from downloading a raw GeoTIFF file to outputting interactive GeoJSON lines on the frontend in under 30 seconds.
Lightweight Outputs: Successfully reduced complex multi-gigabyte imagery into vector files smaller than 100 KB, making them easy to stream to emergency responders in low-bandwidth disaster zones.
What we learned Pre-trained RGB weights aren't enough: Standard ImageNet weights are great for everyday photos, but satellite imagery requires deep domain adaptation to make use of multi-spectral data like NIR and SWIR.
Usability matters as much as accuracy: Emergency managers don't need raw heatmaps or dense pixel masks; they need simple, clean vector lines that easily plug into their existing GIS tools (like QGIS or ATAK).
What's next for the disaster line model SAR Integration: Incorporate Synthetic Aperture Radar (SAR) satellite data (such as Sentinel-1) so the model can map disaster lines through thick clouds, severe smoke, or during night passes.
Predictive Movement: Combine real-time wind speed, soil moisture, and topographic elevation data (DEM) with our detected boundary lines to predict where the disaster perimeter will shift in the next 6 to 12 hours.
Direct Field Integration: Build a direct export plugin for standard first-responder platforms like ATAK (Android Tactical Assault Kit) to deliver real-time boundary updates directly to field devices.

Log in or sign up for Devpost to join the conversation.