-
-
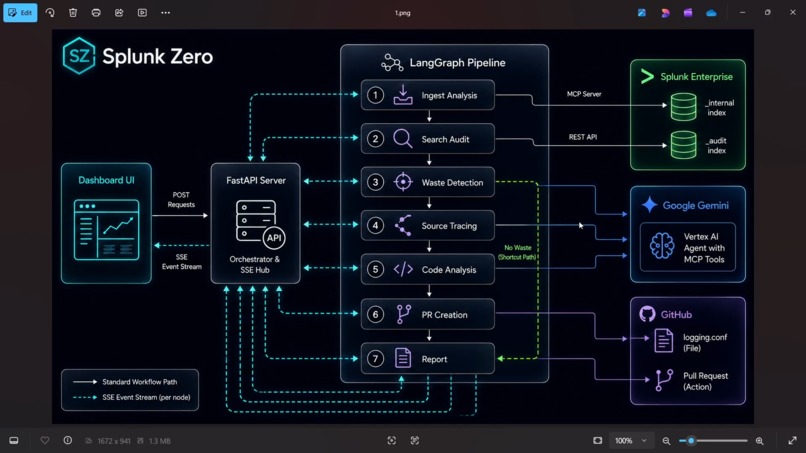
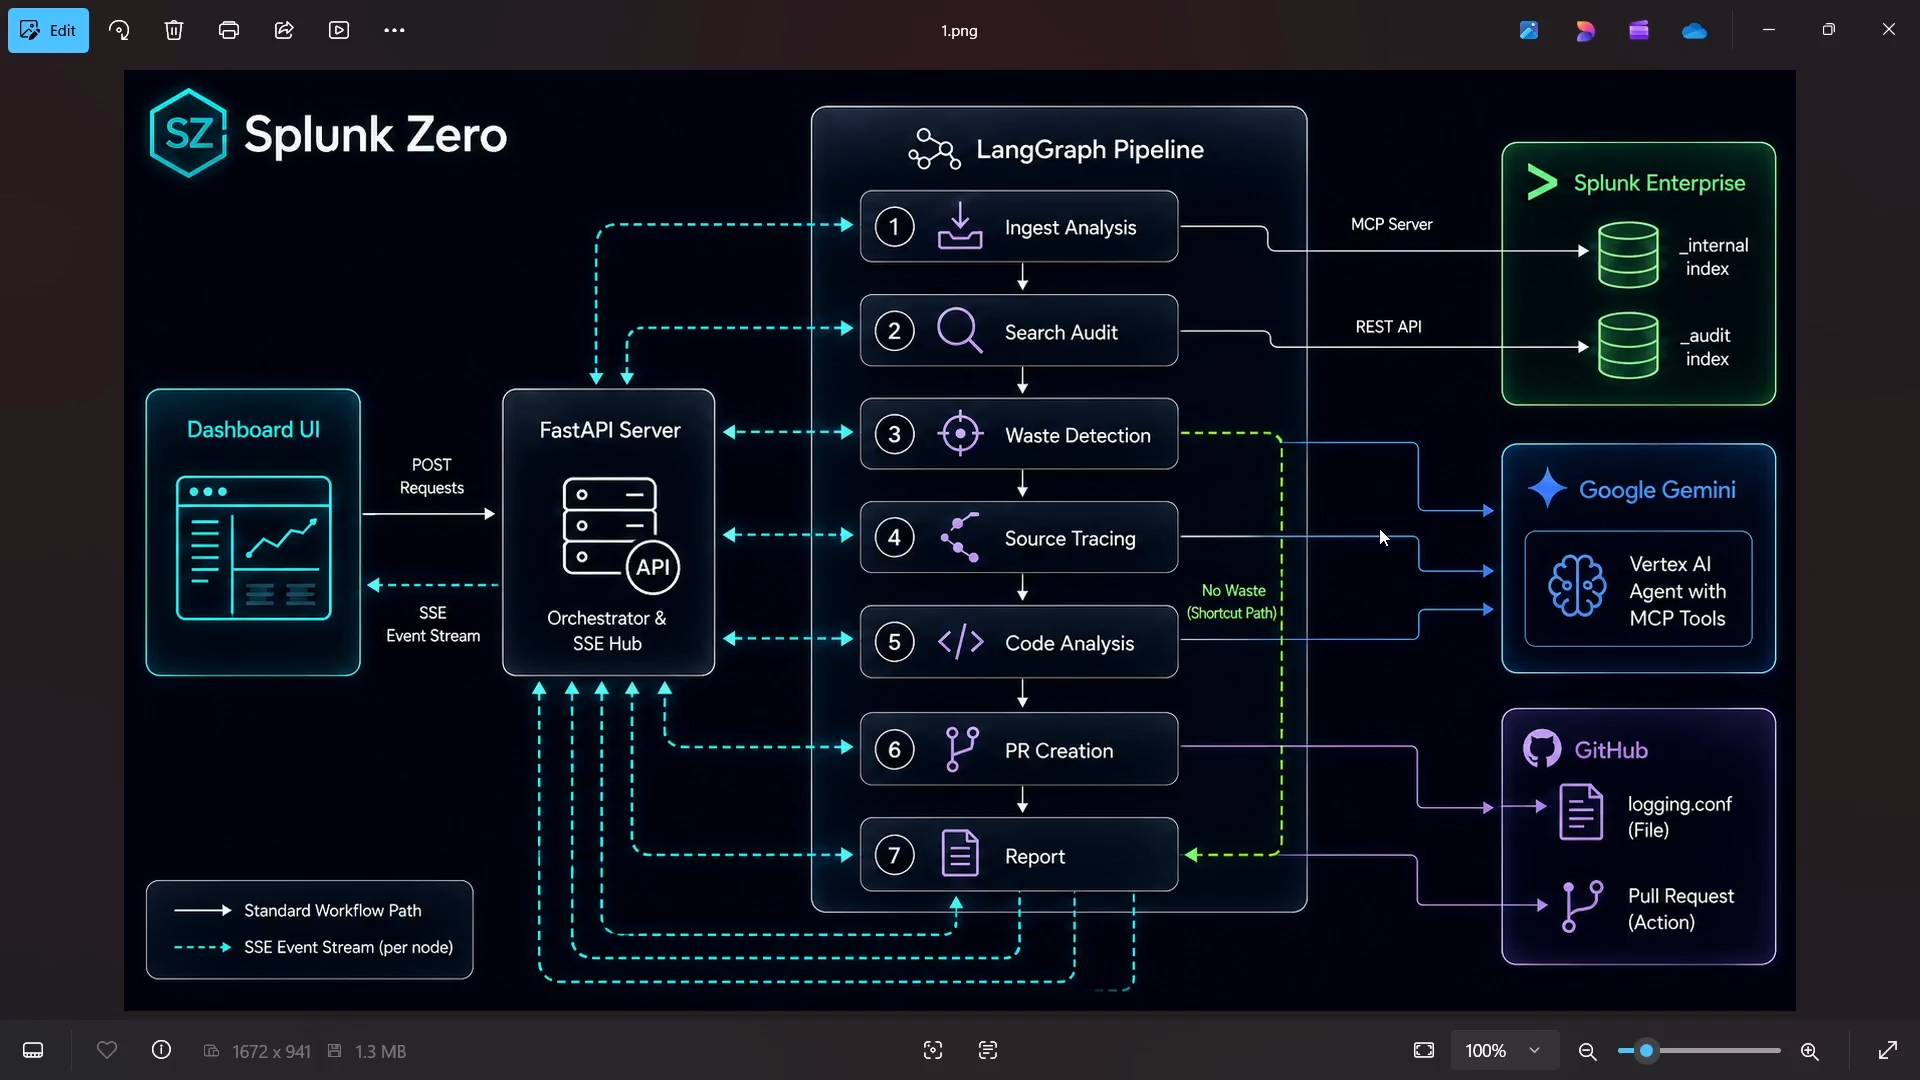
Architecture - Splunk evidence to LangGraph agent to GitHub PR
-
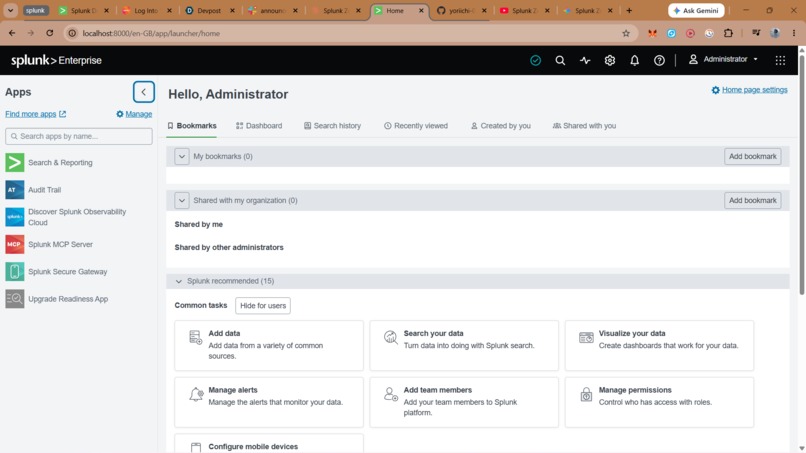
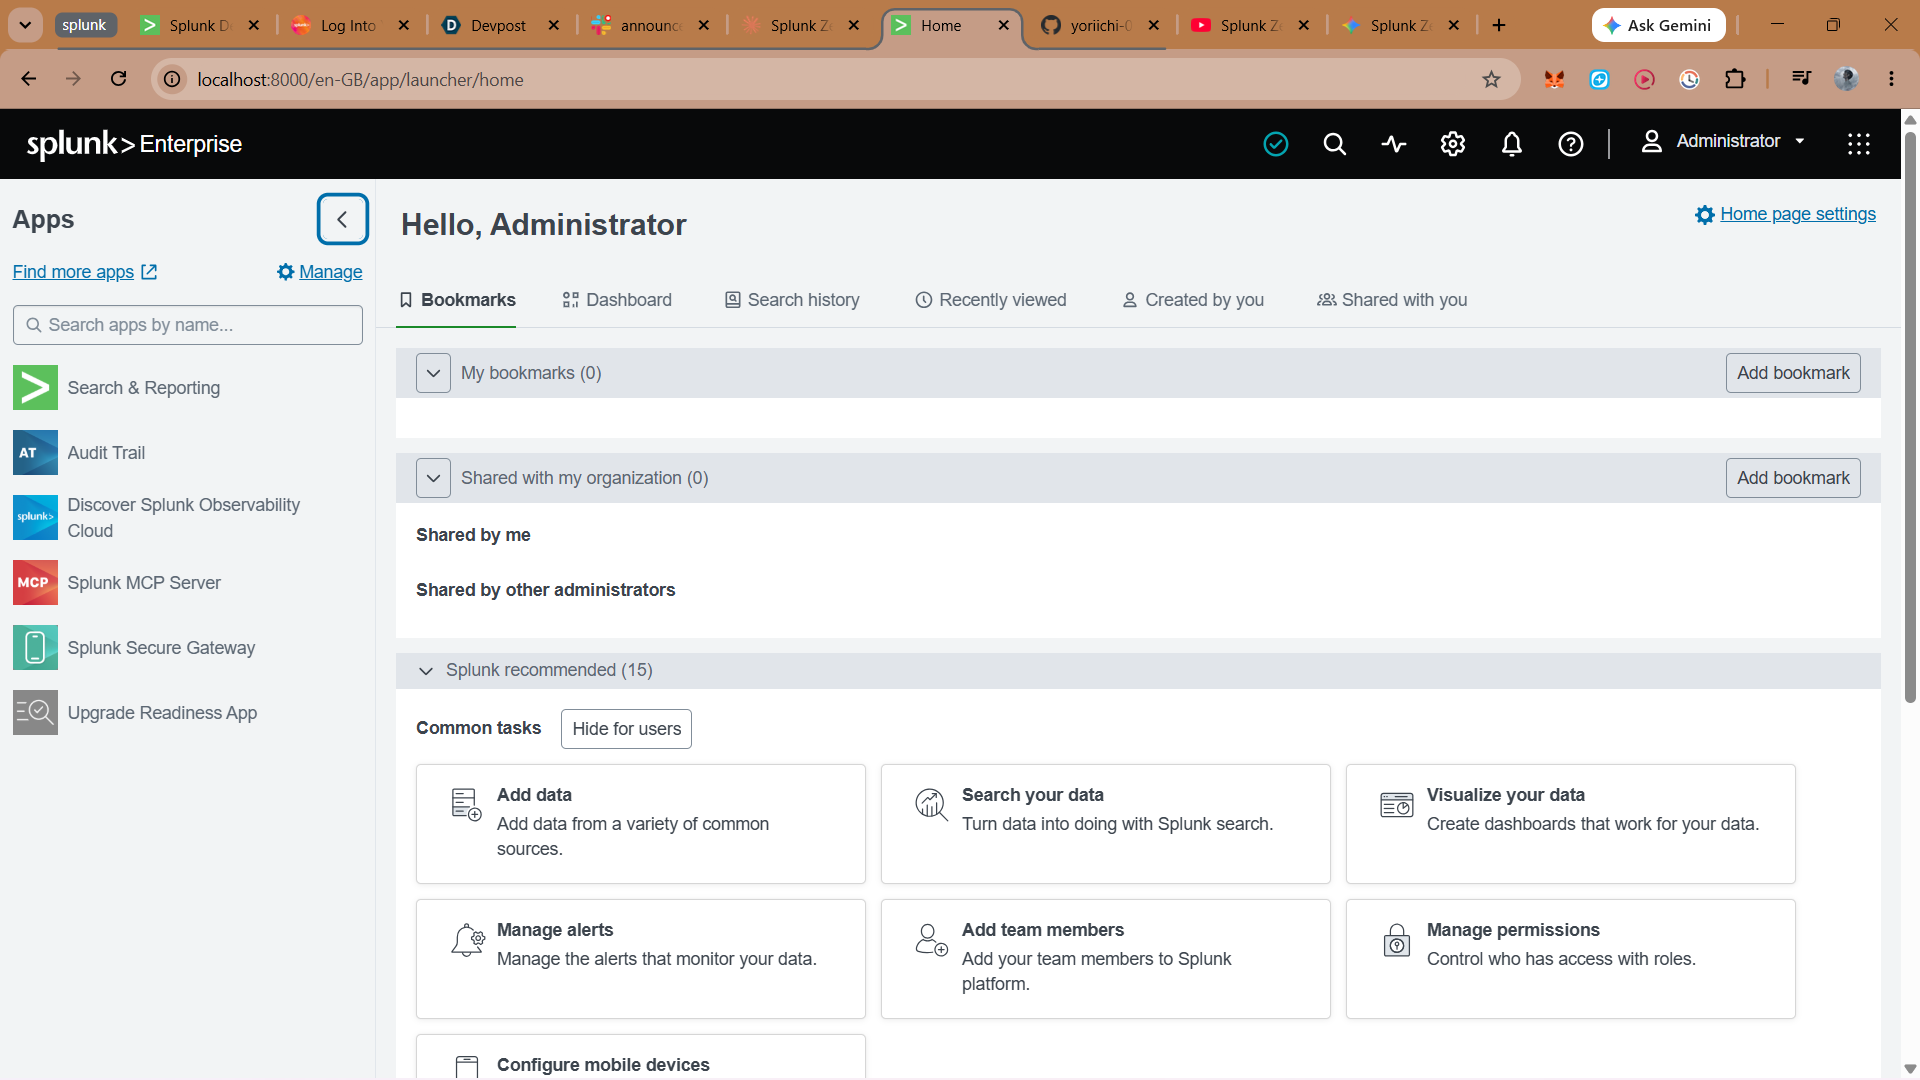
Splunk Enterprise running locally (This is the heart which provides access to splunk mcp)
-
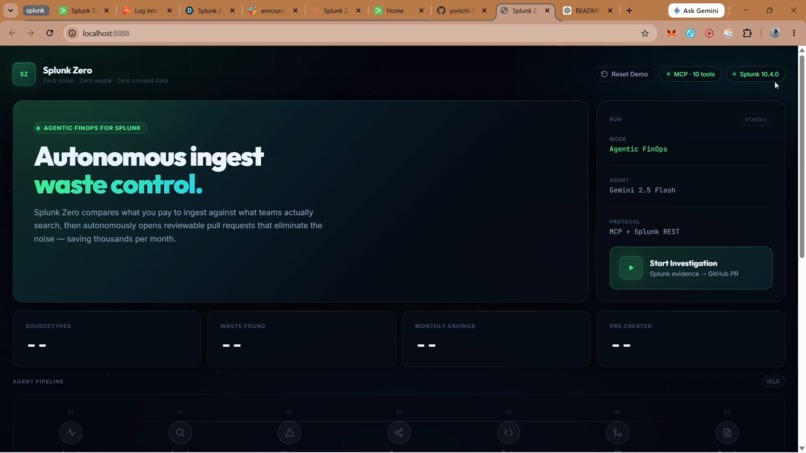
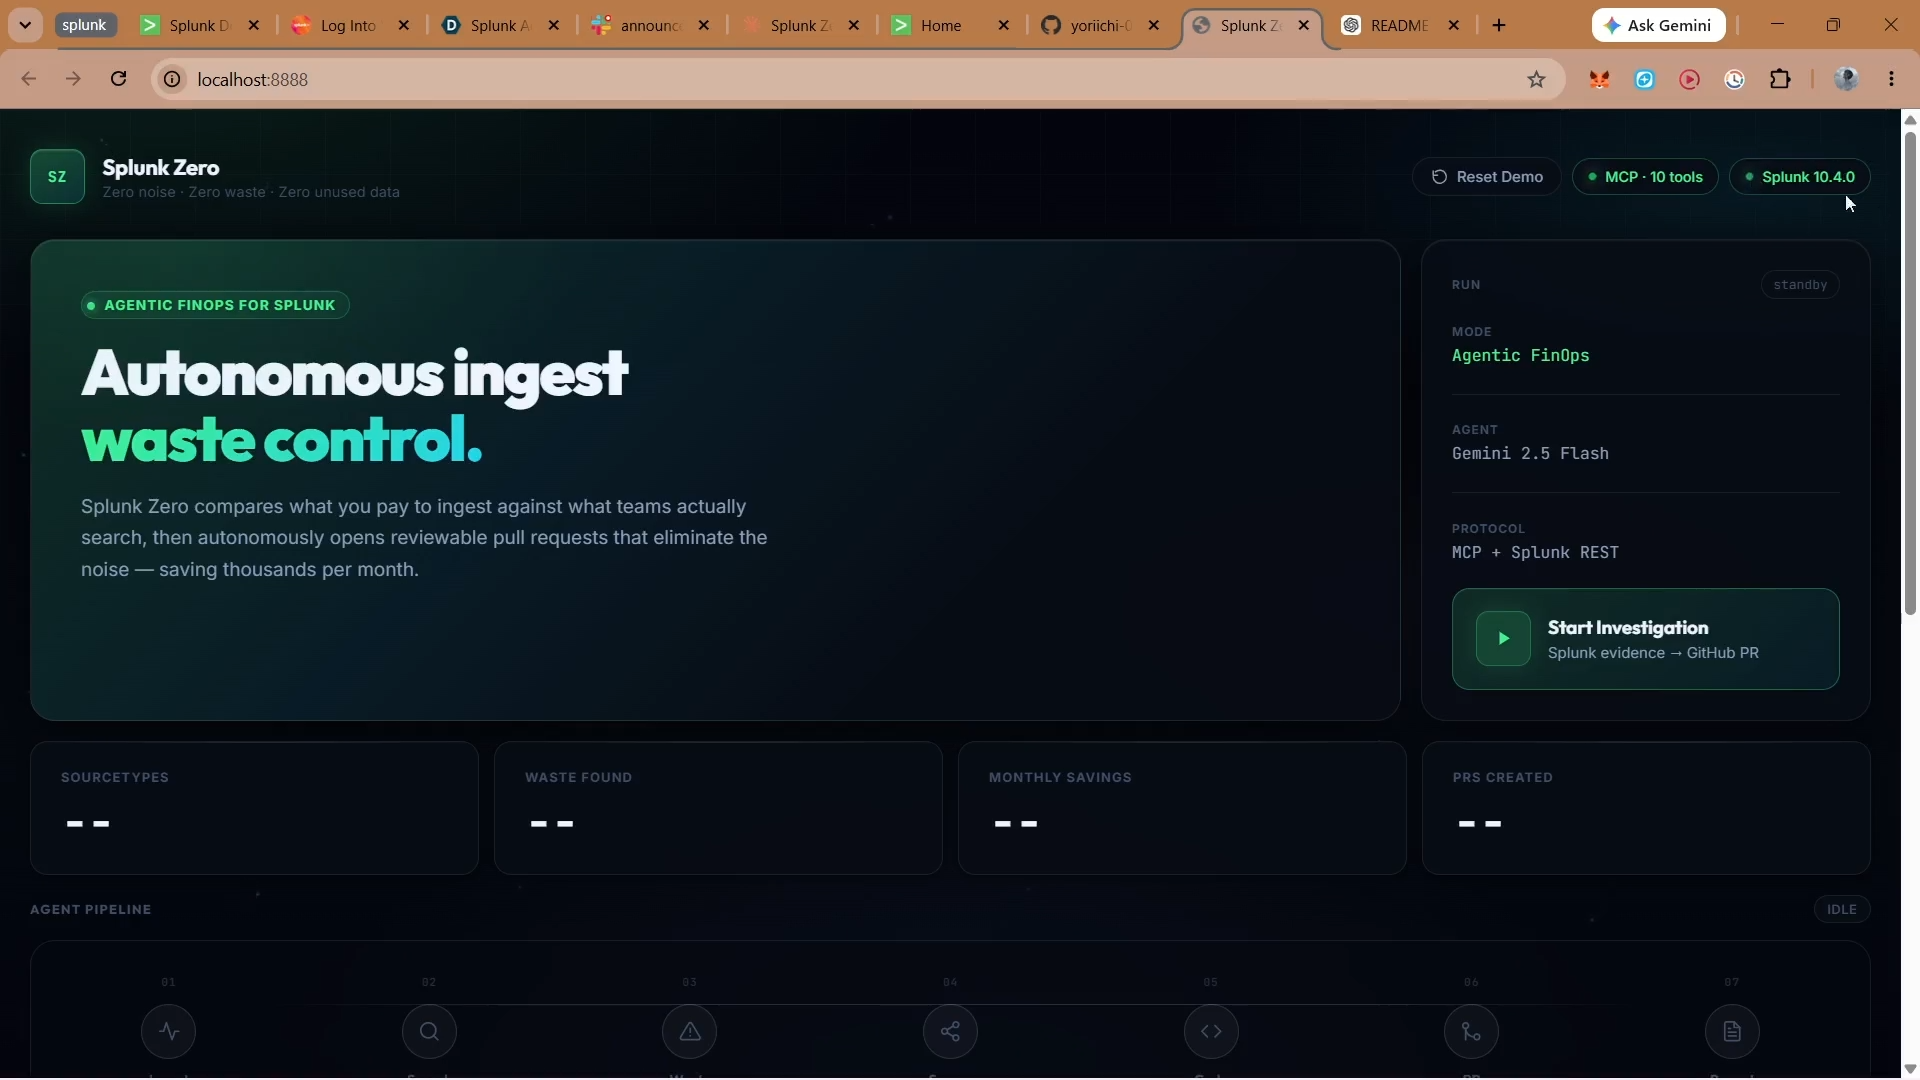
MCP connection active — 10 Splunk MCP tools available (green badge = live MCP SSE connection)
-
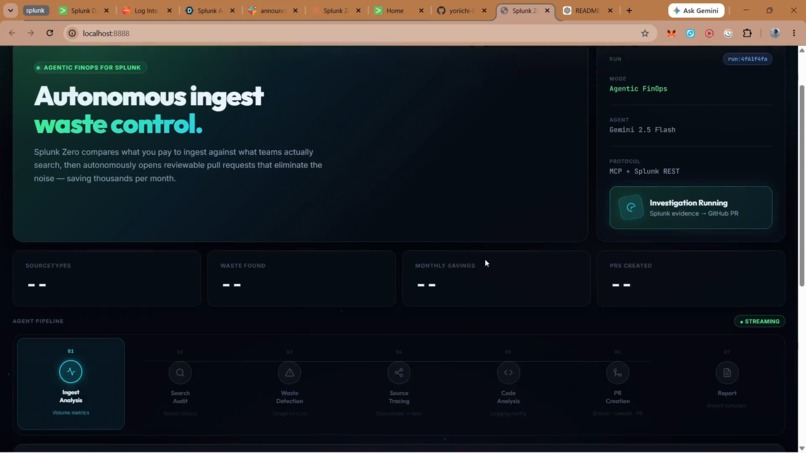
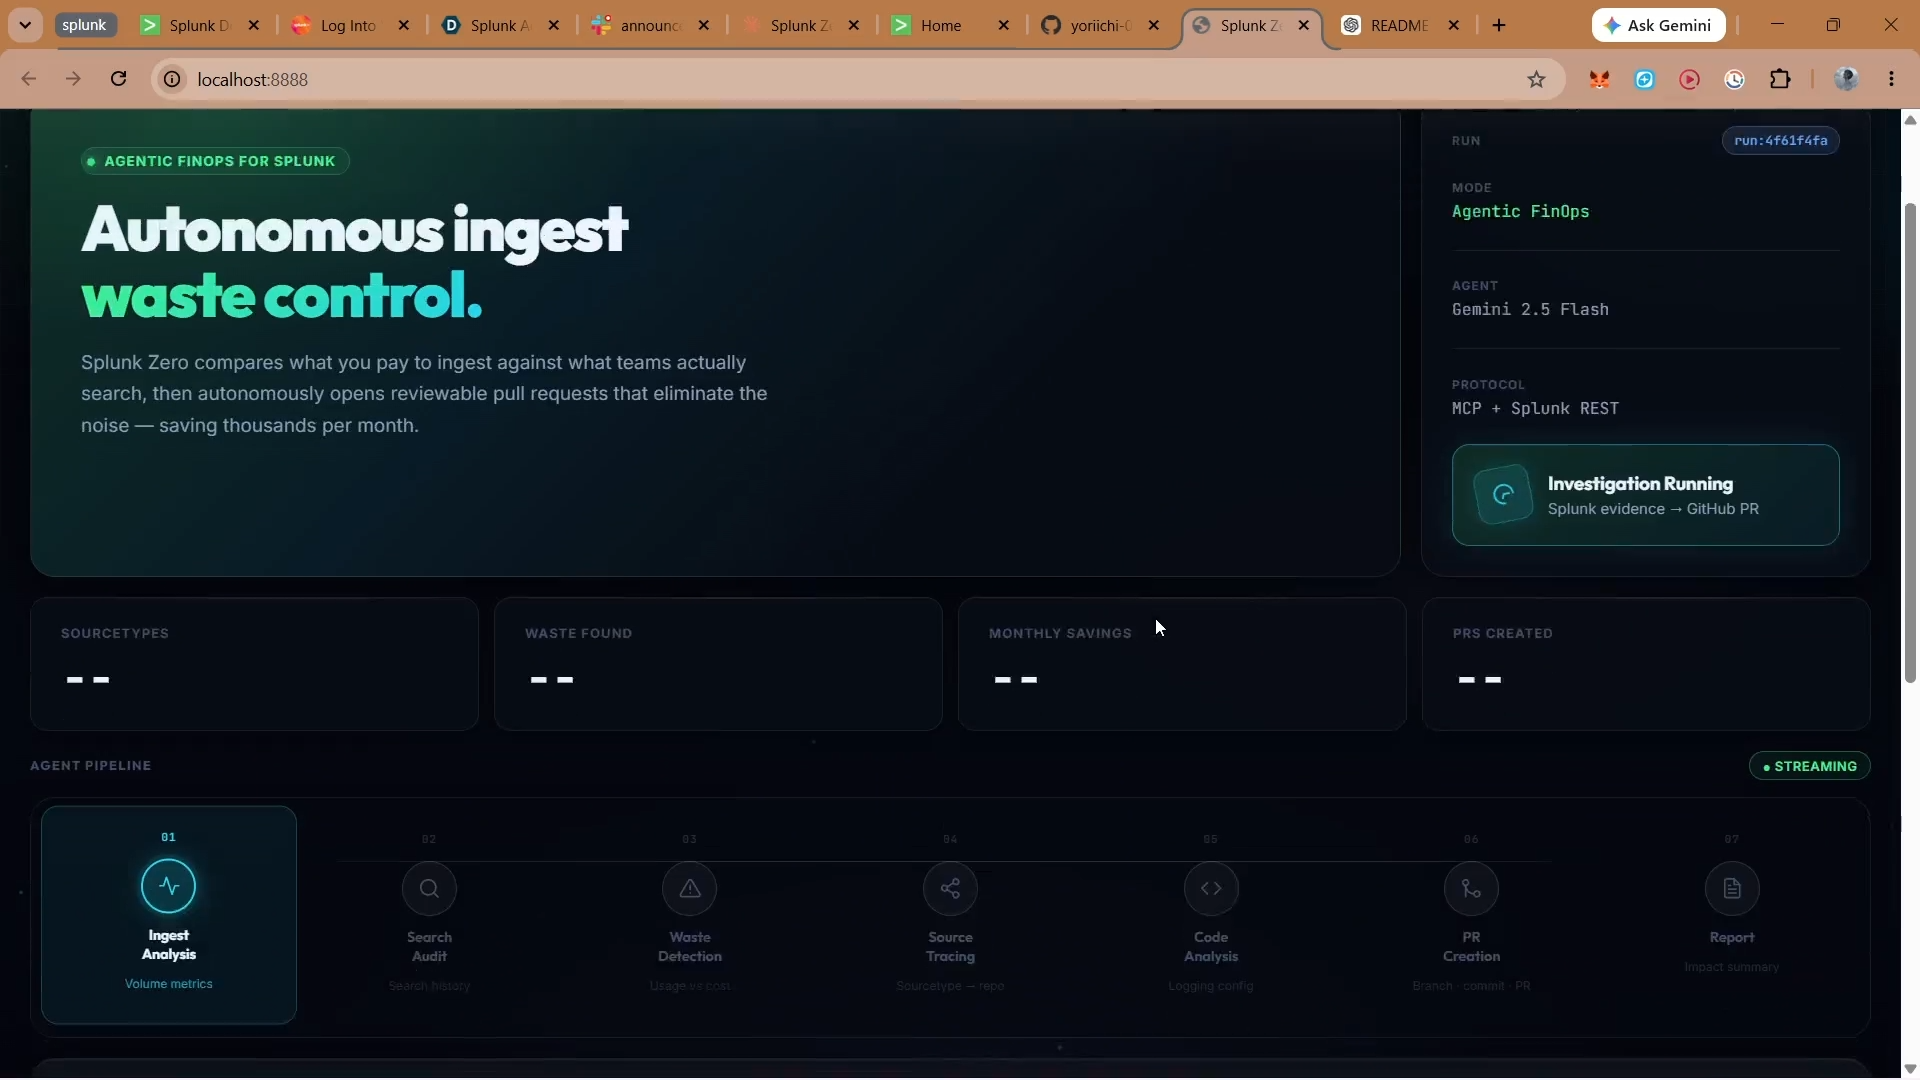
Investigation started — pipeline streaming live, Ingest Analysis node active
-
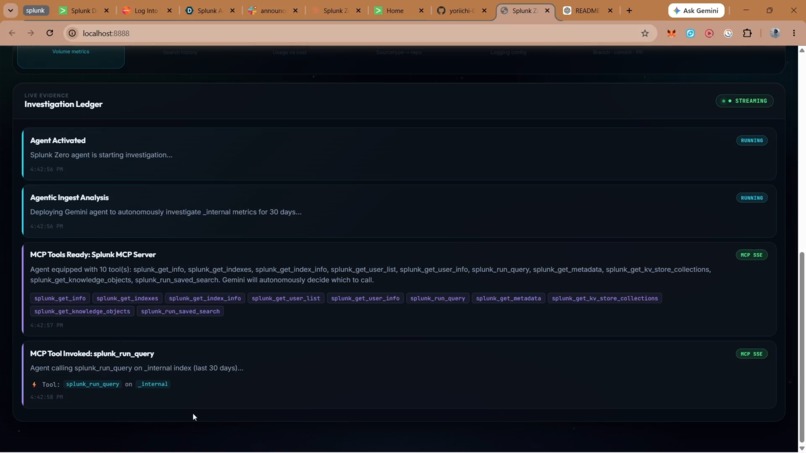
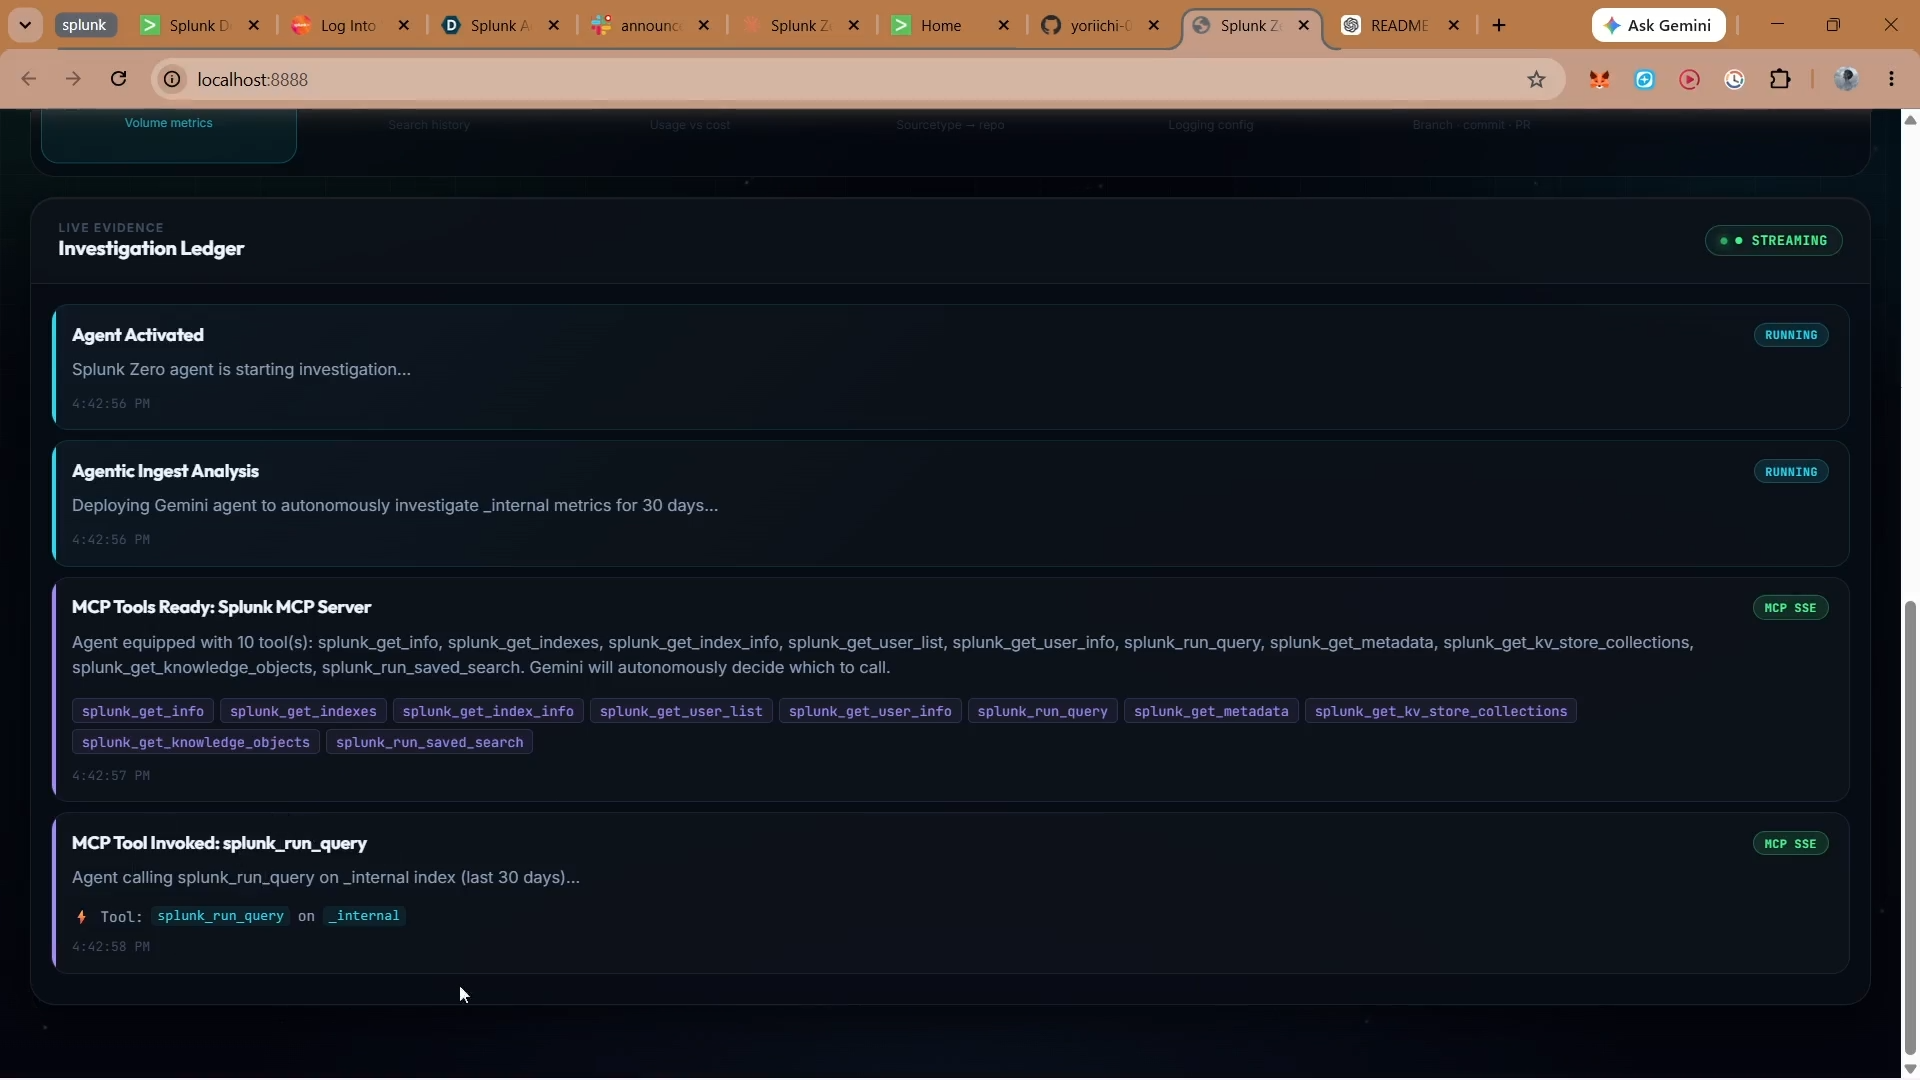
MCP tools discovered — agent autonomously calls splunk_run_query on _internal index via MCP SSE
-
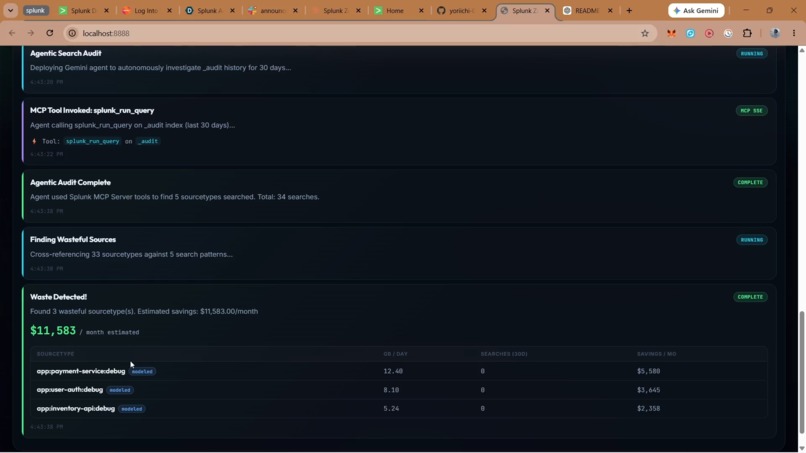
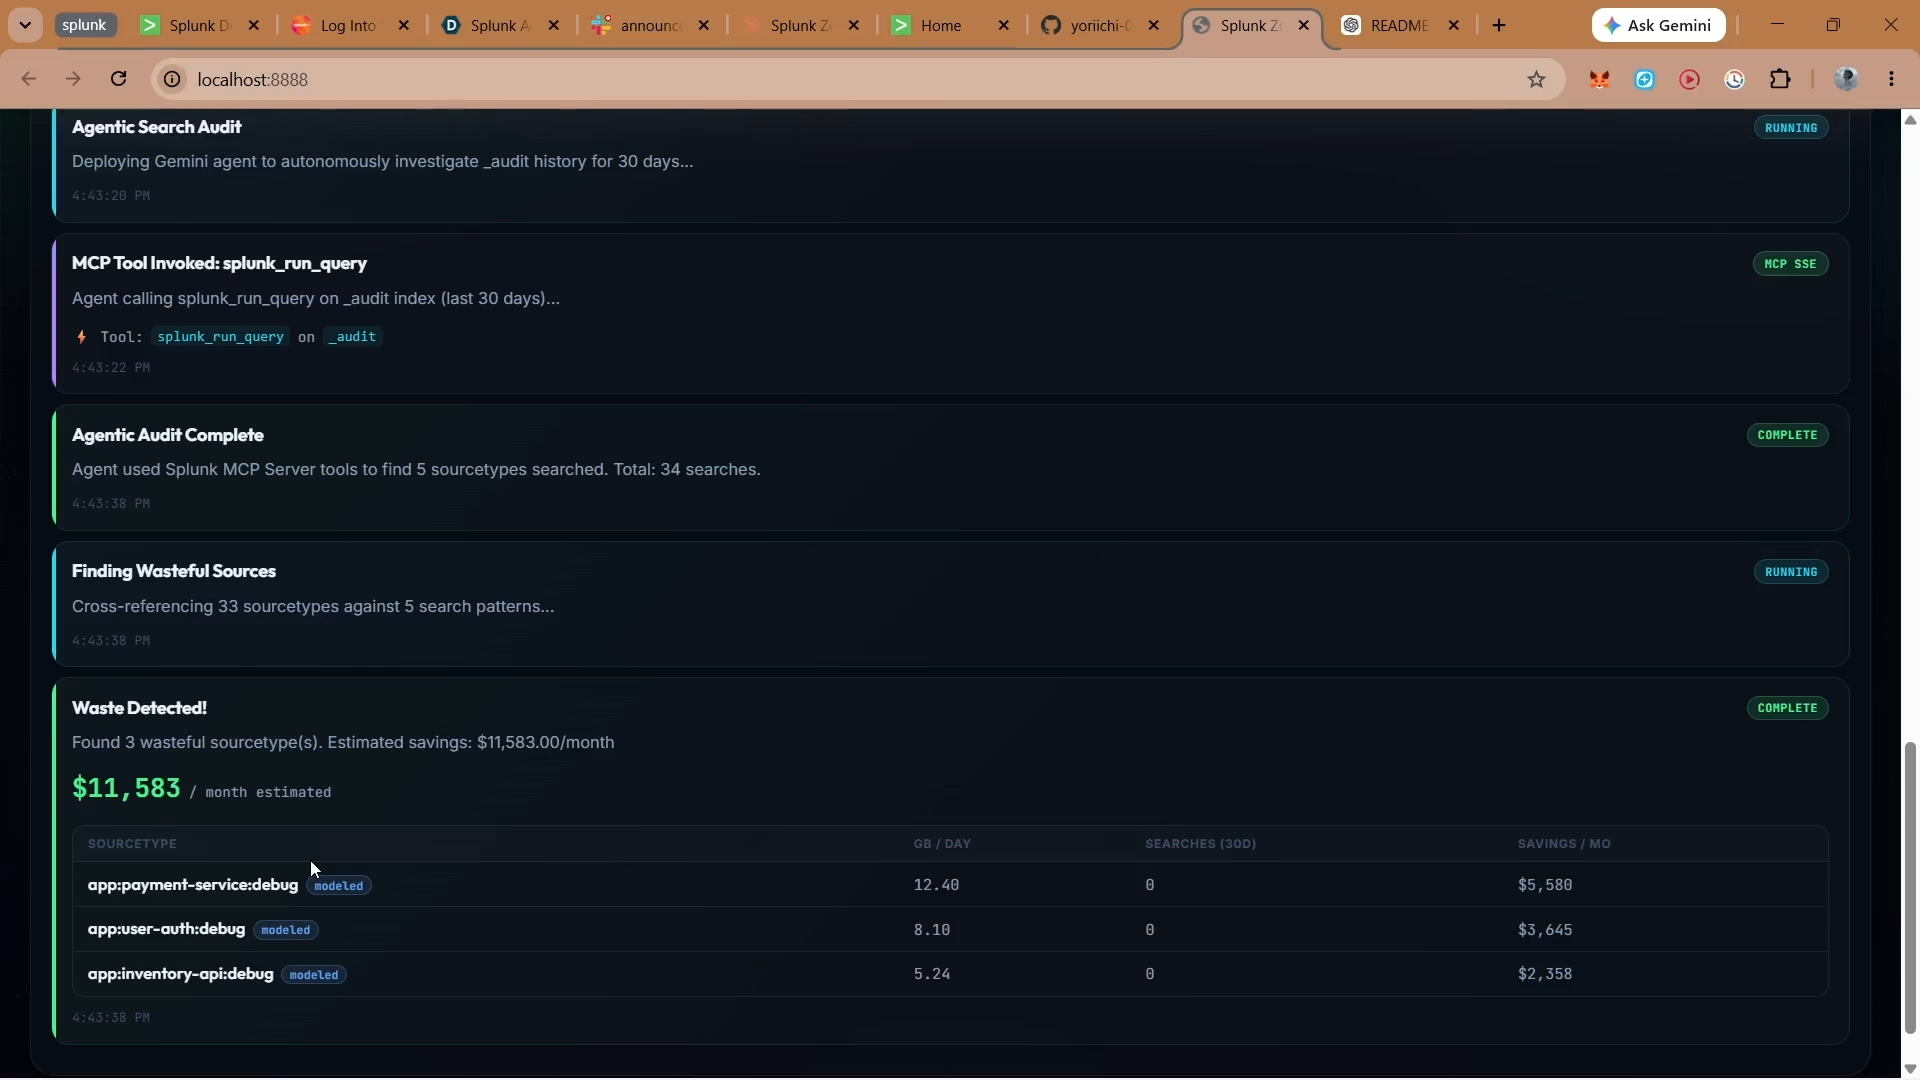
Uses Splunk MCP server to call _audit index and finds waste application sourcetypes
-
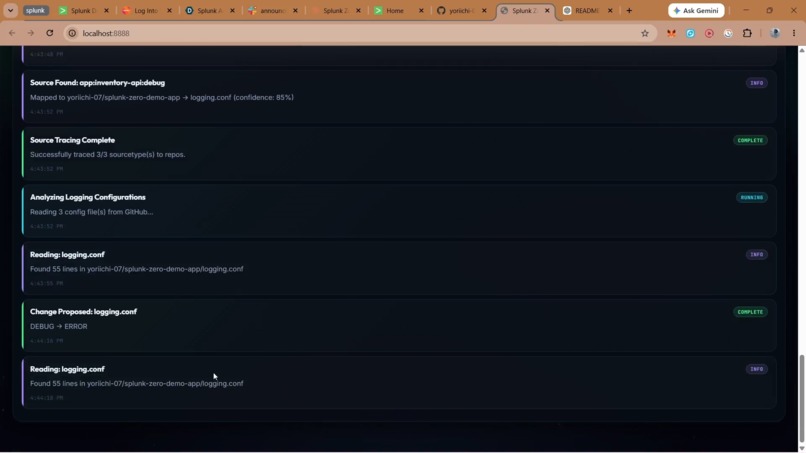
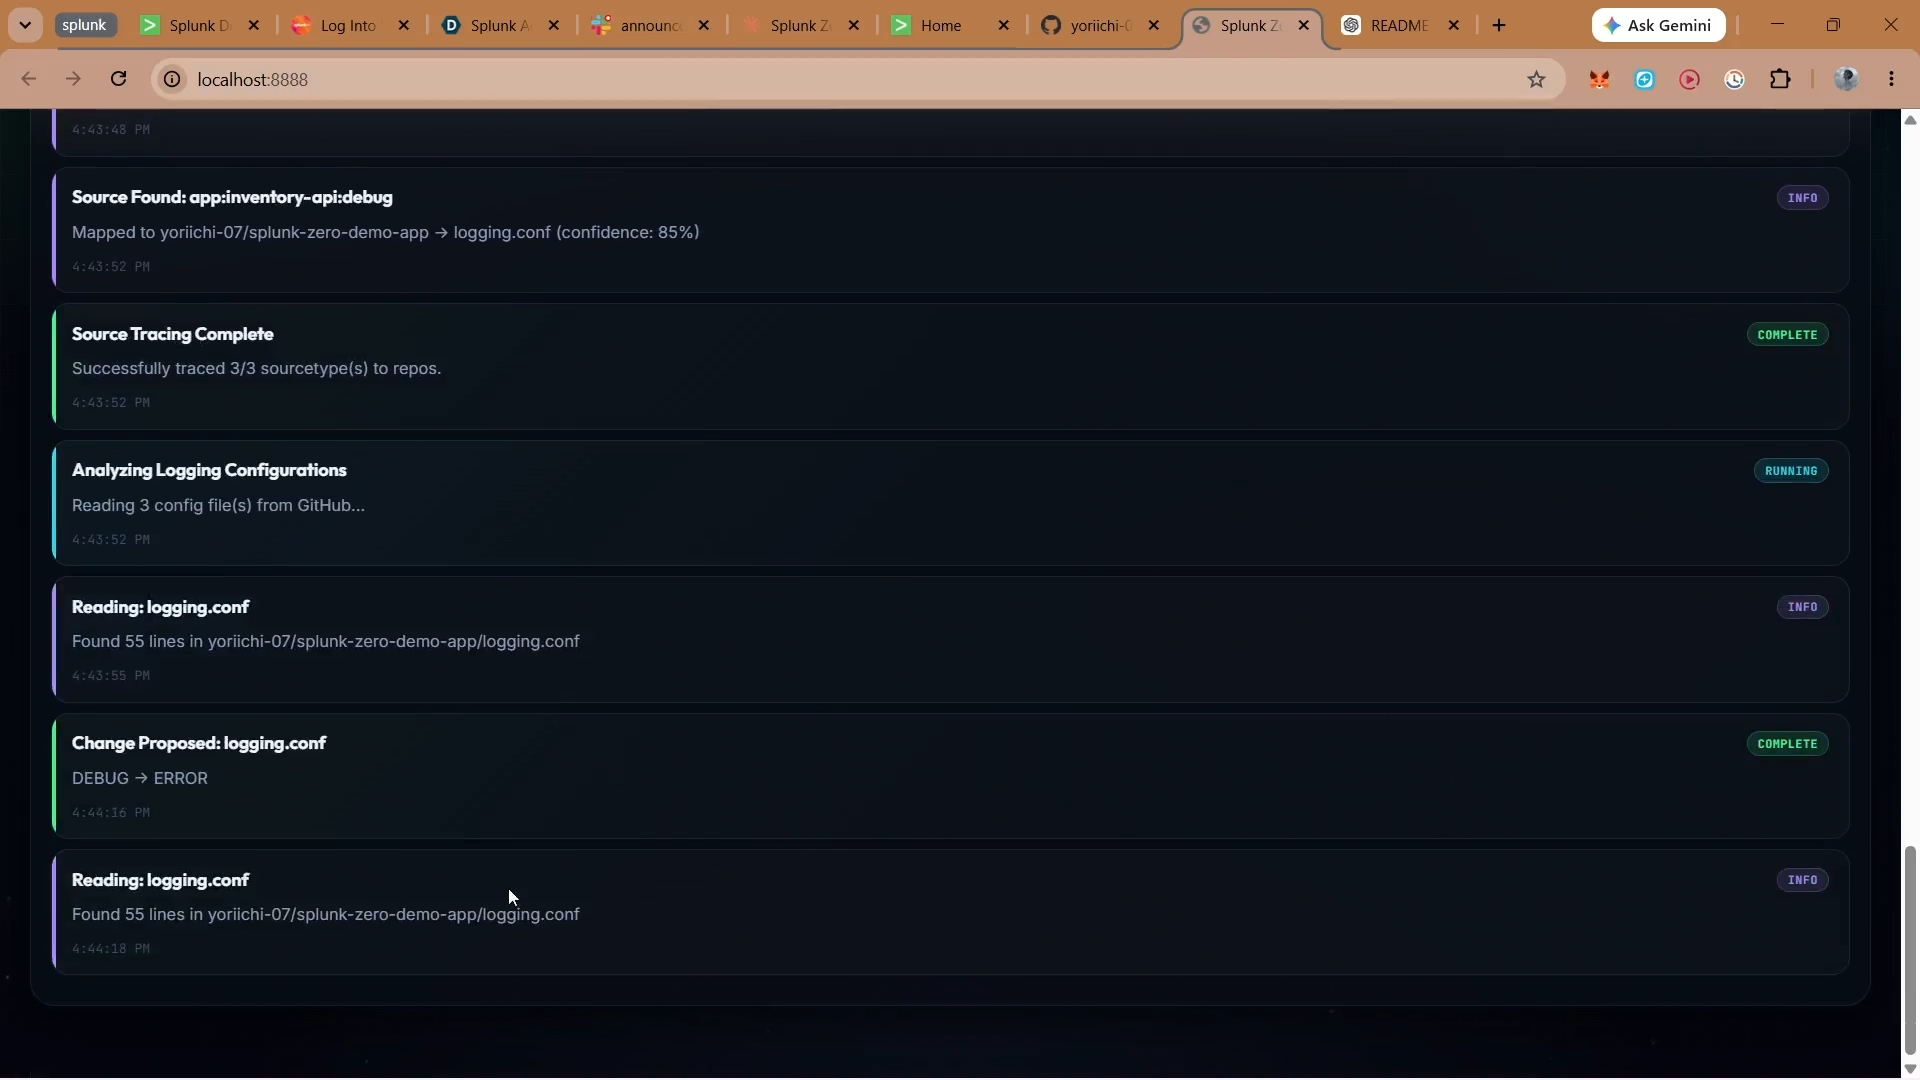
AI agent (uses gemini 2.5) for reading the logging configuration and to propose changes
-
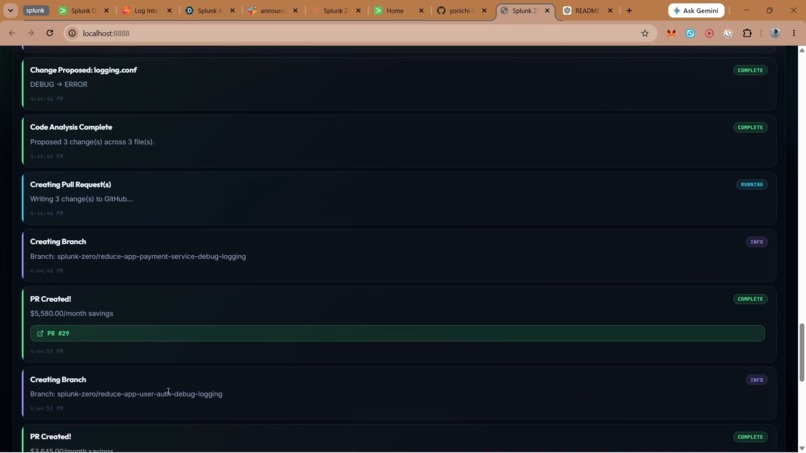
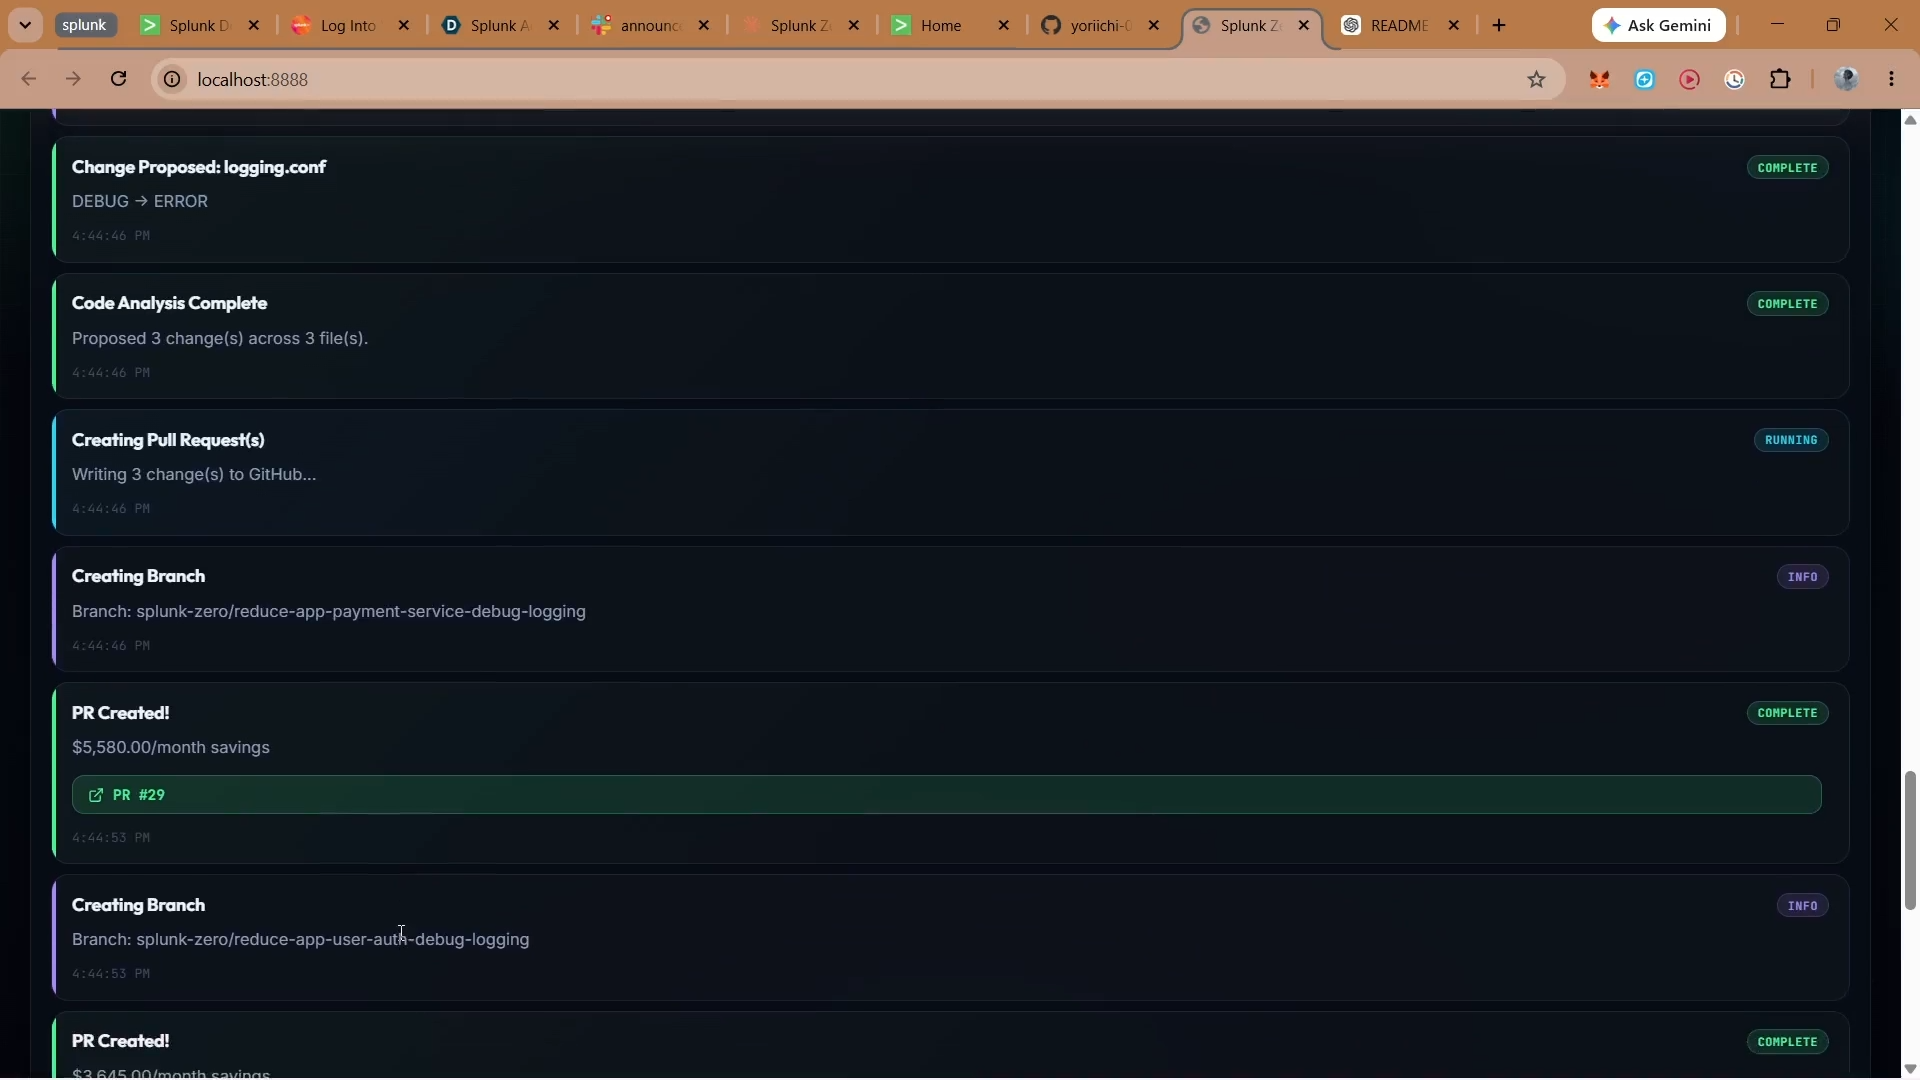
PR creation — branches created, pull requests opened with cost evidence for each wasteful source
-
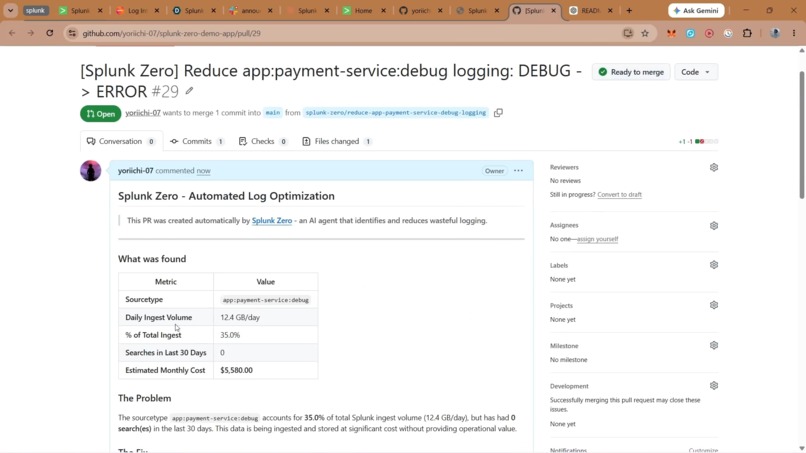
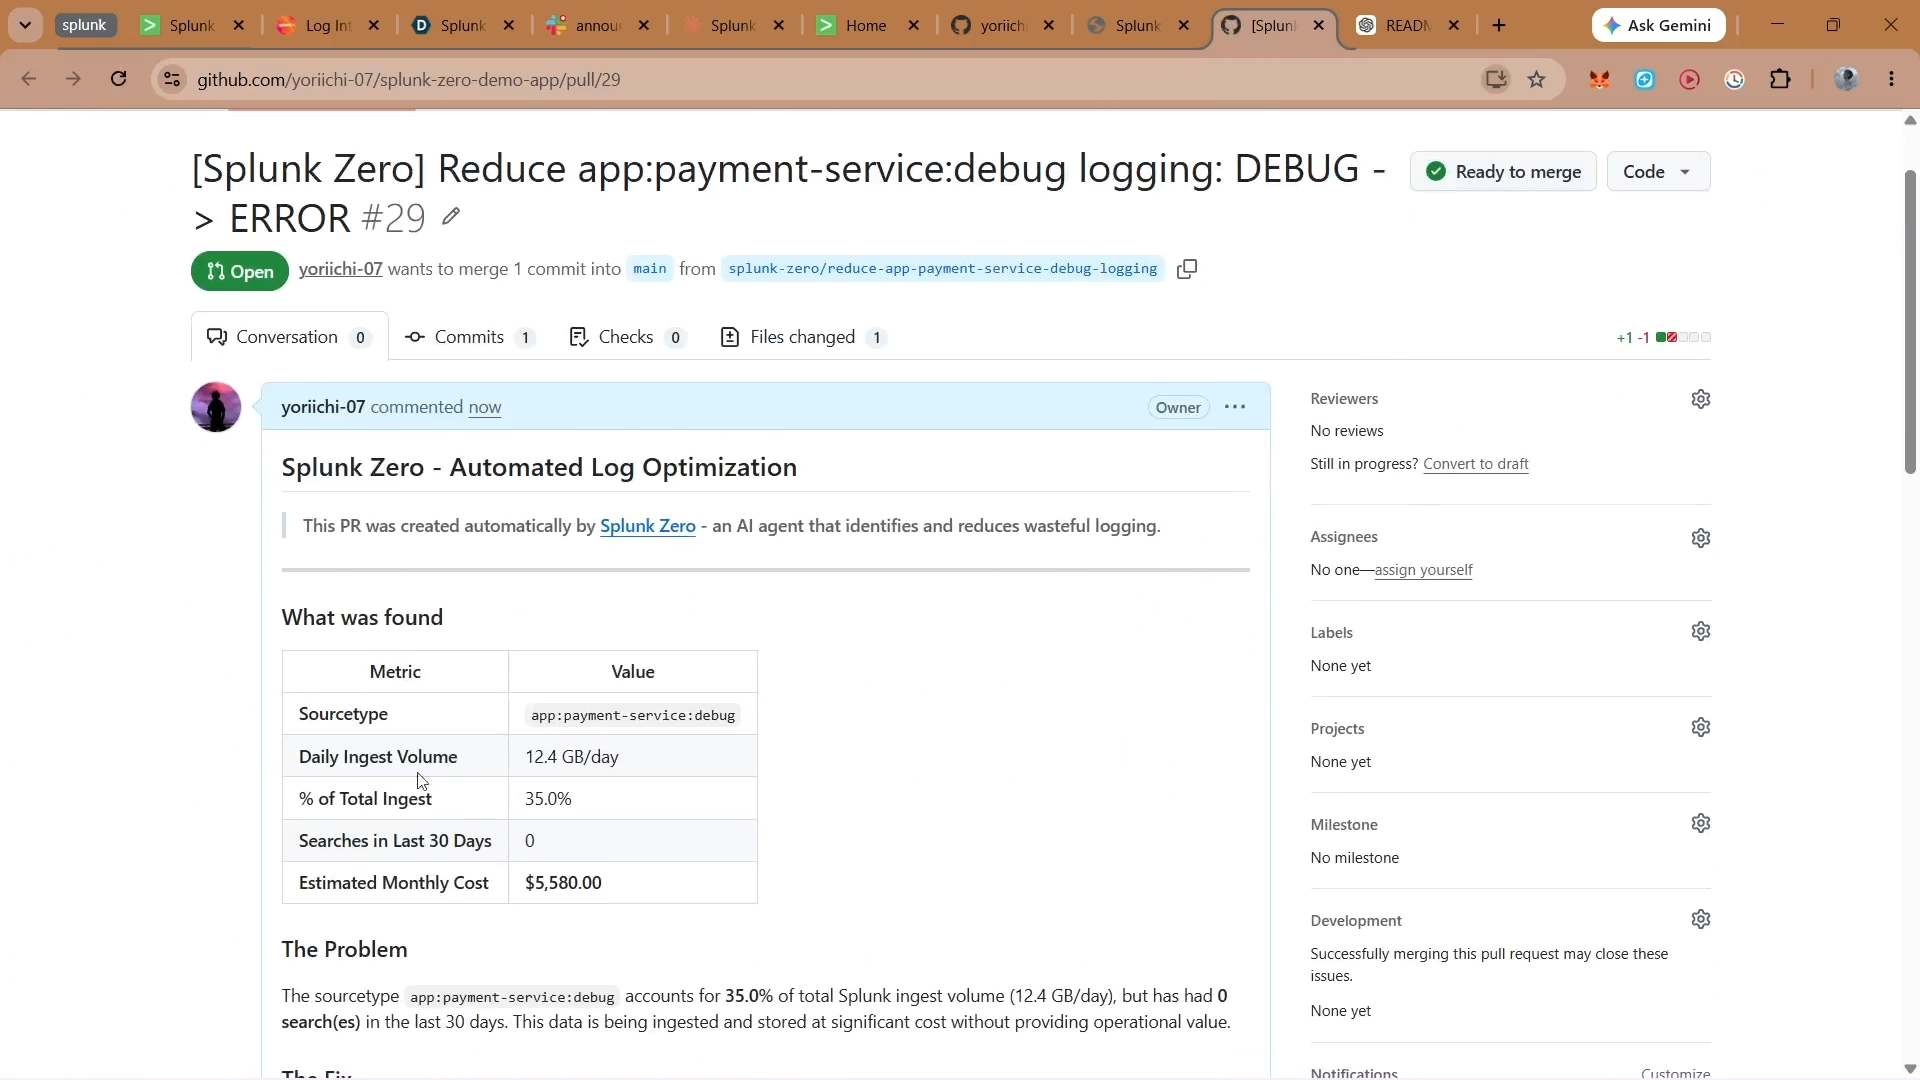
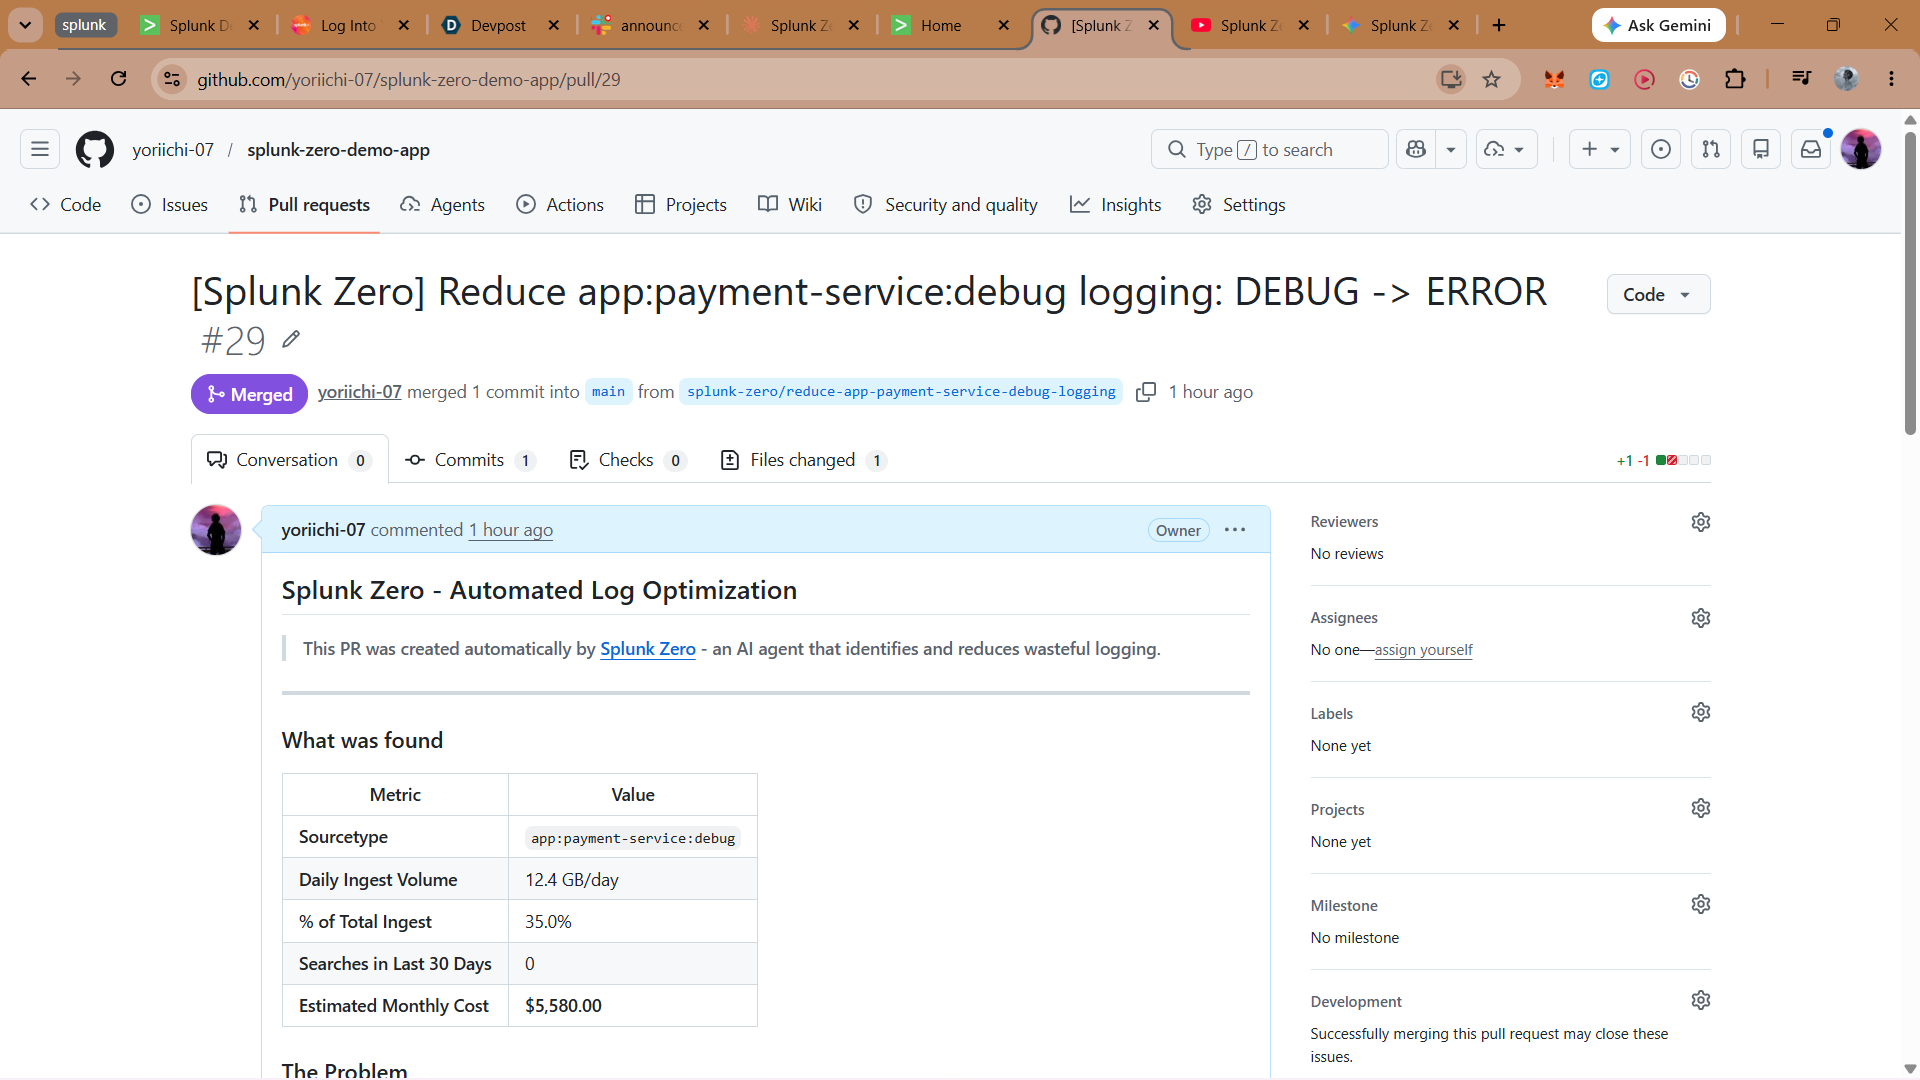
Pull request on GitHub — includes cost evidence table with daily GB, search count, and monthly savings
-
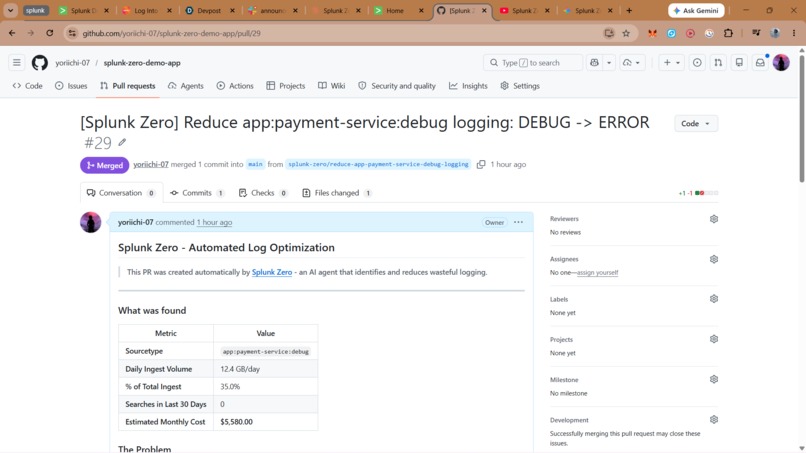
PR merged
-
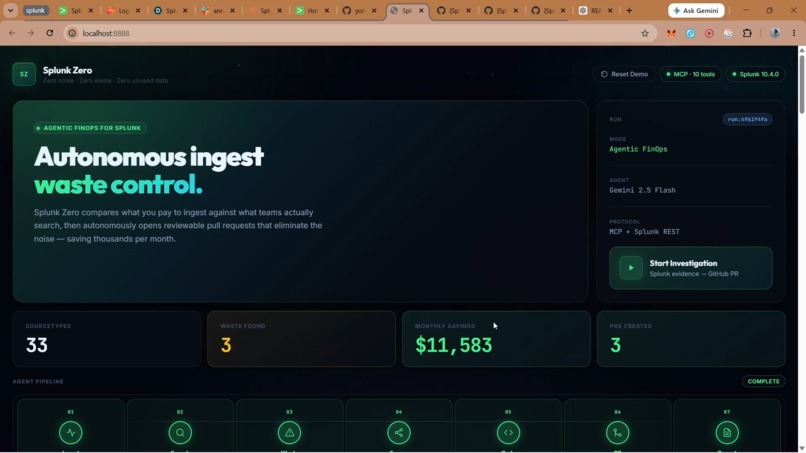
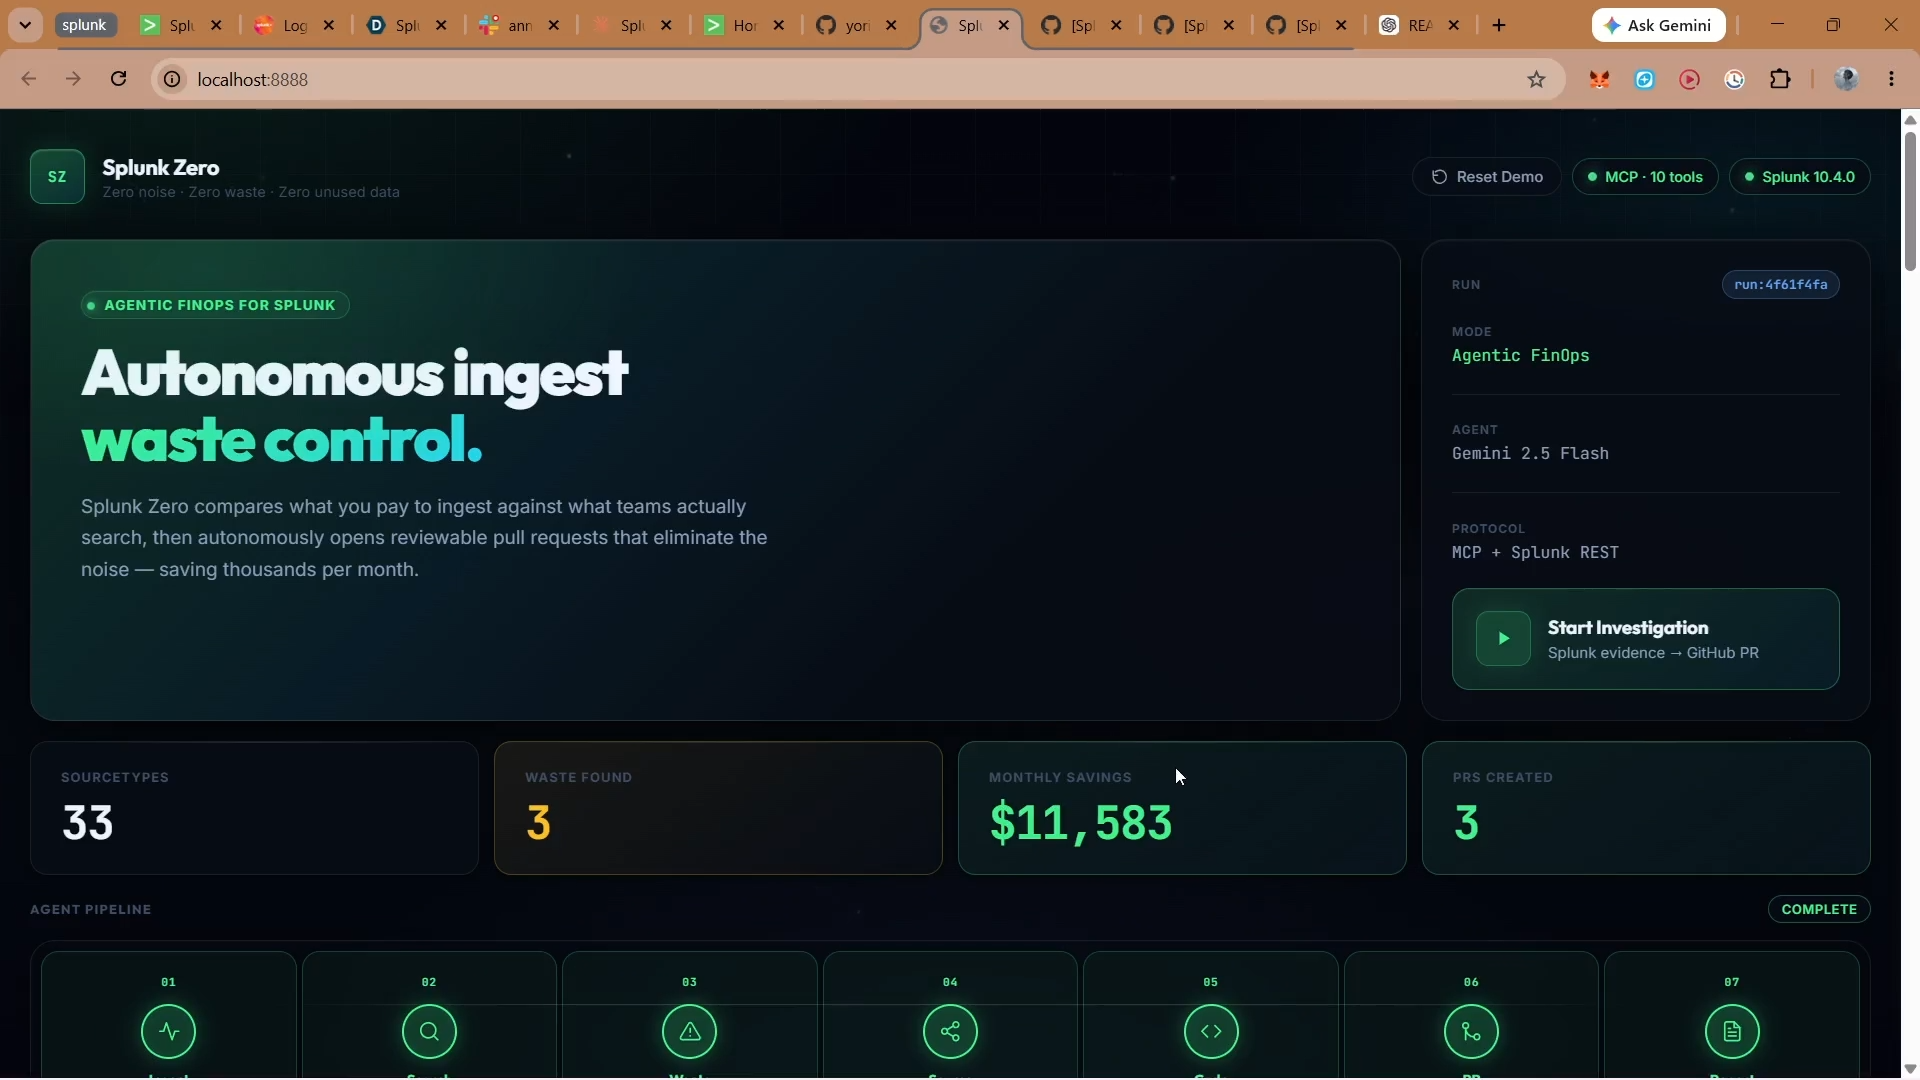
Final Investigation Summary and completed agent pipeline showcase (can be seen at bottom)
Inspiration
Anyone who has run Splunk at scale knows the quiet pain of ingest waste. A service gets switched to DEBUG during an incident, the fix ships, and the verbose logs keep flowing for weeks. Nobody searches them. Nobody owns them. But the bill keeps growing.
Most cost tools stop at a dashboard: “here is where money is burning.” We wanted Splunk Zero to go further. If Splunk can prove which log streams are expensive, and _audit can prove whether anyone actually uses them, why should a human still have to hunt through repositories and open the cleanup PR by hand?
So we built Splunk Zero as an autonomous FinOps agent for Splunk: it finds unused high-volume logs, traces them back to code, proposes a safe logging change, and opens the GitHub pull request with the cost evidence attached.
What it does
Splunk Zero turns Splunk operational data into reviewable source-code changes.
Measures ingest waste It queries Splunk’s
_internalindex to find the sourcetypes consuming the most ingest volume.Checks whether the data is actually used It queries
_auditto see which sourcetypes have been searched in the last 30 days.Detects waste deterministically High-ingest application logs with zero or very low search activity are flagged as waste. In our demo run, Splunk Zero found 3 unused debug sourcetypes worth $11,583/month.
Traces logs back to GitHub The agent maps each wasteful sourcetype to the repository and logging configuration that produced it.
Proposes a safe code change It reads the logging config and changes noisy modules from
DEBUGtoERROR, leaving the fix reviewable instead of applying it directly to production.Creates the pull request Splunk Zero creates the branch, commits the logging change, and opens a GitHub PR with the evidence: daily GB, percent of total ingest, 30-day search count, estimated monthly savings, and annual savings.
Shows its work live The frontend streams every step as a “UI of Thinking”: MCP tool discovery, Splunk queries, waste detection, source tracing, code analysis, PR creation, and final impact report.
How we built it
Splunk Zero is built around a 7-node LangGraph pipeline:
| Step | Node | Responsibility |
|---|---|---|
| 1 | Ingest Analysis | Gemini agent uses Splunk MCP tools to query _internal ingest volume |
| 2 | Search Audit | Gemini agent uses Splunk MCP tools to query _audit search activity |
| 3 | Waste Detection | Deterministic Python logic cross-references cost vs. usage |
| 4 | Source Tracing | Maps wasteful sourcetypes to GitHub repositories and config files |
| 5 | Code Analysis | Gemini reads logging configs and proposes log-level reductions |
| 6 | PR Creation | PyGithub creates branches, commits changes, and opens PRs |
| 7 | Report | Emits the final savings summary and PR links |
The backend is FastAPI with Server-Sent Events for live streaming. Splunk access is handled through a custom MCP-aware client that can call the Splunk MCP Server over JSON-RPC and fall back to Splunk REST when needed. The UI is a vanilla HTML/CSS/JS operational dashboard designed to make the agent’s reasoning auditable in real time.
For the AI layer, we used Gemini 2.5 Flash via Vertex AI. We deliberately kept the riskiest decision, waste detection, outside the LLM. Gemini helps reason about source mapping and config edits, but the cost/usage verdict comes from Splunk evidence and deterministic code.
Challenges we ran into
The hardest part was connecting a generic Splunk sourcetype back to the code that produced it. Logs rarely arrive with a clean label like “this came from repo X and file Y.” We had to make the agent behave like a platform engineer: inspect sourcetype names, logging conventions, repo structure, and config files before attempting any code change.
We also had to make MCP usage visible and reliable. Splunk’s MCP endpoint behaved differently from a standard SSE client flow in our local environment, so we implemented a custom HTTP POST JSON-RPC transport wrapper and surfaced MCP tool readiness directly in the UI. That gave judges a visible green MCP status, live tool names, and per-query MCP events.
Another major challenge was trust. Nobody wants an AI agent silently changing production logging. Our answer was to make the agent create pull requests, not direct production changes, and to include the exact Splunk evidence inside every PR body.
Accomplishments that we're proud of
We closed the loop. Splunk Zero does not just identify waste; it acts on it.
In one completed demo run, it found 33 sourcetypes, detected 3 wasteful debug streams, estimated $11,583/month in savings, and created 3 GitHub pull requests with cost evidence attached.
We are proud that the system combines agentic reasoning with hard guardrails: Splunk provides the evidence, Python decides whether the waste threshold is met, Gemini proposes the code change, and GitHub keeps the human review step intact.
We are also proud of the live investigation UI. It makes the agent inspectable: you can watch MCP tools become available, see Splunk queries run, watch waste get detected, and click through to the generated PRs.
What we learned
The most valuable agentic systems are not the ones that simply explain problems. They are the ones that can move from evidence to action while preserving trust.
We learned that LLMs are best used where ambiguity exists: mapping sourcetypes to services, understanding logging configs, and drafting code changes. But the financial verdict should come from measured data. Splunk Zero works because the model does not get to invent the waste; Splunk proves it.
We also learned that UI matters for agent trust. A judge or platform engineer should not have to guess what the agent is doing. The reasoning, tool calls, evidence, and resulting PRs should be visible as they happen.
What's next for Splunk Zero
Next, we want to expand Splunk Zero beyond demo repositories into real multi-repo environments with richer source tracing: deployment manifests, service catalogs, ownership metadata, and CI/CD context.
We also want to add pre-merge validation so every generated PR runs application tests and logging safety checks before a reviewer sees it.
Longer term, Splunk Zero can become a broader observability FinOps agent: supporting Datadog, New Relic, and OpenTelemetry pipelines, detecting waste before it reaches production, and continuously keeping telemetry useful instead of noisy.

Log in or sign up for Devpost to join the conversation.