## Inspiration
Splunk's own AI — AppInspect AI Intelligence Reports, the AI Assistant — is excellent at explaining what's wrong. But a developer still has to do the resolving, re-validating, and remembering by hand. Onboarding a new data source, getting an app through AppInspect, and writing cost-aware SPL are exactly the expert-gated, repetitive tasks that eat an afternoon and leave no audit trail. We wanted to close that loop: an agent that doesn't just describe a failure, but fixes it, proves the fix against real Splunk, and records why.
Our one-line thesis: Splunk's AI explains failures. This copilot resolves, validates, and remembers them.
What it does
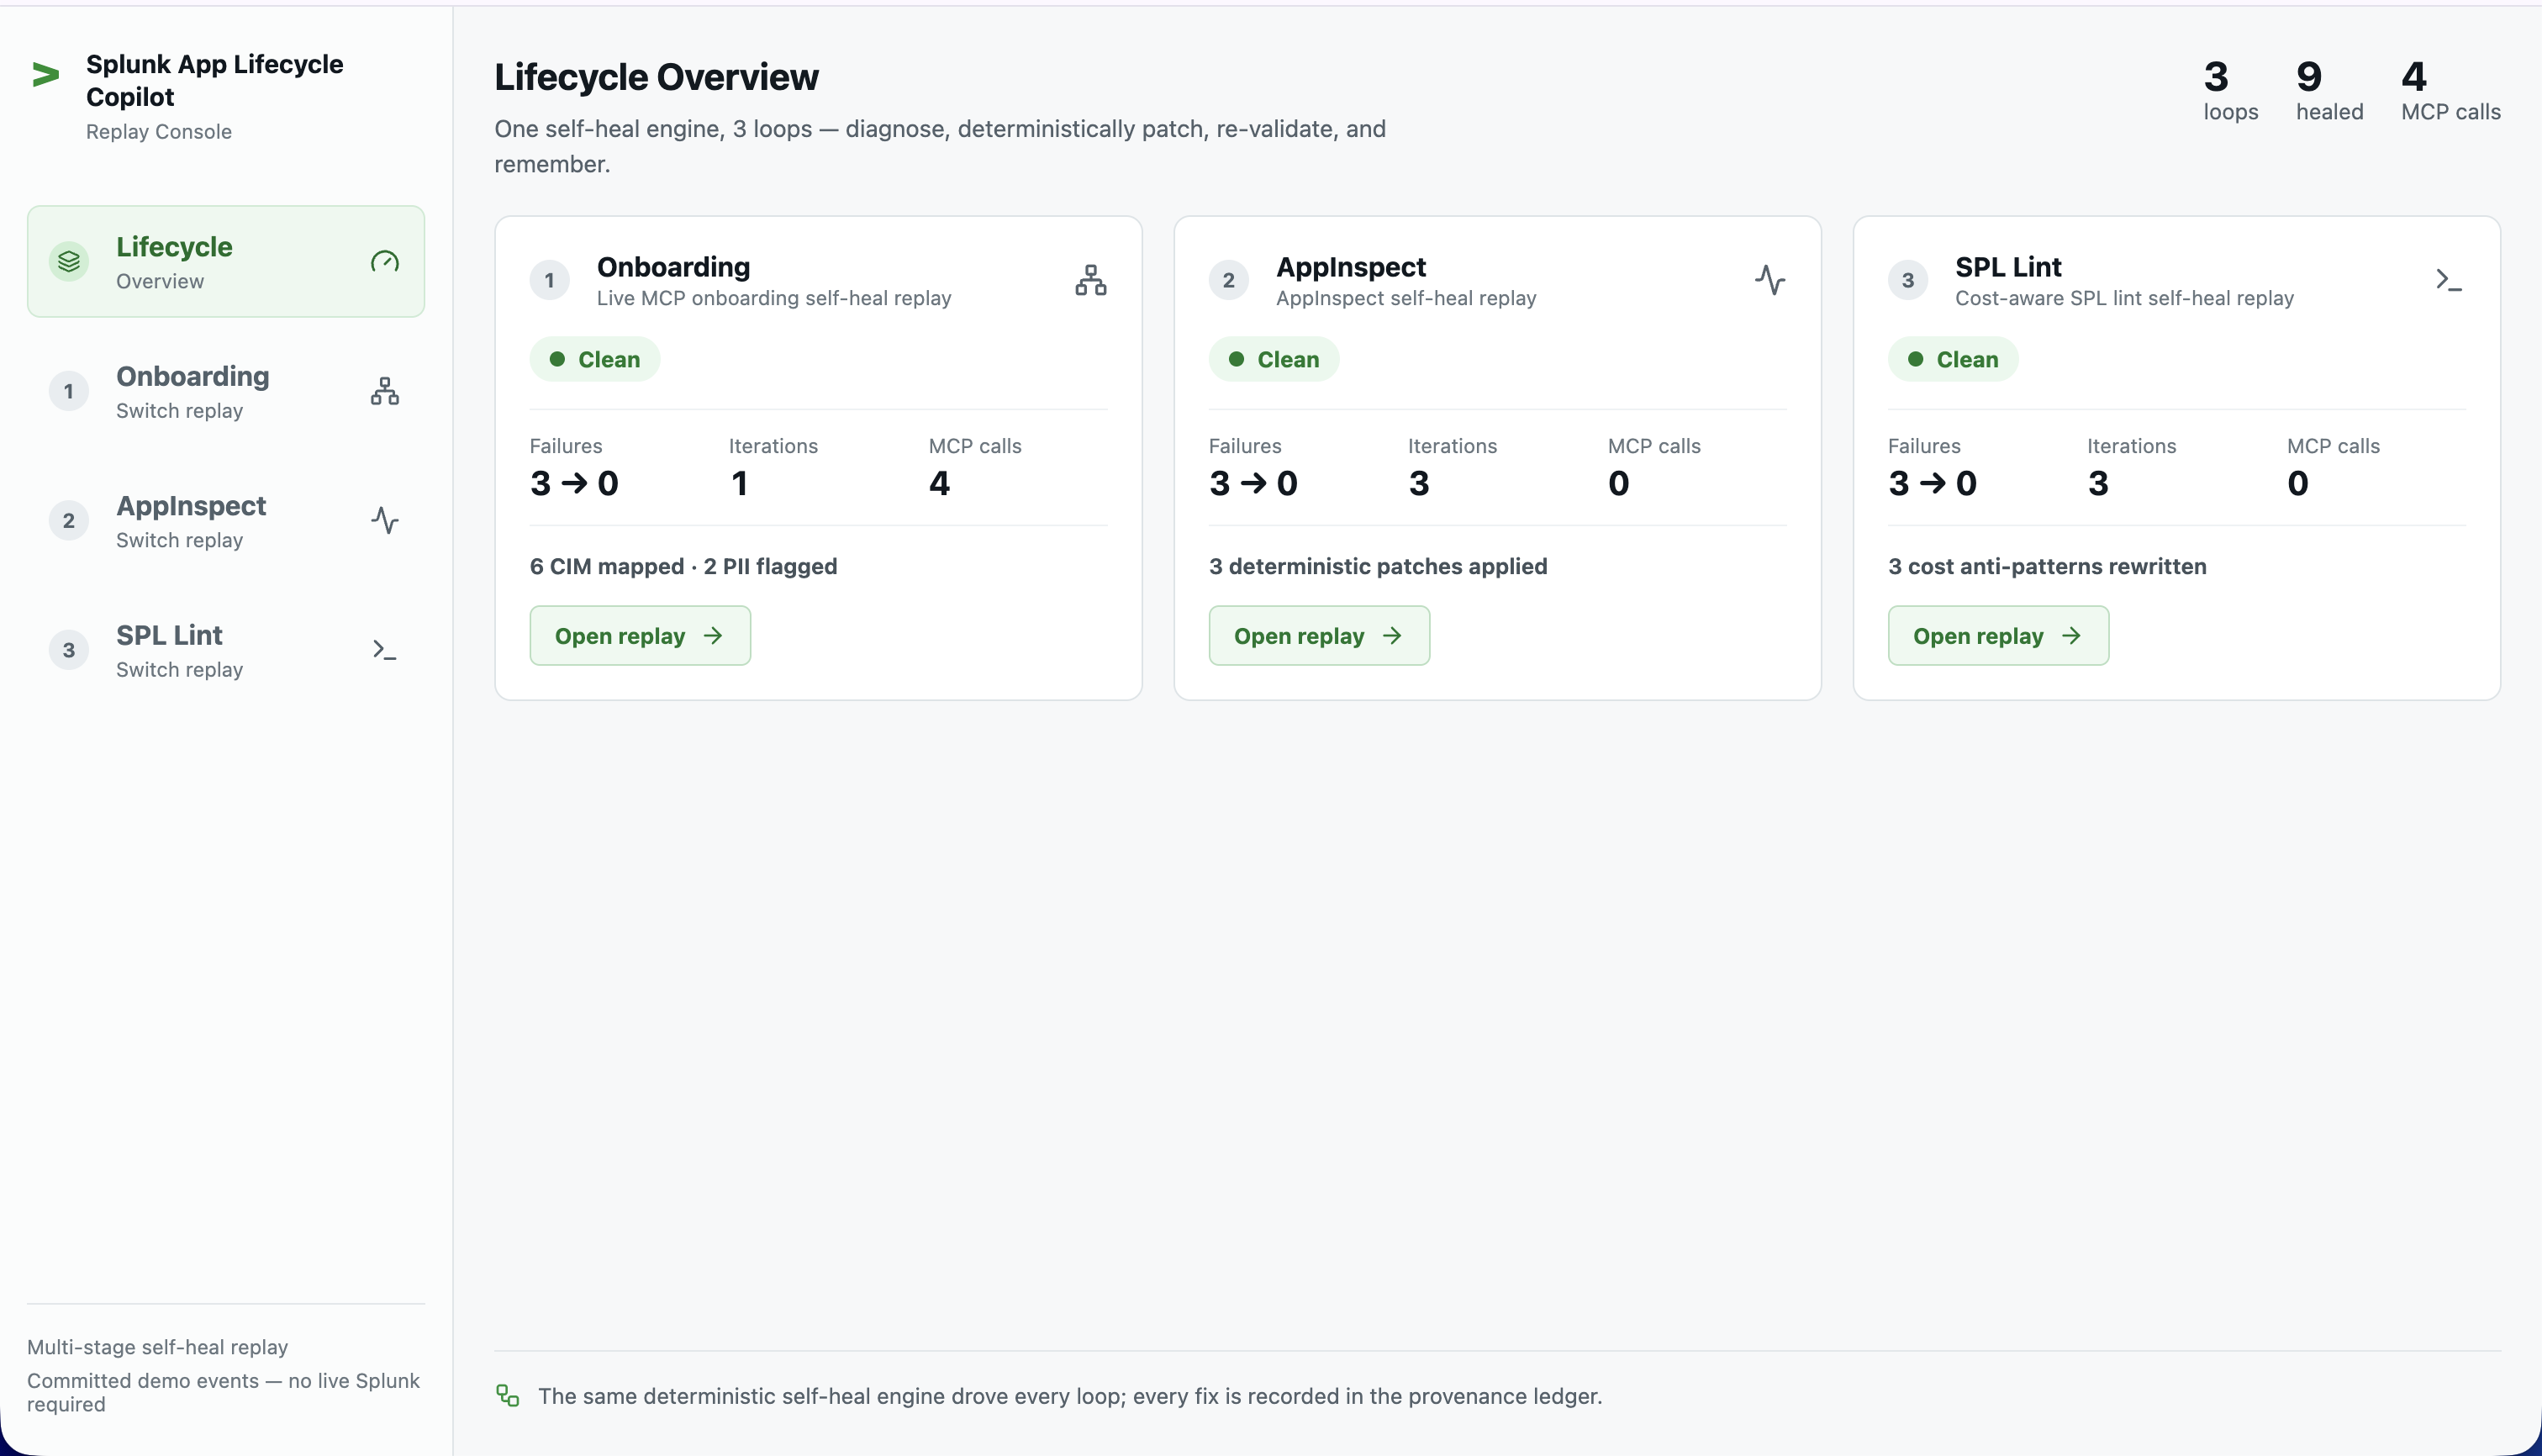
One shared, artifact-agnostic self-heal engine — diagnose → select a deterministic patch → apply → re-validate → repeat — drives three working loops across the Splunk app lifecycle:
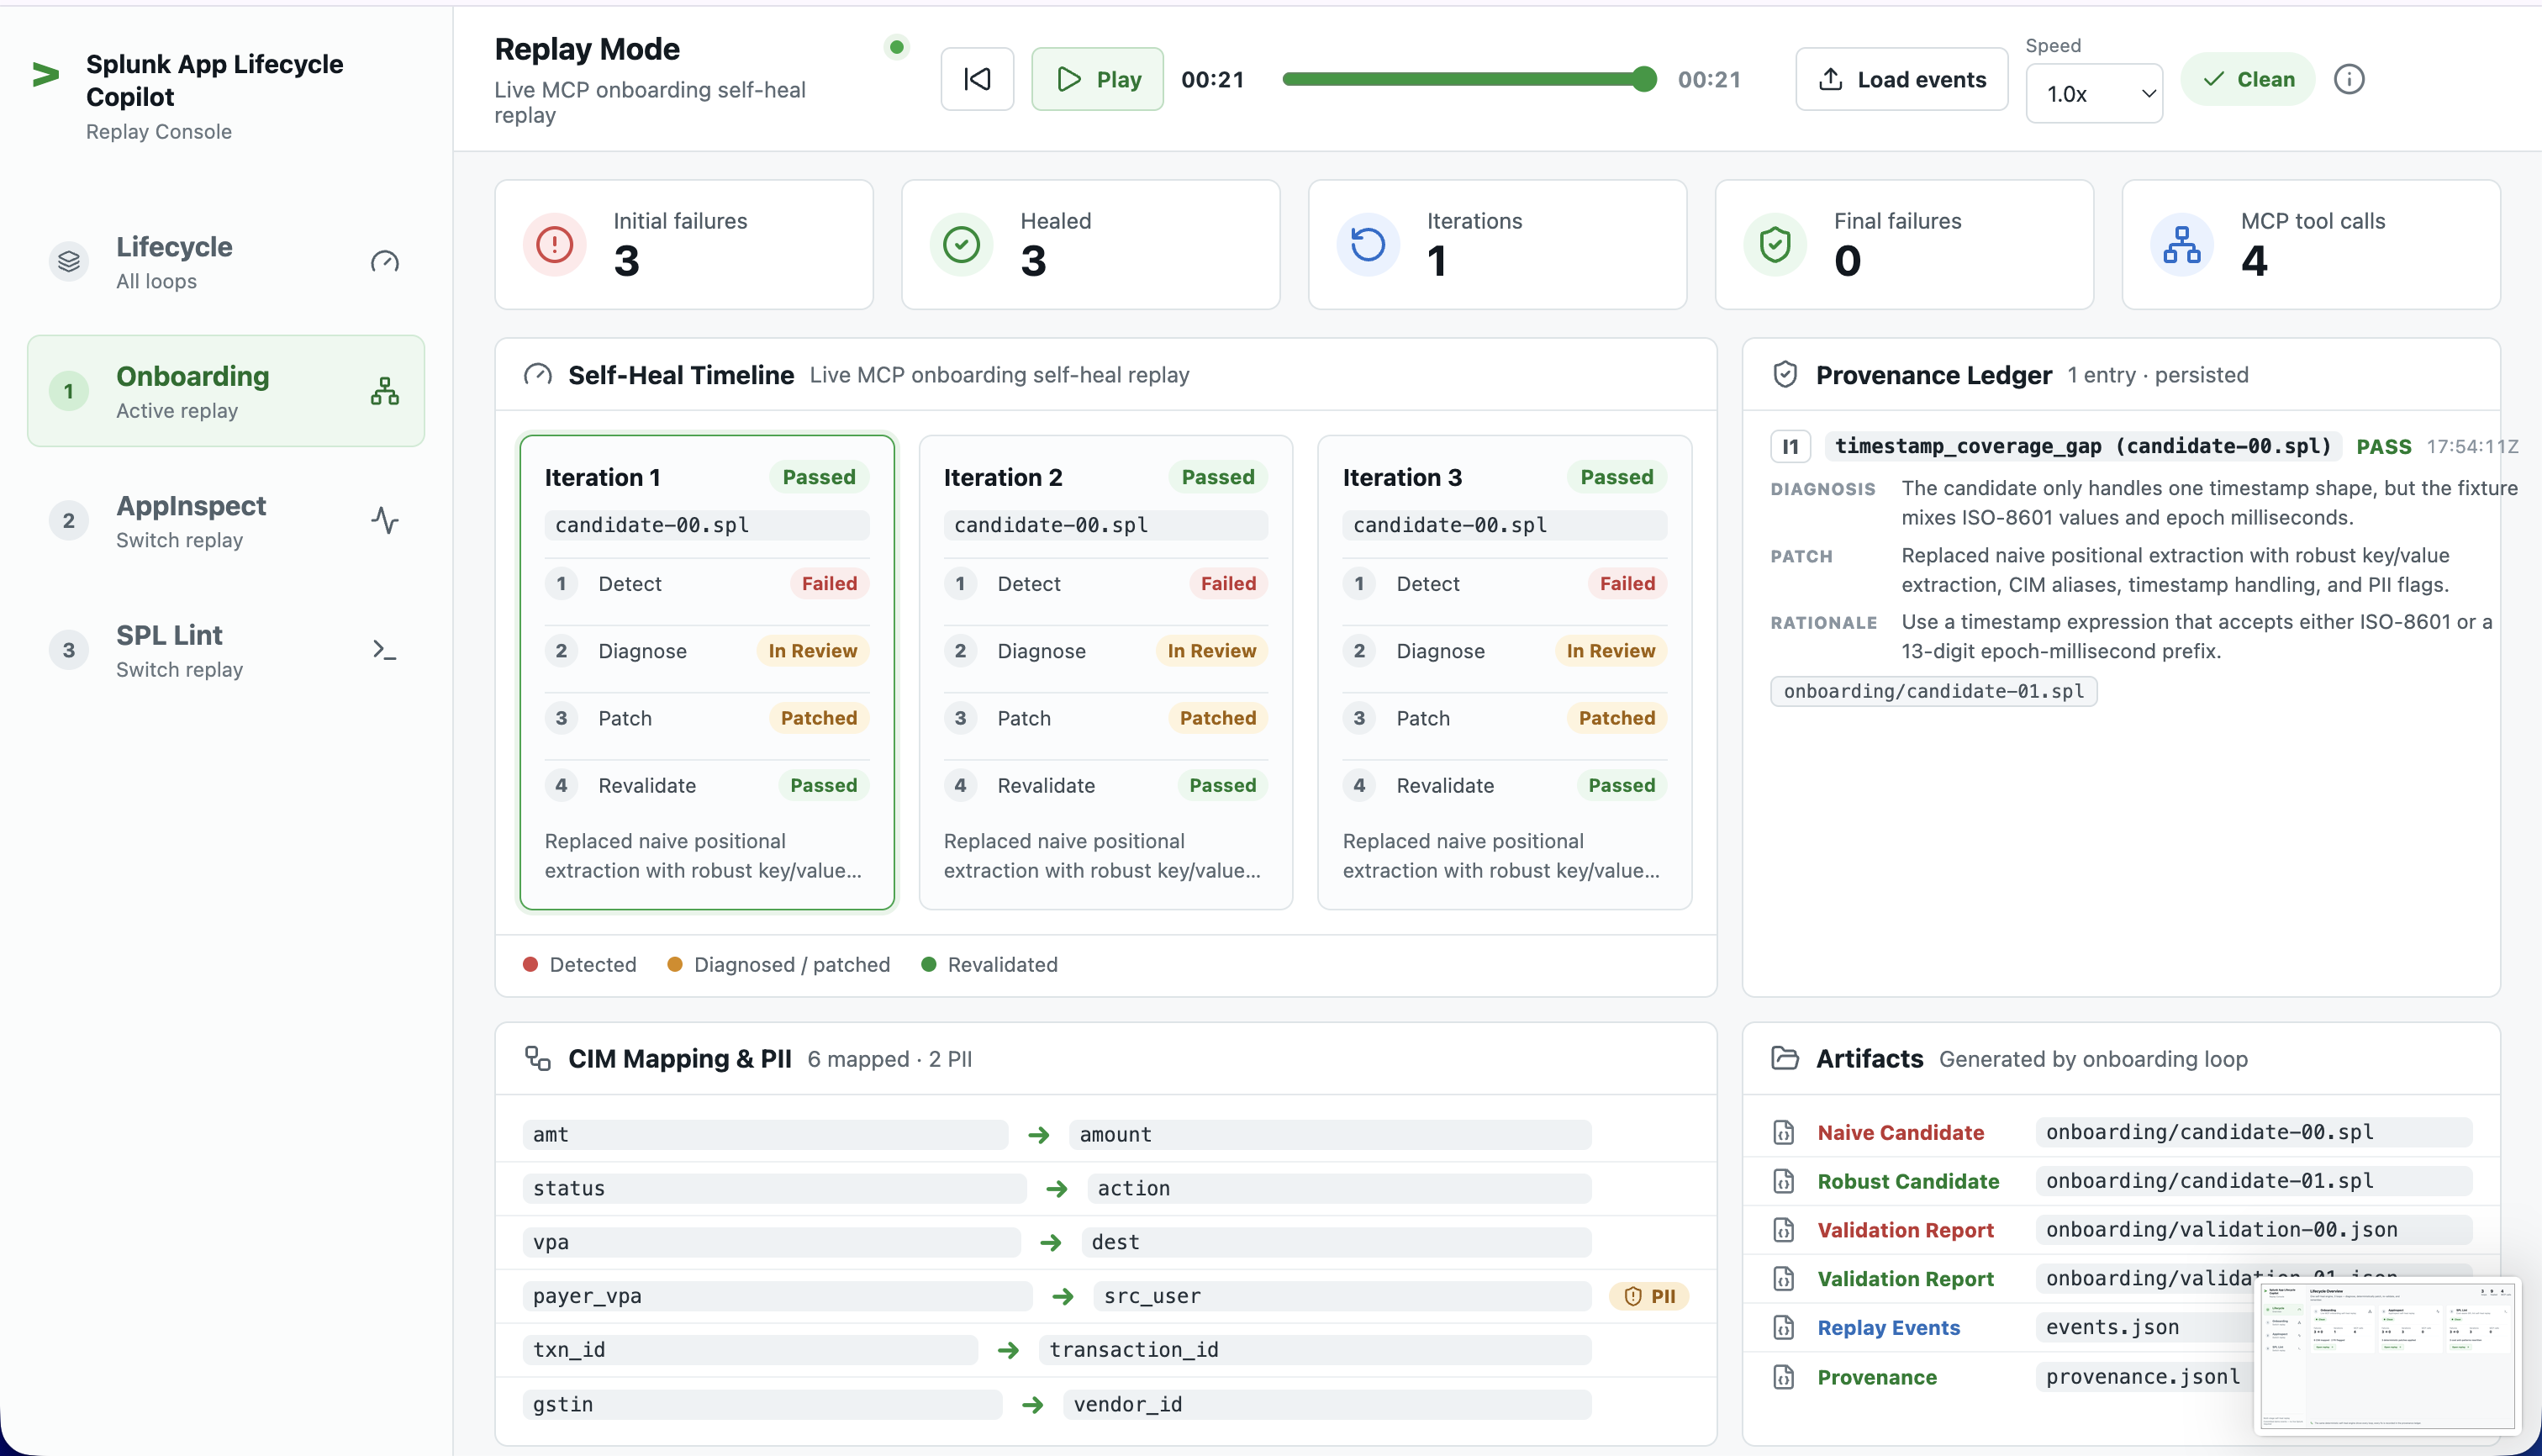
Onboarding (live MCP). Ingests a raw UPI/GST-style log sample through HEC, then validates inline
rex/evalfield-extraction candidates against the real indexed events via the Splunk MCP server'ssplunk_run_query. It diagnoses coverage, CIM-mapping, and PII gaps, swaps to a more robust candidate, and re-validates until clean. On our fixture: 150 events ingested, 6 realsplunk_run_querycalls, 3 gaps → 0, 6 CIM mappings (amt→amount,status→action,vpa→dest,payer_vpa→src_user,txn_id→transaction_id,gstin→vendor_id) and 2 PII flags (payer_vpa,payer_mobile).AppInspect (static). Runs
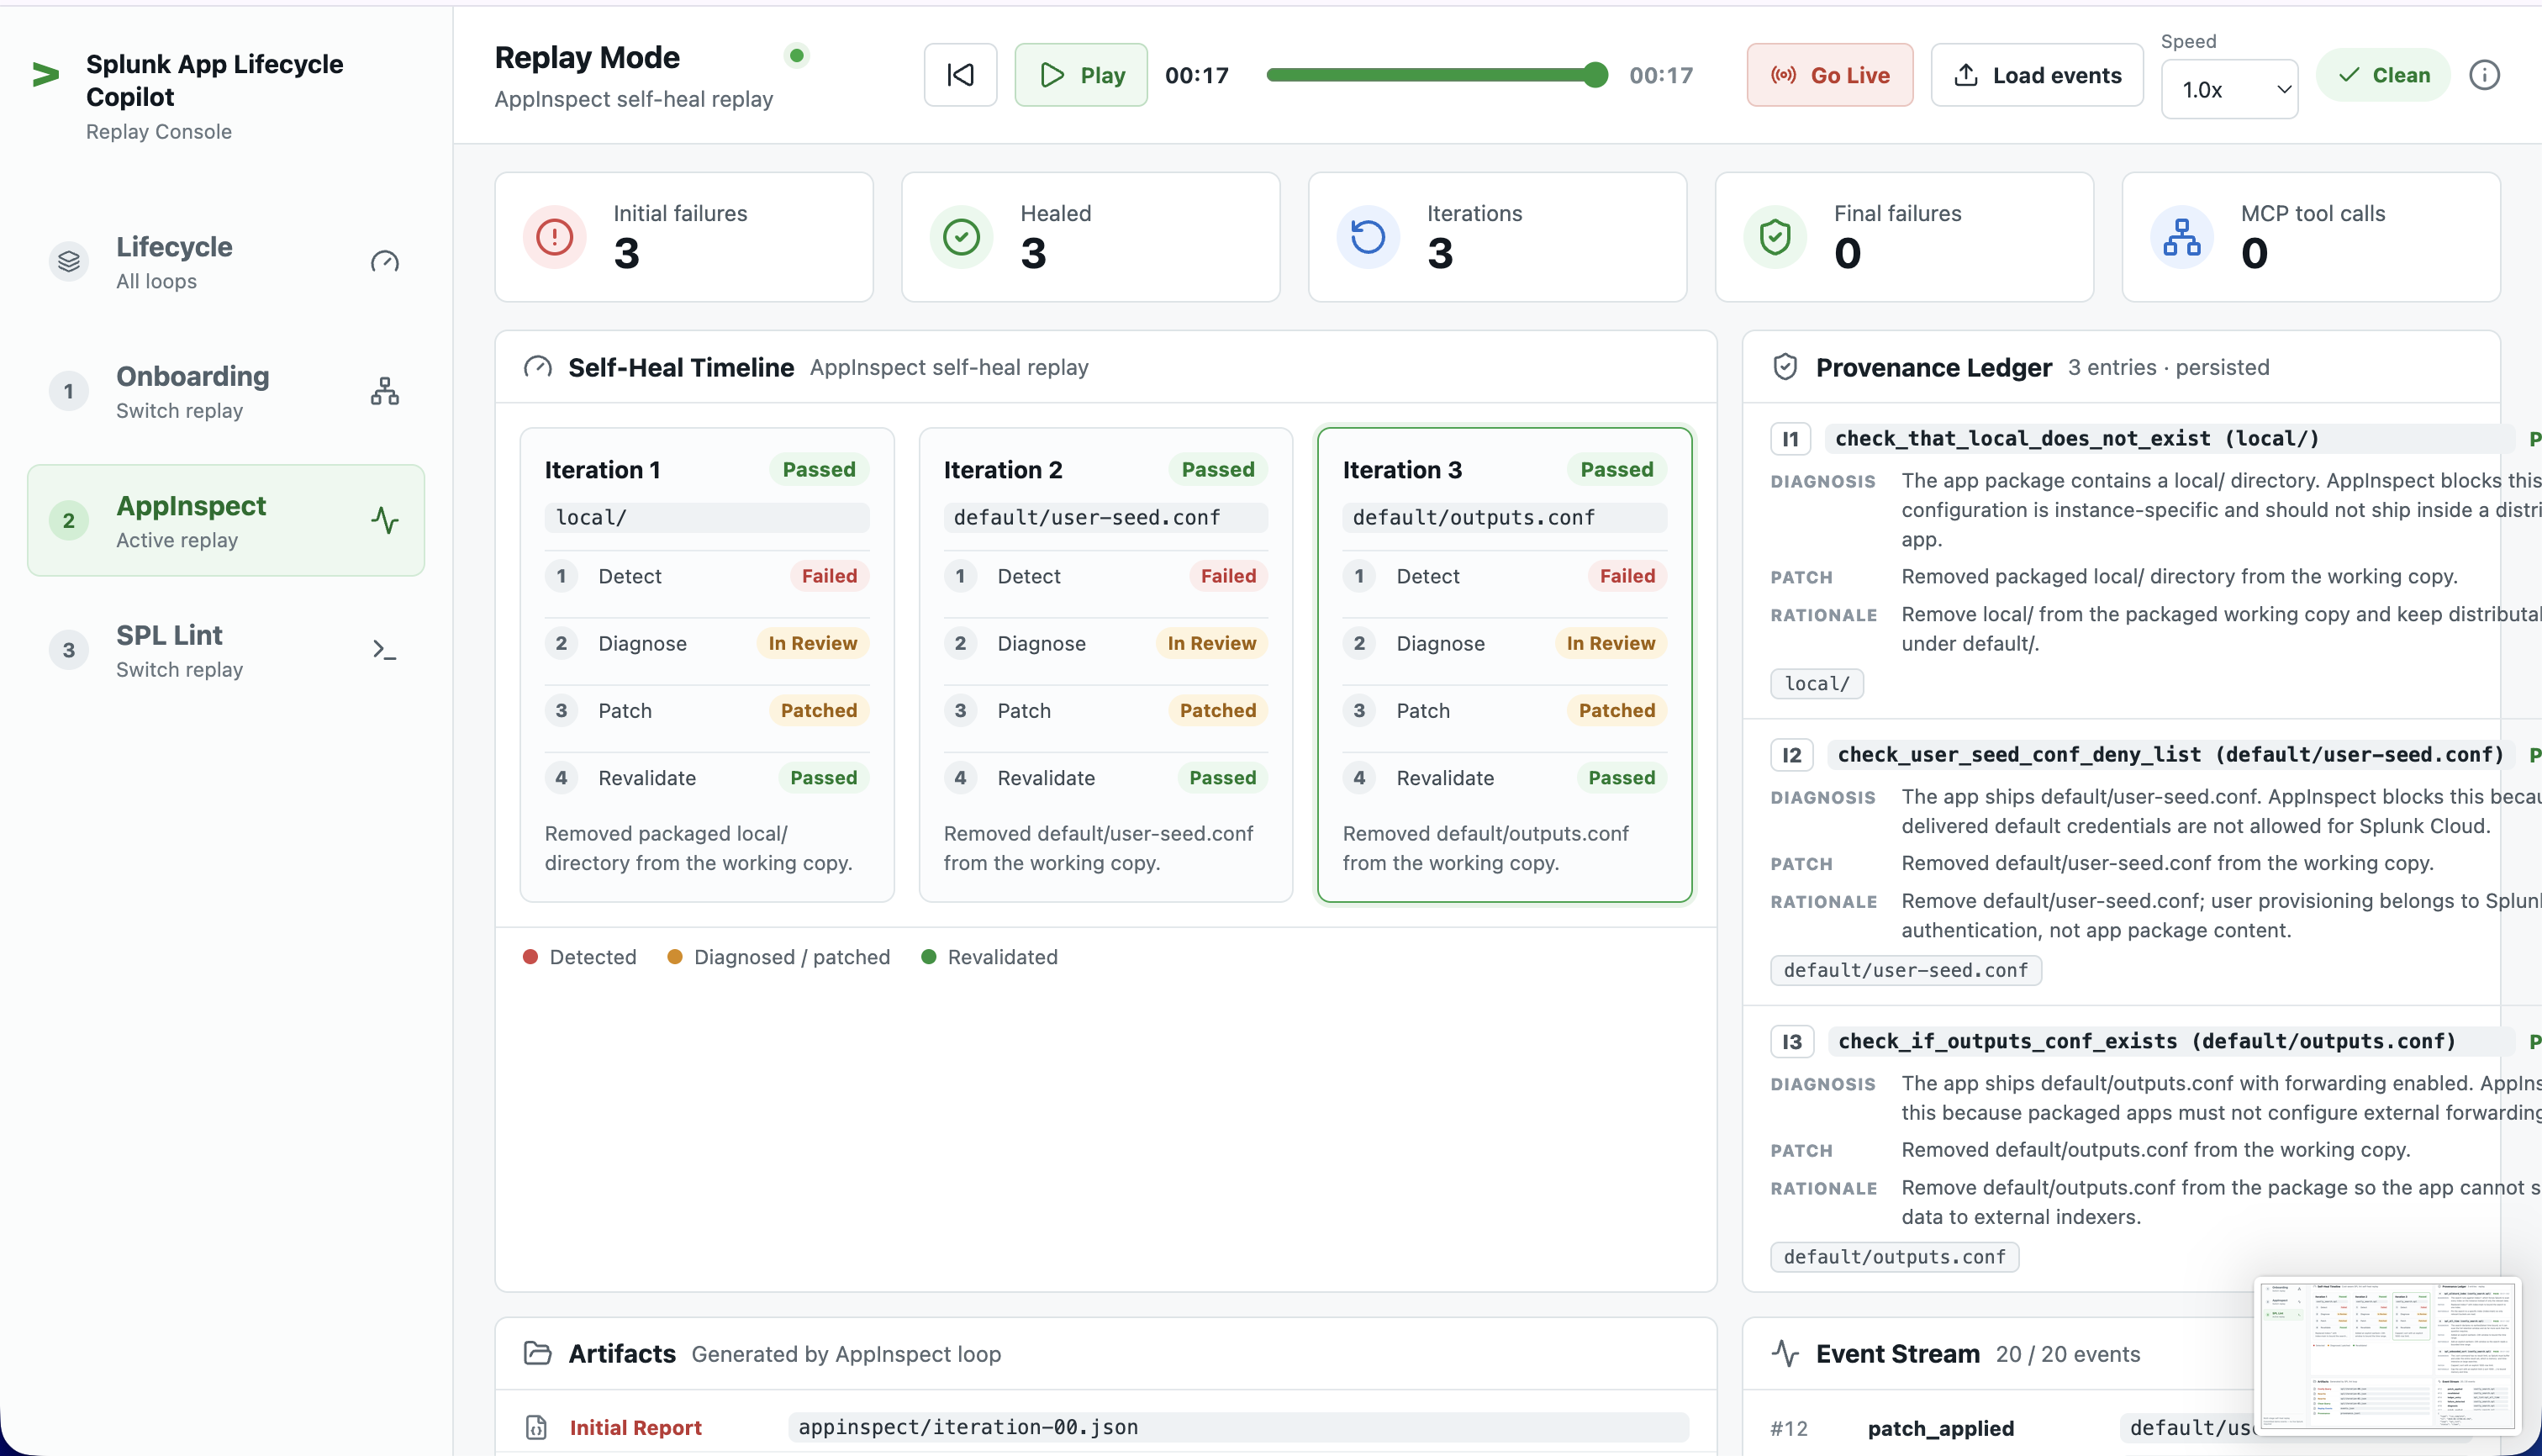
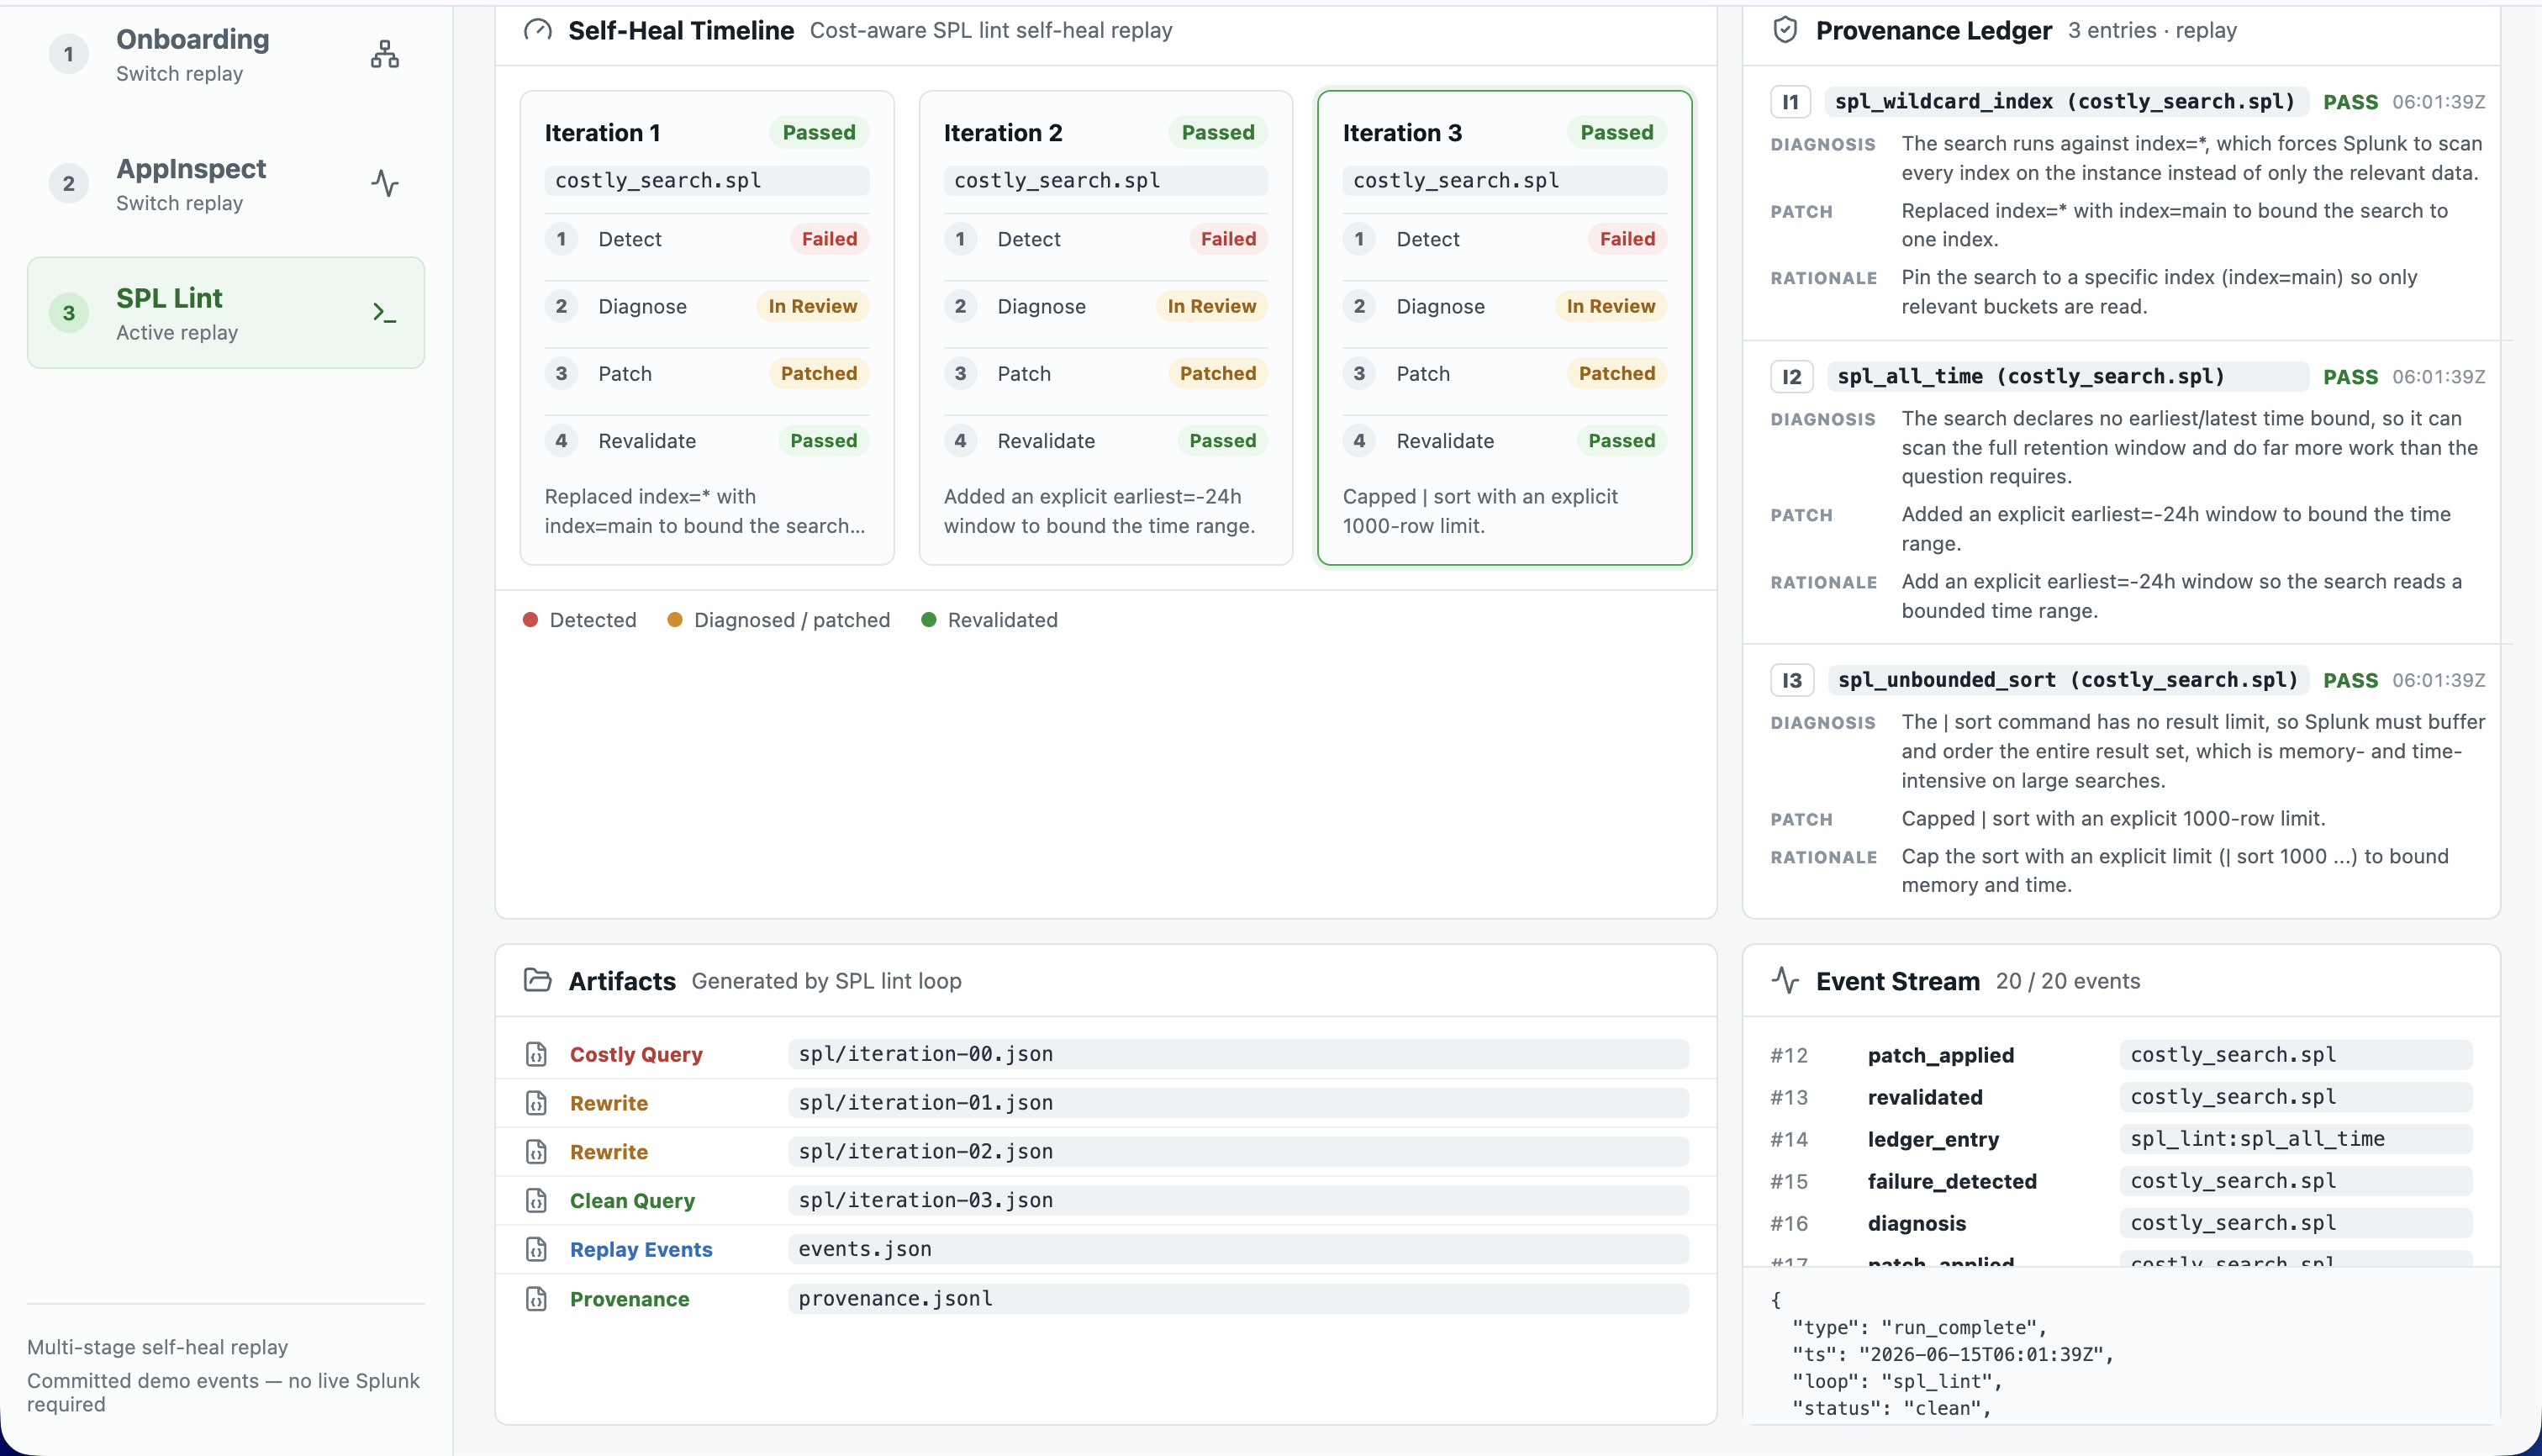
splunk-appinspecton a deliberately broken app, parses the JSON failures, applies deterministic patch functions (remove forbiddenlocal/,default/user-seed.conf, forwardingoutputs.conf), and re-runs until zero failures. No live Splunk required.Cost-aware SPL lint (static). Lints a deliberately costly search for anti-patterns (
index=*, no time bound, unbounded| sort) and applies deterministic rewrites (index=main,earliest=-24h,| sort 1000) until clean.
Every patch across every loop is appended to a provenance ledger — {stage, iteration, failure, diagnosis, patch, rationale, validation_result, timestamp, changed_paths} — the "and remember" half of the thesis.
A React dashboard replays all three loops from committed events (zero dependencies), opening on a Lifecycle overview and drilling into each stage's timeline, metrics, CIM/PII panel, and a full provenance audit trail. It also has a Live mode: a "Go Live" button streams a loop's events over Server-Sent Events as it actually runs, rendered through the same reducer as replay. The same copilot agent is wired into VS Code as Run Task / Run-and-Debug entry points.
How we built it
- Python package
lifecycle_copilot(CLI:copilot) built around a singleSelfHealEnginereused verbatim by all three loops — only the diagnosis source and patch registry differ. Crucially, the LLM produces diagnosis and rationale text only; concrete file changes come from deterministic patch functions in a constrained registry. That keeps every run reproducible and the audit trail defensible. - Splunk MCP server as the action surface for onboarding: an encrypted-token-authenticated streamable-HTTP client calling
splunk_run_queryto validate extractions against real events. HEC for ingestion;splunklibSDK where simpler than MCP. splunk-appinspectCLI for the AppInspect loop; a small deterministic SPL cost ruleset for the lint loop.- Dashboard: React + TypeScript + Vite + Bun, with a pure, unit-tested event-stream reducer that renders replay and live identically. Live transport is a Starlette + SSE server that runs a static loop in a background thread and streams each emitted event via an
on_eventhook →asyncio.Queue→ SSE. - Splunk Enterprise in Docker (
splunk/splunk:latest) with HEC enabled for the live onboarding slice. - Quality: green test suite — 32 Python tests + 18 dashboard tests, ruff clean, dashboard
tsc+vite buildgreen.
Challenges we ran into
- Indexing race. HEC acknowledges before indexing completes, so the first MCP validation could see zero events and mis-diagnose. We added a bounded settle step that polls
| stats countthroughsplunk_run_queryuntil the indexed count matches what was ingested — making runs deterministic. (You can see this as theindex_settle-purpose MCP calls in a real run.) - One patch, many gaps. The onboarding candidate swap heals the timestamp, CIM, and PII gaps at once, but only the selected gap emits per-failure events. The dashboard reducer backfills the others on a clean completion so the timeline reads as fully healed.
- Encrypted MCP token. The MCP token is RSA-encrypted by the Splunk MCP Server app — not a REST bearer token. Minting and wiring it correctly, including a relative-expiry quirk, took real care.
- Python 3.13, not 3.14. On Python 3.14, AppInspect's bundled static analyzer fails to initialize and reports every Python check as an
error, so the loop could never reach a clean result even after patching the real failures. We pinned the interpreter to 3.13 and documented it rather than weakening our "clean means zero failures and zero errors" definition. - Keeping it honest. We deliberately constrained the LLM to text and kept patches deterministic, so judges can trust the audit trail and reproduce every run.
Accomplishments that we're proud of
- One engine, three loops. Adding the SPL lint loop reused the self-heal engine verbatim — the platform thesis made concrete, not aspirational.
- A live, end-to-end MCP-validated onboarding run: 150 events ingested, three gaps healed, six CIM mappings, two PII flags, six real
splunk_run_querycalls — the MCP integration is load-bearing, not decorative. - A dashboard that runs in both replay and live mode off the same reducer, fully responsive, with a real provenance audit trail.
- Deterministic, reproducible loops backed by a green test suite.
## What we learned
The leverage is in the closed loop plus provenance, not in a bigger model. Constraining the agent to diagnosis text and deterministic patches gave us repeatability and a defensible audit trail — and made the "one engine, many loops" platform story credible. We also learned how much of "production-readiness" in Splunk is really about validating against real data (the MCP splunk_run_query oracle) rather than reasoning about logs in the abstract.
What's next for Splunk App Lifecycle Copilot
- Stage 3 (app scaffold + synthetic test-data generation) and Stage 5 (Simple XML → Dashboard Studio migration) on the same engine.
- Use
splunk_get_knowledge_objectsto reconcile extractions against existing field extractions and data models before proposing new ones. - Emit final
props.conf/transforms.conffrom the onboarding loop, not just validated candidates. - Surface the provenance ledger back into Splunk as an index — so the audit trail of every automated fix is itself searchable in Splunk.
Built With
- bun
- cim
- docker
- hec
- python
- react
- server-sent-events
- splunk
- splunk-appinspect
- splunk-mcp-server
- starlette
- typescript
- vite

Log in or sign up for Devpost to join the conversation.